Back to Journals » Journal of Experimental Pharmacology » Volume 8
Projection neurons in the cortex and hippocampus: differential effects of chronic khat and ethanol exposure in adult male rats
Authors Alele PE ![]() , Matovu D, Imanirampa L, Ajayi AM
, Matovu D, Imanirampa L, Ajayi AM ![]() , Kasule GT
, Kasule GT
Received 3 June 2016
Accepted for publication 26 August 2016
Published 13 October 2016 Volume 2016:8 Pages 43—52
DOI https://doi.org/10.2147/JEP.S114272
Checked for plagiarism Yes
Review by Single anonymous peer review
Peer reviewer comments 2
Editor who approved publication: Professor Bal Lokeshwar
Paul E Alele,1 Daniel Matovu,1 Lawrence Imanirampa,2 Abayomi M Ajayi,3 Gyaviira T Kasule,4
1Department of Pharmacology and Therapeutics, 2Department of Pharmacy, Faculty of Medicine, Mbarara University of Science and Technology, Mbarara, Uganda; 3Department of Pharmacology and Therapeutics, Faculty of Basic Medical Sciences, College of Medicine, University of Ibadan, Ibadan, Nigeria; 4Department of Anatomy, Histology and Embryology, Faculty of Medicine, Mbarara University of Science and Technology, Mbarara, Uganda
Background: Recent evidence suggests that many individuals who chew khat recreationally also drink ethanol to offset the stimulating effect of khat. The objective of this study was to describe the separate and interactive effects of chronic ethanol and khat exposure on key projection neurons in the cortex and hippocampus of young adult male rats.
Methods: Young adult male Sprague Dawley rats were divided into six treatment groups: 2 g/kg khat, 4 g/kg khat, 4 g/kg ethanol, combined khat and ethanol (4 g/kg each), a normal saline control, and an untreated group. Treatments were administered orally for 28 continuous days; brains were then harvested, sectioned, and routine hematoxylin–eosin staining was done. Following photomicrography, ImageJ® software captured data regarding neuron number and size.
Results: No differences occurred in counts of both granular and pyramidal projection neurons in the motor cortex and all four subfields of the hippocampal formation. Khat dose-dependently increased pyramidal neuron size in the motor cortex and the CA3 region, but had different effects on granular neuron size in the dentate gyrus and the motor cortex. Mean pyramidal neuron size for the ethanol-only treatment was larger than that for the 2 g/kg khat group, and the saline control group, in CA3 and in the motor cortex. Concomitant khat and ethanol increased granular neuron size in the motor cortex, compared to the 2 g/kg khat group, the 4 g/kg khat group, and the 4 g /kg ethanol group. In the CA3 region, the 4 g/kg ethanol group showed a larger mean pyramidal neuron size than the combined khat and ethanol group.
Conclusion: These results suggest that concomitant khat and ethanol exposure changes granular and pyramidal projection neuron sizes differentially in the motor cortex and hippocampus, compared to the effects of chronic exposure to these two drugs separately.
Keywords: cortex, ethanol, granular neurons, hippocampus, khat, pyramidal neurons, concomitant exposure
Introduction
Khat and alcohol are two widely consumed drugs in East Africa that contribute significantly to the burden of drug abuse and dependence in this region. In some parts of East Africa, such as in Somalia and Ethiopia, it is estimated that up to 80%–90% of males use khat on a daily basis.1,2 While khat has traditionally been used alone, recent evidence suggests that many users now combine it with alcohol and other drugs such as marijuana.3,4 In Uganda, where alcohol is also widely consumed, the use of khat is legal and the current usage tendency, especially among urban users, is to combine khat with ethanol.3 Similarly, a recent study in Ethiopia reported that more than half of khat users also drank alcohol, and that a significant proportion of young khat users aged 15–24 routinely drank alcohol also.5,6
Khat (Catha edulis Forsk) is a wildly growing tree whose young shoots and leaves are chewed for its psychostimulant properties.7 The psychostimulant properties include euphoria and increased alertness, which, over several hours, recede to a quieted and contemplative state.3 Cathinone has been identified as the main active ingredient in khat8,9 and it produces effects similar to that of amphetamine. Alcohol (ethanol), in contrast, is a psychodepressant. Khat chewers who also drink alcohol, usually after the chewing session, indicate that alcohol helps bring them down from the high of khat, especially at bedtime, so as to reduce insomnia and to avoid dysphoria.6
Our prior study in a rat model suggested that codependence on both khat and ethanol increases seizure susceptibility and the severity of seizure activity.10 Because there have been no controlled studies comparing the neuron morphology following chronic exposure to both khat and ethanol, our goal was to evaluate the chronic effect of khat and ethanol on neuronal number and size in specific brain regions in adult male rats. We studied the motor cortex and the hippocampus because these brain regions are important components of the circuitry involved in the expression of behavioral manifestations of these drugs of abuse and of seizure activity.1 Importantly, the primary motor cortex (M1 - primary motor cortex; area 4) in the precentral gyrus is the origin of most of the corticospinal tract and a large number of cortical bulbar fibers, and influences the spread of excitation during seizure activity. The primary motor cortex also has projections to the thalamus and basal ganglion. The ventrolateral thalamic nucleus of the thalamus makes significant input to this nucleus, and the precentral gyrus also receives significant input from the sensory cortical areas as well as from the premotor portions of the cerebral cortex.
Conversely, the hippocampus is an integral part of the limbic system that is important for the expression of behaviors, such as seizure expression, during drug dependence and withdrawal. The hippocampus (sometimes designated the archicortex) consists of only three layers (unlike the cerebral cortex that is characterized by six distinct layers). Consequently, the dentate gyrus of the hippocampus is devoid of pyramidal neurons, while the cornu ammonis (CA) regions are devoid of granular neurons, but contain interneurons. In particular, we evaluated granular and pyramidal neuron number and size because these projection neurons are vital in the circuitry for the expression of behaviors such as seizure expression. Pyramidal cells are the most common type of neuron in the cerebral cortex, are found in all layers of the cortex except layer I (molecular layer), and are the predominant neurons in layers II, III, and V. Pyramidal neurons also fundamentally represent the only output pathway for the cerebral cortex and are consistently associated with excitatory (glutamatergic) neurotransmission. Our objective in this study, therefore, was to describe the separate and interactive effects of chronic ethanol and khat exposure on key projection neurons in the cortex and hippocampus of young adult male rats, specifically by determining the neuron number and size in these brain regions. These data should provide some insight into the putative effect of these drugs following chronic administration.
Materials and methods
Experimental design and animals
Animal conditions and experimental design were comparable to those in our previous study.10 Briefly, young adult male Sprague Dawley rats that were approximately 8 weeks old at the start of the experiments were used. The sample size for all the experiments was ten animals per treatment condition, with multiple replications done to reach the desired sample size needed for appropriate statistical reliability. Treatments were randomized by computer-generated random numbers obtained prior to starting experiments. The experimental animals were divided into six groups as follows: 2 g/kg khat, 4 g/kg khat, 4 g/kg ethanol, combined khat and ethanol (4 g/kg each), a normal saline control, and an untreated group. We used these doses of khat based on earlier related studies that showed the activity of fresh aqueous khat extracts without disproportionate effects,11 and because the absorption of cathinone, the active principle in khat, may be limited by the bulk quantities of the khat leaves chewed.8 Ethanol at 20% was chosen because earlier studies have indicated that persons who chew khat and drink alcohol concurrently typically drink spirits and wines known to have a higher alcohol content than beers.6 Animals were group-housed in polypropylene cages (four animals per cage) in a temperature-controlled (23°C±1°C) research facility with a 12:12 hour light:dark cycle (lights on at 6 am). Rats were weighed twice a week to ensure appropriate dosing based on body weight changes, and were fed standard laboratory chow and given water ad libitum. All treatments were given between 8 and 10 am and repeated between 3 and 5 pm daily. Because khat chewing typically occurs in the daytime1,6 and the maximal plasma concentration of cathinone, a major active component of khat, appears to be reached with a delay of approximately 2 hours after oral administration,8 the dosing regimen was designed to mimic typical consumption in people who use both drugs concurrently. Before starting the study, we obtained ethical approval from the Faculty of Medicine Research and Ethics Committee (approval number: DMS 20/4) and the Institutional Ethics Review Board of Mbarara University (approval number 01/05-12); procedures were performed in accordance with the Guide for the Care and Use of Laboratory Animals (USA).
Phytochemical screening
Khat extracts were prepared according to the method described for the phytochemical screening of medicinal plants.12,13 Briefly, khat extracts were obtained by macerating a known weight of the fresh plant parts (tender leaves and twigs) with redistilled methylated spirit in an electric blender. The extract was then suction-filtered and the process repeated until all soluble components had been extracted, judged by loss of color of the filtrate. The total extract was then evaporated to dryness at 45°C and further dried to constant weight at the same temperature in a hot air oven. Phytochemical screening was done according to standard methods.12
Khat treatment
Known weights of freshly harvested khat leaves and twigs were macerated with distilled water using an electric blender. The juice obtained was then filtered repeatedly until all soluble components had been extracted. This extract contained all undegraded active components. Previously, we tested the fresh aqueous, the dried aqueous, and the methanolic extracts of khat.10 While the fresh aqueous extract tested positive for the presence of all the phytochemicals tested except for alkaloids, the dried aqueous extract tested negative for alkaloids, lactones, coumarins, steroids, and terpenoids; only the dried methanol extract tested positive for all the phytochemicals tested.10 This implied that the fresh extract is closest to the form chewed by habitual users of khat. The results from the previous study also suggested that the chewed form of khat, unlike the laboratory extracts obtained using polar organic solvents such as methanol, yields small quantities of the alkaloidal cathinone, perhaps explaining why khat chewers have to chew big quantities over several hours.8 So, for the khat treatment given to rats, we used an aqueous extract of fresh leaves to mimic human consumption of khat. Animals that received khat were given different concentrations of khat by gavage twice daily simultaneously with oral ethanol (below) and control. Khat treatment was given for 28 days.
Ethanol treatment
Animals that received ethanol were given 20% ethanol by gavage at a dose of 4 g/kg body weight. Ethanol treatment was given twice daily, ending at the beginning of the active period (starts at 6 pm), for a total of 28 days. This period of ethanol administration has been shown in earlier studies to establish dependence.
Control animals
Control animals received normal saline (4 mL/kg) only, also by gavage, for 28 days.
Untreated animals
This group provided an intrasystem negative control to ensure that measurements were valid, by providing a point of contrast with the normal saline-treated (control) group. This ensured that the experimental system, as outlined for the other treatments, was not in itself pertubing the outcome.
Brain sectioning and processing
Rat brains for chronic neurotoxicity screening were obtained on day 29 (1 day after ending treatments). Ten animals from each of the six groups were injected intraperitonally with an overdose of phenobarbital. When deeply anesthetized, each animal was perfused transcardially with 0.9% normal saline for 1 minute followed by 10% buffered neutral formalin for 5 minutes. Brains were removed after perfusion and postfixed for 48 hours in fresh fixative. After postfixation, the brains were dehydrated and embedded in paraffin. Coronal sections from one hemisphere were cut serially at 6 μm. After every 20th section, four consecutive sections were mounted onto gelatin-coated slides and stained with routine hematoxylin and eosin from a standard protocol. We sectioned the brain structures in a representative manner so that the cortical and hippocampal structures would have equal probabilities of being present in the sections. Furthermore, we used systematic random sampling to obtain our brain sections for analysis, choosing the sections after every 20 sections, within the area of interest (cortical or hippocampal). Photomicrographs were taken using a Axiostar® microscope (Carl Zeiss Meditec AG, Jena, Germany) loaded with a Canon PowerShot® A640 image capture digital camera (Canon U.S.A., Inc., Melville, NY, USA) and AxioVision® software (release 4.6, Carl Zeiss) at a magnification of ×100.
Protocol for ImageJ® analysis of neuron number and size
Neuron counting was done using the image analysis program, ImageJ, version 1.48 (National Institutes of Health, Baltimore, MD, USA., http://imagej.nih.gov/ij). Using the rat brain atlas,14 coronal sections from interaural 6.00 mm to bregma –3.00 were selected for analysis. ImageJ stereological analysis does not take into account the volume of the structure in which the numbers are estimated. This procedure of neuron number estimation, therefore, eliminated density measurements, which are known to have limited value in experimental studies15; in this case, the density measure would be neuron number per volume of tissue. The number and size of granular and pyramidal neurons was quantified in the motor (pyramidal neurons) cortex and in four areas of the hippocampus: the dentate gyrus, CA1, CA2, and CA3 areas (all pyramidal neurons, except granular neurons for the dentate gyrus). For the CA regions, pyramidal neuron number and size was considered in the stratum pyramidale, a layer that also contains the cell bodies of many interneurons. The measurement scale was set by drawing a line (use straight line selection tool) over the scale bar and selecting Analyze → Set scale. In a new window, 200 was entered into the Known distance box and the Unit of measurement changed to µm. The menu Global was checked, and the measurement scale confirmed as correct. Each image was converted to grayscale by choosing the menu Image → Type → 8-bit. The image was then Thresholded using Process → Binary → Make binary. The scale bar was surrounded with the rectangular selection tool and the contents cleared by choosing Edit → Clear. Estimation of the size of the particles to be analyzed was done by measuring several of them using the Select tool on the Menu bar. A rectangular or other selection tool was then chosen to pick the area to analyze. The menu Analyze → analyze particles was then selected. In the new window, the range of particle sizes was then entered, for example, 10–20; the range of area in microns was determined from the initial size of particles to infinity. A minimum or maximum size that was perceived to be due to artifact(s) or because of image conversion to binary, and that was deviating from the estimated neuron sizes, was corrected in the final range of sizes. Circularity of 0.5–1.0 was chosen for round, regularly shaped, or ovoid particles and 0.0–0.5 was chosen for shapes that approached that of the pyramidal neuron; lastly, the menu items Show outlines, Display results, Include holes, and Summarize were selected. After returning the response “OK”, the data window listed the area in µm2 for each particle. This data was copied onto a new Word® file or to a new Excel® spreadsheet for export to the GraphPad® Prism analysis program (GraphPad Software, San Diego California, USA; www.graphpad.com). Neuron counts were done at a magnification of ×100, were made independently by two blinded observers, and the geometric mean taken of both counts. When the neuron counts differed by more than a factor of two, a third blinded observer was asked to check the neuron count. We ensured face validity by repeated checking of visual eyeball counts compared with the ImageJ counts for the parameters of interest. Parameters were adjusted to ensure that only the objects of interest were actually counted or sized.
Statistical analysis
Neuron counts and sizes for the respective treatment groups and brain areas were summarized as mean ± standard error of the mean. For parametric data, variances in the neuron counts were estimated using one-way analysis of variance with treatment as the dependent variable. Significant main tests (P<0.05) were further analyzed using Tukey’s multiple comparison test as the post hoc test. Two-way, repeated measures analysis of variance was used to analyze the effect of treatment on animal body weight at 3-day intervals during the 28-day period. Many of the distributions were not normal, so nonparametric tests were run. For nonparametric data, differences in the means of the treatment groups were estimated using Kruskal–Wallis test, and Dunn’s multiple comparison test was used as the post hoc test for comparisons with a significant result (P<0.05).
Results
Phytochemical screening
Phytochemical screening of the aqueous extract showed the presence of tannins, lactones, coumarins, steroidal or triterpenoidal saponins, steroids and terpenoids, oils and fats, reducing sugars, and flavonoids. Alkaloids were not detected in the aqueous extract.
Effect of treatment on body weights
Because of the chronic nature of the study, animal weights were monitored as a proxy to indicate health. All the experimental animals gained body weight during the chronic administration of treatments (Figure 1). Groups administered both 2 and 4 g/kg khat doses, however, had lower body weights than the untreated controls (P<0.05): beginning around the third day, and continuing to the end of the 28-day treatment, the 2 g/kg khat treatment group weighed less than the untreated controls (P<0.05). The reduction in body weight in the 4 g/kg khat treatment group, compared to the untreated group, started around day 10 and persisted through the end of the 28-day treatment (P<0.05). Similarly, the 20% ethanol treatment group had significant reduction in body weight compared to the untreated group (P<0.05), which began approximately on day 3 and lasted till the end of the 28-day treatment. Also, the combined 20% ethanol and khat treatment group had significant reduction in body weight compared to the untreated group (P<0.05), an effect that started approximately on day 7 and persisted to the end of the treatment. Other treatment groups had comparable weights to the other groups, with mild fluctuations that stabilized by the end of the treatments (Figure 1).
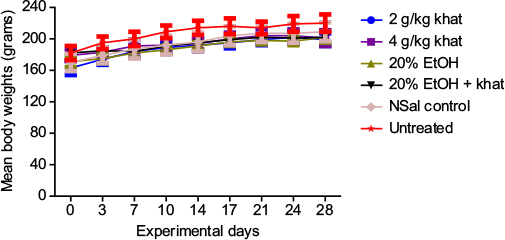 | Figure 1 Body weights of the experimental animals. Notes: Weights are shown as mean ± standard error of the mean. There was a general increase in body weights throughout the chronic treatments. Animals given both doses of khat, 20% EtOH only, and combined 20% EtOH and khat had significant reduction in their body weights at different times during the 28-day treatment period. n=10 rats per treatment group. Abbreviations: EtOH, ethanol; NSal, normal saline. |
Histology results
Coronal sections through the hippocampal region and the cortex showed well-rounded granular neurons and pyramidal neurons (Figure 2). At higher magnification, a clear picture of the pyramidal neurons with the classical triangulated shape could be seen in this photomicrograph.
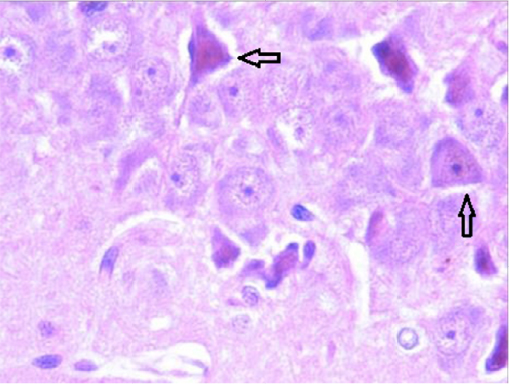 | Figure 2 Photomicrograph showing pyramidal neurons (arrows) in the CA2 hippocampal region. Note: Magnification × 400. |
Granular and pyramidal projection neuron counts and sizes
Analysis of granular neuron counts in the dentate gyrus of the hippocampus showed no statistical difference in counts between the treatment groups (Figure 3). Comparison of the granular neuron sizes, however, showed remarkable differences: in the dentate gyrus, there was a significant difference in granular neuron sizes among the treatment groups (Kruskal–Wallis H = 86, critical χ2, 5 degrees of freedom [df], for α of 0.05 = 11.07; P<0.0001). Dunn’s post hoc multiple comparisons showed that granular neurons were smaller in the 2 g/kg khat group than in the 4 g/kg khat group (P<0.05), the combined khat–EtOH group (P<0.05), the normal saline group (NSal) control group (P<0.05), and the untreated group (P<0.05). Granular neurons were larger in the 4 g/kg khat group than in the 4 g/kg EtOH group (P<0.05); lastly, in the dentate gyrus, granular neurons were smaller in the 4 g/kg ethanol (EtOH) group than in the khat–EtOH group (P<0.05), the NSal control group (P<0.05), and the untreated group (P<0.05).
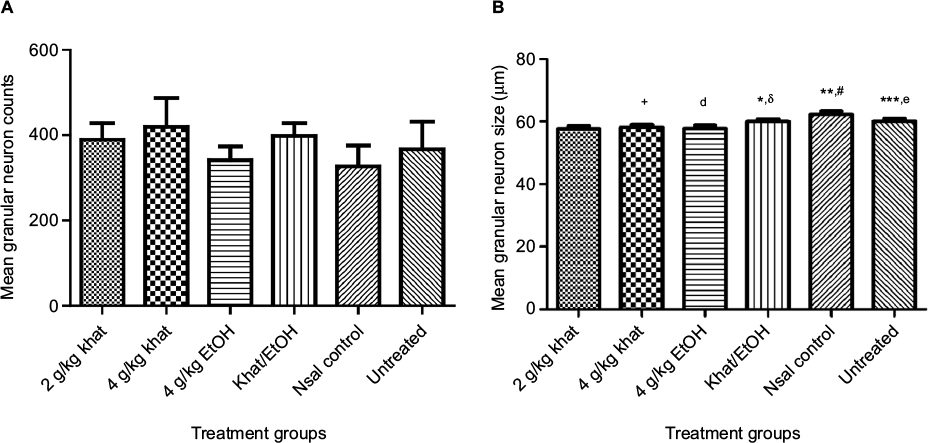 | Figure 3 Granular neuron counts and sizes. Notes: (A) Granular neuron counts in the dentate gyrus. Kruskal–Wallis testing showed no significant difference in the granular neuron counts in the dentate gyrus among the treatment groups. (B) Granular neuron size in the dentate gyrus. There was a significant difference in the granular neuron sizes among the treatment groups: +P<0.05, comparing 2 g/kg khat and 4 g/kg khat groups; *P<0.05, comparing 2 g/kg khat and khat–EtOH groups; **P<0.05, comparing 2 g/kg khat and NSal controls; ***P<0.05, comparing 2 g/kg khat and untreated controls; dP<0.05, comparing 4 g/kg khat and 4 g/kg EtOH groups; δP<0.05, comparing 4 g/kg EtOH and khat–EtOH groups; #P<0.05, comparing 4 g/kg EtOH and NSal controls; eP<0.05, comparing 4 g/kg EtOH and untreated controls. n=10 animals per treatment group. Abbreviations: EtOH, ethanol; NSal, normal saline. |
We then made similar analyses of pyramidal neuron counts and sizes in the CA1–CA3 pyramidal regions and in the motor cortex. For the pyramidal neurons in these brain regions, there was also no significant difference in the counts among the treatment groups (Figure 4).
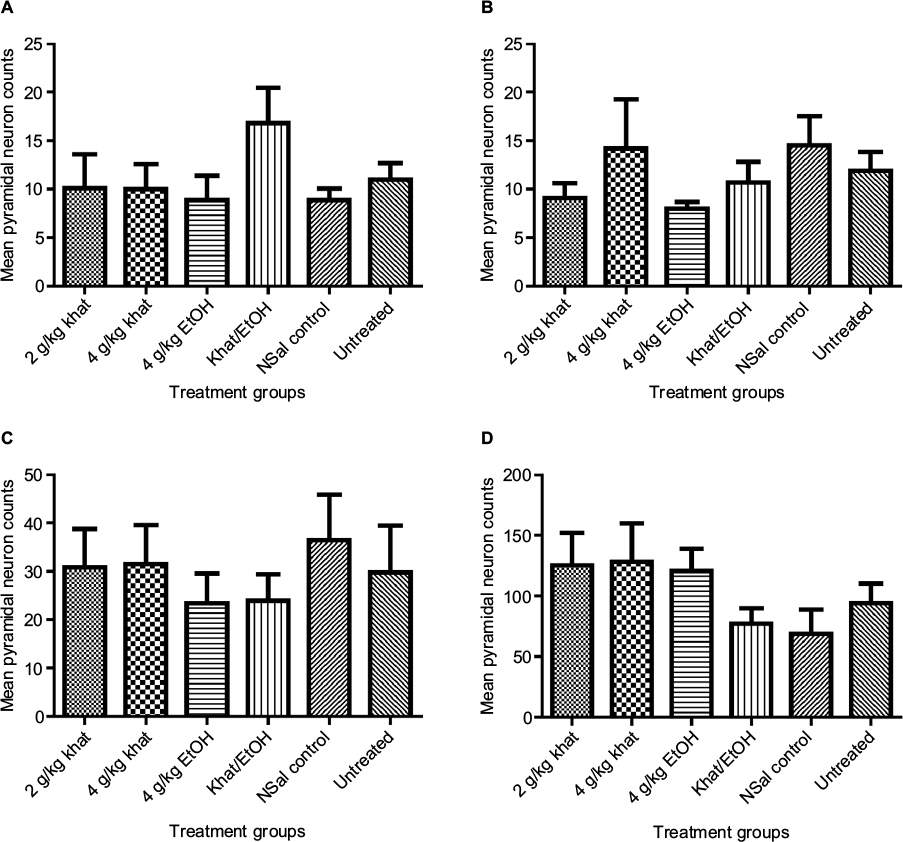 | Figure 4 Pyramidal neuron counts. Notes: Similar to the results for the granular neuron counts, Kruskal–Wallis test showed no significant difference in the pyramidal neuron counts among the treatment groups. (A) Pyramidal neuron counts in area CA1. (B) Pyramidal neuron counts in area CA2. (C) Pyramidal neuron counts in area CA3. (D) Pyramidal neuron counts in the motor cortex. Abbreviations: EtOH, ethanol; NSal, normal saline. |
There was, however, a remarkable difference in the pyramidal neuron sizes among the treatment groups in these brain regions (Figure 5). In the CA1 hippocampal region, there was a significant difference in the pyramidal neuron sizes among the treatments (Kruskal–Wallis H = 30, critical X2, 5 df, for α of 0.05 = 11.07; P<0.0001). Dunn’s post hoc multiple comparisons showed that pyramidal neurons in both the 2 g/kg khat and the 4 g/kg EtOH groups were smaller, compared to the combined khat–EtOH group (P<0.05).
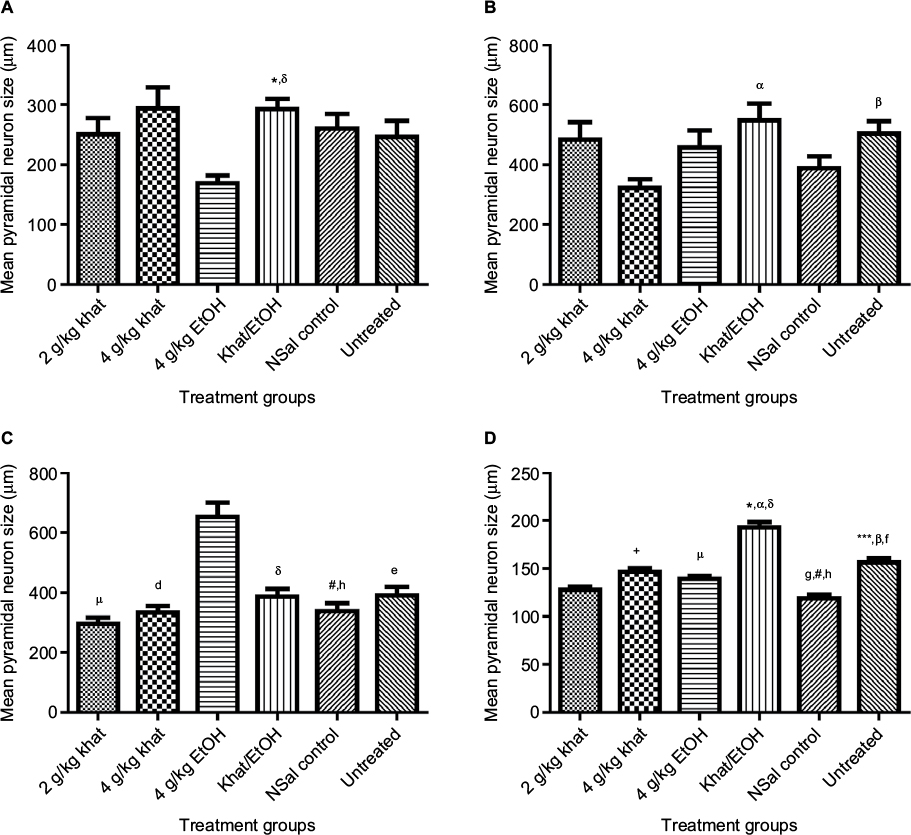 | Figure 5 Pyramidal neuron sizes. Notes: (A) Pyramidal neuron size in area CA1. (B) Pyramidal neuron size in area CA2. (C) Pyramidal neuron size in area CA3. (D) Pyramidal neuron size in the motor cortex. There was a significant difference in the neuron sizes among the treatment groups in (A) CA1, (B) CA2, (C) CA3, and (D) motor cortex: +P<0.05, comparing 2 g/kg khat and 4 g/kg khat groups; µP<0.05, comparing 2 g/kg khat and 4 g/kg EtOH groups; *P<0.05, comparing 2 g/kg khat and khat–EtOH groups; ***P<0.05, comparing 2 g/kg khat and untreated controls; dP<0.05, comparing 4 g/kg khat and 4 g/kg EtOH groups; αP<0.05, comparing 4 g/kg khat and khat–EtOH groups; gP<0.05, comparing 4 g/kg khat and NSal controls; βP<0.05, comparing 4 g/kg khat and untreated controls; δP<0.05, comparing 4 g/kg EtOH and khat–EtOH groups; #P<0.05, comparing 4 g/kg EtOH and NSal controls; eP<0.05, comparing 4 g/kg EtOH and untreated controls; fP<0.05, comparing NSal control and untreated controls; hP<0.05, comparing khat–EtOH and NSal controls. n=10 animals per treatment group. Abbreviations: EtOH, ethanol; NSal, normal saline. |
The next hippocampal region, the CA2, showed a significant difference in the pyramidal neuron sizes among the treatments (Kruskal–Wallis H = 22, critical X2, 5 df, for α of 0.05 = 11.07; P<0.0006). Dunn’s post hoc multiple comparisons showed that pyramidal neurons were significantly smaller in the 4 g/kg khat group than in the combined khat–EtOH group (P<0.05) and smaller than in the untreated group (P<0.05).
Furthermore, in the CA3 hippocampal region, there was a significant difference in the pyramidal neuron size among the treatments (Kruskal–Wallis H = 50, critical X2, 5 df, for α of 0.05 = 11.07; P<0.0001). Dunn’s post hoc multiple comparisons showed that pyramidal neurons were smaller in the 2 g/kg khat group, the 4 g/kg khat group, the combined khat–EtOH group, the NSal control, and the untreated group compared to the 4 g/kg EtOH group (P<0.05). Pyramidal neurons were also significantly smaller in the NSal control than in the combined khat–EtOH group (P<0.05).
Lastly, in the motor cortex, there was a significant difference in the pyramidal neuron sizes among the treatment groups (Kruskal–Wallis H = 180, critical X2, 5 df, for α of 0.05 = 11.07; P<0.0001). Dunn’s post hoc multiple comparisons showed that pyramidal neurons were smaller in the 2 g/kg khat group than those in the 4 g/kg khat group (P<0.05), the 4 g/kg EtOH group (P<0.05), the combined khat–EtOH group (P<0.05), and the untreated group (P<0.05). Pyramidal neurons were smaller in the 4 g/kg khat group than in the combined khat–EtOH group (P<0.05) and the untreated group (P<0.05), but larger than in the NSal control group (P<0.05). Pyramidal neurons were smaller in the 4 g/kg EtOH group than in the combined khat–EtOH group (P<0.05), but larger than in the NSal control group (P<0.05). Pyramidal neurons were also larger in the combined khat–EtOH group compared to the NSal control group (P<0.05); and, finally, pyramidal neurons were smaller in the NSal control group than those in the untreated group (P<0.05), but this difference which occurred for the pyramidal neurons of the motor cortex only appears artifactual.
Discussion
The present study was designed to determine the effect of chronic exposure to combined khat and ethanol on the number and size of granular and pyramidal neurons in two brain regions known to be intimately involved in the generation of seizure behavior. Our previous study suggested that seizure susceptibility is increased in rats chronically administered combined khat and ethanol.11 Our goal, thus, was to delineate the separate and interactive effect of khat and ethanol on the granular and pyramidal neuron number and size in order to explore the possible effects of these drugs on these important projection neurons.
Indeed, the weight-lowering effect of chronic khat, and its use as an anorexiant and a weight-loss drug, has been widely reported.16 The effects of khat and ethanol on weight gain observed in this chronic rodent model are consistent with those seen in humans and also in animals as reported in several studies.17,18 Fresh aqueous khat extract showed the presence of major phytochemicals that are routinely found in the chewed khat leaves.10 In previous phytochemical analyses of three types of khat extract, fresh aqueous, dried aqueous, and methanolic extracts, higher amounts of alkaloids were found in the methanolic extract, but they were negative in both the fresh aqueous and dried aqueous extracts.10 This previous finding suggested that the chewed fresh form of khat, unlike the laboratory extracts obtained from using polar organic solvents such as methanol, yields small quantities of the alkaloidal cathinone, and may explain why khat chewers have to chew big quantities over several hours.8 In spite of the weight gain shown by all the experimental animals chronically administered fresh aqueous khat extract at both low dose and high dose, as well as by the ethanol-only group and by the combined khat and ethanol group, there was a lower mean body weight seen in all the groups compared to the untreated group. It is likely that this forced feeding paradigm with the stress of twice-daily intubations could have contributed to the reduction in body weights of the treatment groups compared to the untreated group. Our previous study showed a trend toward a reduction in body weight caused by daily administration of high dose of khat,11 at the end of the chronic study period. It is also likely that for the ethanol-only and combined ethanol–khat groups, ethanol substituted for caloric intake and the twice-daily regimen may have contributed to reduced feeding behavior because of persistent intoxication.
Considerable evidence has shown the ability of the brain to undergo neuronal plasticity in response to several insults including exposure to ethanol and other drugs such as marijuana.19–22 In particular, brain plasticity in response to ethanol is well characterized; these plastic changes involve the postsynaptic specialization, receptors, signaling molecules, hormones, and other morphological features within neurons.19,23,24 Plastic changes in response to the effect of khat, a psychostimulant, are less well understood. Because of the increasing use of khat in several countries across Africa, as well as across Europe and America, especially among immigrant communities from Africa,25 our aim was to characterize the effect of khat and combined khat and ethanol on granular and pyramidal neuron number and size in the hippocampus and motor cortex, two brain regions that are very important in the expression of the actions of these drugs of abuse.
Previous studies have shown neuroplasticity during chronic ethanol exposure, involving reduced neuronal and glial densities in brain regions such as the hippocampus26 in adolescent mice. Coadministration of nicotine (a stimulant) and alcohol (a depressant), however, reduced neuronal degeneration and neuronal and glial densities, putatively reducing the adverse effects of either drug.26 In our study, chronic treatment with khat, ethanol, and combined khat and ethanol showed no effect on granular and pyramidal neuron counts in the hippocampal area and in the motor cortex, a finding consistent with several earlier studies involving the effect of chronic ethanol exposure on the cerebellum.27 Our findings of increased granular and pyramidal neuron sizes in rats chronically exposed to khat and ethanol suggest that these brain regions experienced neuroplastic changes because of the constant exposure to these substances. While it is unclear what these changes in neuronal size represent, previous data suggest that chronic marijuana use, for example, produces gross changes in brain tracts and gyri.20
Our previous study showed evidence that khat alone and combined khat and ethanol increased seizure susceptibility following chronic administration; furthermore, combined khat and ethanol produced seizure severity that was close to the maximum.11 In the present study, we wanted to begin to explore the mechanism by which chronic administration of khat and ethanol produces increased seizure susceptibility. The concurrent use of alcohol with khat is now well described among individuals who drink alcohol as a tranquilizer following the stimulating effect of khat.5,6 Several studies in humans have also described the neurological and neuropsychiatric effects of chronic khat chewing, including cognitive and behavioral effects such as insomnia, headaches, anxiety, irritability, aggression, schizophreniform psychotic illness, mania, depression, hallucinations, impaired motor coordination, and others.2,28
At least one early study demonstrated that chronic ethanol exposure in rats resulted in a noticeable cell loss in the granular layer of the dentate gyrus and the CA1 and CA3 regions of the hippocampus.29 Marked decrease in neural population is likely in ethanol-treated animals because chronic ethanol exposure during adult life leads to neuronal cell degeneration from the neurotoxicity of ethanol. Another study observed degenerating cells in the CA1 and CA3 areas of the hippocampus and in the ventral and dorsal blades of the dentate gyrus following chronic exposure.23 We report here a significant decrease in neuronal size of pyramidal neurons in the CA3 hippocampal area across the groups following chronic drug exposure, as compared with other regions such as CA1, CA2, and motor cortex. The hippocampus is considered highly vulnerable mainly to the psychological disorders associated with hippocampal neuronal loss, such as major depression and chronic stress,30 schizophrenia,31 and alcoholism and drug dependence.32 Cognitive impairments in khat users demonstrate impairments in the inhibition of overt manual responses that are assumed to rely on proper dopaminergic functioning.33 The CA3 hippocampal subfield is important in modulating the function of the entire hippocampus.34,35 An association between changes in neuronal size and seizure activity, however, awaits further corroboration.
Regional selectivity of neuronal injury could be relevant for the understanding of various mechanisms involved in neuroadaptations following chronic drug exposure or dependence. However, loss of neurons is not the only mechanism by which neuronal function is impaired. Other factors such as a marked reduction in the dendritic branching or the loss of synapses following drug exposure, despite the surviving cell bodies, would suggest possible neuronal injury.29 Neural injury and death can be induced by excess activity of certain neurotransmitters, including glutamate, through excitotoxicity, an effect that also contributes to alcohol-related damage to adult brain.36 In the present work, we observed a significant increase or decrease in neuron size in both pyramidal and granular neurons in the cortical and hippocampal areas of the brain following combined chronic khat and ethanol administration, compared to the experimental groups and the control animals. Interestingly, production of hippocampal granular neurons continues throughout adulthood.37 Neurons in the rat hippocampal and dentate gyrus are generated prenatally from the ventricular zone; in the neocortex, ethanol depresses the proliferation of cells in the ventricular zone and then enhances their proliferation in the secondary proliferative zone on chronic exposure.38 These differential changes are consistent with our findings in the present study; neuron size was increased or decreased in the different brain regions in response to the respective treatments. Cathinone, an alkaloid in khat which is similar to amphetamine, produces an amphetamine-like effect, mediated through the release of neurotransmitters at catecholaminergic synapses.9 In one study, administration of stimulant drugs such as d-amphetamine or nicotine to adult rats produced changes in the patterns of synaptic connectivity in the frontal cortex and hippocampus, which revealed increases in the dendritic length or spine density that were found to persist even after drug cessation.39,40 Thus, molecular neural–biochemical interactions of khat, a central nervous system stimulant, and ethanol, a central nervous system depressant, during chronic exposure would induce attenuated neuronal injury and possibly modulate an increase or decrease in neuronal populations in the various cortical and hippocampal regions of the brain.
Our study demonstrated that chronic exposure to ethanol and high dose of khat separately in young adult male rats markedly affects granular and pyramidal neurons, but in a different way. Concomitant chronic khat and ethanol exposure has a distinctive effect on the cortical and hippocampal projection neurons, although the significance of these changes is still unclear. Further studies, including behavioral studies, are warranted to examine the neural mechanistic and biochemical adaptations in the cortex and hippocampus that are involved during chronic coadministration of khat and ethanol.
Acknowledgments
The authors gratefully acknowledge the excellent technical assistance of Deneth Muhereza and late Constantine Anywar. This work was supported by the MESAU-MEPI Programmatic Award through Award Number 1R24TW008886 from the Fogarty International Center. The content is solely the responsibility of the authors and does not necessarily represent the official views of the Fogarty International Center or the National Institutes of Health.
Disclosure
The authors report no conflicts of interest in this work.
References
Odenwald M. Chronic khat use and psychotic disorders: a review of the literature and future prospects. Sucht. 2007;53:9–22. | ||
Warfa N, Klein A, Bhui K, Leavey G, Craig T, Alfred Stansfeld S. Khat use and mental illness: a critical review. Soc Sci Med. 2007;65(2):309–318. | ||
Beckerleg S. Khat chewing as a new Ugandan leisure activity. J East Afr Stud. 2009;3(927669369):42–54. | ||
Beckerleg S. ‘Idle and disorderly’ khat users in Western Uganda. Drug Educ Prev Polic. 2010;17(4):303–314. | ||
Kebede D, Alem A, Mitike G, et al. Khat and alcohol use and risky sex behaviour among in-school and out-of-school youth in Ethiopia. BMC Public Health. 2005;5:109. | ||
Gelaw Y, Haile-Amlak, A. Khat chewing and its socio-demographic correlates among the staff of Jimma University. Ethiop J Health Dev. 2004;18(3):179–184. | ||
Banjaw MY, Schmidt WJ. Catha edulis extract and its active principle cathinone induce ipsilateral rotation in unilaterally lesioned rats. Behav Pharmacol. 2006;17:617–620. | ||
Widler P, Mathys K, Brenneisen R, Kalix P, Fisch HU. Pharmacodynamics and pharmacokinetics of khat: a controlled study. Clin Pharmacol Ther. 1994;55(4):556–562. | ||
Kalix, P. Khat: A plant with amphetamine effects. J Subst Abuse Treat. 1988;5:163–169. | ||
Alele PE, Ajayi AM, Imanirampa L. Chronic khat (Catha edulis) and alcohol marginally alter complete blood counts, clinical chemistry, and testosterone in male rats. J Exp Pharmacol. 2013:2013(5):33–44. | ||
Alele PE, Rujumba JB. Khat (Catha edulis) and ethanol co-dependence modulate seizure expression in a pentylenetetrazol seizure model. J Ethnopharmacol. 2011;137(3):1431–1436. | ||
Evans WC. Pharmacognosy. 16th ed. Philadelphia, PA: Saunders Elsevier; 2009. | ||
Odebiyi OO, Sofowora EA. Phytochemical screening of Nigerian medicinal plants II. Lloydia. 1991;41(3):234–246. | ||
Paxinos G, Watson C. The Rat Brain in Stereotaxic Coordinates. 6th Ed. London: Elsevier Ltd; 2007. | ||
West MJ. Introduction to stereology. Cold Spring Harbor Protoc. 2012:842–851. | ||
Murray CD, Le Roux CW, Emmanuel AV, Halket JM, Przyborowska AM, Kamm MA, Murray-Lyon IM. The effect of Khat (Catha edulis) as an appetite suppressant is independent of ghrelin and PYY secretion. Appetite. 2008;51(3):747–750. | ||
Ageely HM. Health and socio-economic hazards associated with khat consumption. J Family Community Med. 2008;15(1):3–11. | ||
Hassan NAGM, Gunaid AA, Murray-Lyon IM. Khat (Catha edulis): health aspects of khat chewing. East Mediterr Health J. 2007;13(3):706–718. | ||
Feduccia AA, Chatterjee S, Bartlett SE. Neuronal nicotinic acetylcholine receptors : neuroplastic changes underlying alcohol and nicotine addictions. Front Mol Neurosci. 2012;5: 83. | ||
Filbey FM, Aslan S, Calhoun VD, Spencea JS, Damarajuc E, Caprihanc A, Segall J. Long-term effects of marijuana use on the brain. P Nat Acad Sci USA. 2014:1–6. | ||
Peterson VL, McCool BA, Hamilton DA. Effects of ethanol exposure and withdrawal on dendritic morphology and spine density in the nucleus accumbens core and shell. Brain Res. 2015;1594:125–135. | ||
Simchon-Tenenbaum Y, Weizman A, Rehavi M. Alterations in brain neurotrophic and glial factors following early age chronic methylphenidate and cocaine administration. Behav Brain Res. 2015;282:125–132. | ||
Milotová M, Riljak V, Jandová K, Bortelová J, Maresová D, Pokorný J, Langmeier M. Changes of hippocampal neurons after perinatal exposure to ethanol. Physiol Res. 2008;57(2):275–282. | ||
Anderson ML, Nokia MS, Govindaraju KP, Shors TJ. Moderate drinking? Alcohol consumption significantly decreases neurogenesis in the adult rat hippocampus. Neuroscience. 2012;224:202–209. | ||
Griffiths P, Lopez D, Sedefov R, Gallegos A, Hughes B, Noor A, Royuela L. Khat use and monitoring drug use in Europe : the current situation and issues for the future. J Ethnopharmacol. 2010;132(3):578–583. | ||
Oliveira-da-Silva A, Manhães AC, Cristina-Rodrigues F, Filgueiras CC, Abreu-Villaça Y. Hippocampal increased cell death and decreased cell density elicited by nicotine and/or ethanol during adolescence are reversed during drug withdrawal. Neuroscience. 2010;167(1):163–173. | ||
Pentney RJ, Mullan BA, Felong AM, Dlugos CA. The total numbers of cerebellar granule neurons in young and aged Fischer 344 and Wistar-Kyoto rats do not change as a result of lengthy ethanol treatment. Cerebellum. 2002;1(1):78–89. | ||
Odenwald M, Hinkel H, Schauer E, Schauer M, Elbert T, Neuner F, Rockstroh B. Use of khat and posttraumatic stress disorder as risk factors for psychotic symptoms: a study of Somali combatants. Soc Sci Med. 2009;69(7):1040–1048. | ||
Lukoyanov NV, Brandão F, Cadete-Leite A, Madeira MD, Paula-Barbosa MM. Synaptic reorganization in the hippocampal formation of alcohol-fed rats may compensate for functional deficits related to neuronal loss. Alcohol. 2000;20(2):139–148. | ||
Printha K, HulathduwaSR, Samarasinghe K, Suh YH, De Silva KR. Apoptosis in subicular neurons: a comparison between suicide and Addison’s disease. Indian J Psychiatry. 2009;51(1):276–279. | ||
Gattaz WF, Valente KD, Raposo NR, Vincentiis S, Talib LL. Increased PLA(2) activity in the hippocampus of patients with temporal lobe epilepsy and psychosis. J Psychiatric Res. 2011;45(12):1617–1620. | ||
Baicy K, London ED. Corticolimbic dysregulation and chronic alcohol abuse. Addiction. 2007;102(Suppl 1):5–15. | ||
Colzato LS, van den Wildenberg WP, van der Does AJ, Hommel B. Genetic markers of striatal dopamine predict individual differences in dysfunctional, but not functional impulsivity. Neuroscience. 2010;170:782–788. | ||
Scharfman HE. The CA3 “backprojection” to the dentate gyrus. Prog Brain Res. 2007;163:627–637. | ||
Engel J. Epilepsy: A Comprehensive Textbook in 3rd Vol. Philadelphia: Lippincott, Williams & Wilkins; 2008. | ||
Bichel J, Bach A. Investigations on the toxicity of small chronic doses of tannic acid with special reference to possible carcinogenicity. Acta Pharmacol Toxicol(Copenh). 1968;26(1):41–45. | ||
Cameron HA, McKay RD. Restoring production of hippocampal neurons in old age. Nat Neurosci. 1999;2(10):894–897. | ||
Miller MW. Generation of neurons in the rat dentate gyrus and hippocampus: effects of prenatal and postnatal treatment with ethanol. Alcohol Clin Exp Res. 2006;19(6):1500–1509. | ||
Blaesing B, Nossoll M, Teuchert-Noodt G, Dawirs RR. Postnatal maturation of prefrontal pyramidal neurones is sensitive to a single early dose of methamphetamine in gerbils (Meriones unguiculatus). J Neural Transm. 2001;108(1):101–113. | ||
Kolb B, Gorny G, Soderpalm AH, Robinson TE. Environmental complexity has different effects on the structure of neurons in the prefrontal cortex versus the parietal cortex or nucleus accumbens. Synapse. 2003;48(1):149–153. |
 © 2016 The Author(s). This work is published and licensed by Dove Medical Press Limited. The
full terms of this license are available at https://www.dovepress.com/terms
and incorporate the Creative Commons Attribution
- Non Commercial (unported, 3.0) License.
By accessing the work you hereby accept the Terms. Non-commercial uses of the work are permitted
without any further permission from Dove Medical Press Limited, provided the work is properly
attributed. For permission for commercial use of this work, please see paragraphs 4.2 and 5 of our Terms.
© 2016 The Author(s). This work is published and licensed by Dove Medical Press Limited. The
full terms of this license are available at https://www.dovepress.com/terms
and incorporate the Creative Commons Attribution
- Non Commercial (unported, 3.0) License.
By accessing the work you hereby accept the Terms. Non-commercial uses of the work are permitted
without any further permission from Dove Medical Press Limited, provided the work is properly
attributed. For permission for commercial use of this work, please see paragraphs 4.2 and 5 of our Terms.