Back to Journals » Clinical Ophthalmology » Volume 11
Prevalence and factors associated with childhood visual impairment in Ethiopia
Authors Bezabih L, Abebe TW ![]() , Fite RO
, Fite RO ![]()
Received 17 February 2017
Accepted for publication 24 July 2017
Published 6 November 2017 Volume 2017:11 Pages 1941—1948
DOI https://doi.org/10.2147/OPTH.S135011
Checked for plagiarism Yes
Review by Single anonymous peer review
Peer reviewer comments 4
Editor who approved publication: Dr Scott Fraser
Lidiya Bezabih,1 Tilaye Workneh Abebe,1 Robera Olana Fite2
1Department of Public Health, College of Health Sciences, Adama General Hospital and Medical College, Adama, 2Department of Nursing, College of Medicine and Health Sciences, Wolaita Sodo University, Wolaita Sodo, Ethiopia
Background: Visual impairment is a significant loss of vision. It has an impact on the prosperity of different countries. It has been difficult to plan preventive measures against visual impairment due to the scarcity of data about the extent of the problem.
Objectives: The study was aimed at assessing the prevalence and identifying factors associated with visual impairment among school-age children in Ethiopia.
Materials and methods: A cross-sectional study design was used in four randomly selected schools found in Addis Ababa from May 15 to June 14, 2016. A total of 804 school-age students were selected using the simple random sampling method. Bivariable logistic regression and multivariable logistic regression were conducted. A p-value <0.05 was taken as a significant association.
Results: A total of 718 students participated in the study, obtaining a response rate of 89.3%. In all, 7.24% of school-age children were visually impaired, of whom 3.9% had low vision and 3.34% had severe visual impairment. Factors associated with visual impairment were being female (adjusted odds ratio [AOR], 2.28; 95% confidence interval [CI], 1.06–3.50), being in the age group of 10–13 years (AOR, 2.94; 95% CI, 1.36–6.22), being in the age group of 14–18 years (AOR, 4.06; 95% CI, 2.17–11.95), being a private school student (AOR, 2.61; 95% CI, 1.81–4.41), watching television for 2–4 hours/day (AOR, 3.56; 95% CI, 1.37–7.34), watching television at <1 m (AOR, 7.65; 95% CI, 2.59–34.61), watching television at 1–2 m (AOR, 6.89; 95% CI, 1.74–25.27), mobile exposure for 2–4 hours/day (AOR, 2.61; 95% CI, 1.35–4.58), mobile exposure for >4 hours/day (AOR, 3.05; 95% CI, 1.41–9.18), medical visit while experiencing symptoms (AOR, 11.32; 95% CI, 1.80–82.25) and no medical visit experience (AOR, 3.84; 95% CI, 0.46–31.76).
Conclusion: The majority of the visually impaired school-age children had low vision. Sex, age, school type, television exposure duration, the distance of television exposure, mobile exposure and medical visit were factors associated with visual impairment. Increasing community awareness about early detection of visual impairment and providing affordable eye health service may decrease the prevalence of visual impairment.
Keywords: Adama, visual impairment, children, amblyopia
Background
Visual impairment is a significant loss of vision. It has an impact on the development and prosperity of different countries. This is more common in developing countries where the majority of visual impairment and blindness occurs. If early diagnosis and treatment are used, visual impairment can be corrected easily.1,2
Visual impairment is caused by cataract, glaucoma, uncorrected refractive errors, age-related macular degeneration and corneal opacity. It is also associated with the quality of health service and the socioeconomic status of the people.3,4
The prevalence of visual impairment is high in developing countries compared with that in the developed ones. In Sub-Saharan African countries, including Ethiopia, low vision occurred on average in 70 million people.5 According to estimates from the World Health Organization (WHO) Prevention of Blindness and Deafness Program, there are an estimated 285 million visually impaired populations.3 Most cases of visual impairment and blindness are preventable. In developing countries, this number could be as high as 90%. Most of them are older than 50 years.6,7
Visual impairment may have a drastic impact on school performance of school-age children. It has been estimated that 75%–90% of all learning in the classroom comes to the students either wholly or partially via the visual pathway.8 This has a negative effect on learning and social interaction, thus affecting the natural development of academic and social abilities.8,9 Especially, in developing countries, they cannot attend the normal education institutions due to scarcity of resources.10
In developed countries, it has been tried to treat visual impairment by the application of feasible and timely medical interventions.11 Furthermore, in the past 20 years, interventions were done to tackle visual impairment-causing diseases. However, the burden of visual impairment is rising over time. For instance, 12 million school-age children are affected by the refractive error.2,5
Globally, ~50% of the causes of blindness in children are avoidable causes, mainly cataract and vitamin A deficiency. The future life of visually impaired children is affected by the problem. Therefore, there is an urgency to treat the children because it cannot be corrected in an adulthood stage of life. The main challenge of the treatment is the need of special training and expertise in selecting the most appropriate treatment approaches.11–13
Worldwide, there are newly emerging causes of visual impairment associated with chronic diseases and advancement in age.9,14 Identifying risk factors and estimating the prevalence of visual impairment are important for the establishment of local, national, continental and worldwide prevention strategies and programs.14 Even though medical intervention advancements have resulted in significant change, action needs to be undertaken in preventing the problem because optical problems cause permanent blindness and child mortality.15
There is a link between the prevalence of visual impairment in one country and the expenditure for health care. The individual’s ability to obtain the medical care is also affected by the social deprivation. Prevention of visual impairment before its occurrence leads to saving in health care expenditures.16,17 According to the National Eye Institute, half of all cases of blindness might be preventable, with timely and adequate treatment.18 The global initiative has created a valuable and effective collaboration of different organizations aimed at the elimination of visual impairments.12 Yet, health-related services in treating visual problems are at low level.19
Visual impairment includes both low vision and blindness. Globally, >18 million people who are visually impaired are younger than 15 years. In all, 26 million people living in Africa are visually impaired.6,20
Visual impairment in children is a severe public health problem. The high prevalence of visual impairment affects the well-being of the individuals, their families and the social welfare.12 It has human and socioeconomic consequences. This is due to the loss of productivity, payment for treatment and visual aids. Low socioeconomic status also perpetuates ill health, including eye health.6,9,14,21
The causes of childhood blindness in Ethiopia were not well established, and there was no separate childhood blindness survey did at a community level in the country to identify the real causes. So, it has been difficult to plan and implement preventive measures against childhood blindness in the country as more realistic and evidence-based data regarding the magnitude and extent of the problem have been lacking. Therefore, the study was conducted to fill this gap. This study identified the prevalence of visual impairment and factors associated among school-age children in Addis Ababa’s elementary and high schools. Hence, having such preliminary studies in the field will be used to pinpoint loopholes and may facilitate health care planning accordingly.
Materials and methods
Study area, period and design
Addis Ababa is the capital and largest city of Ethiopia. It is located in West Shewa, Oromiya. In the country, each academic year is on average 10 months. According to the new structure of the Ethiopian education system, primary education lasts for 8 years, including grades 1–8. Secondary education involves 9–10 and 11–12 grades.
As of 2015/2016, there are 993 registered primary and secondary education facilities in Addis Ababa. A total of 629 schools are publicly owned, of which 479 schools are primary, 110 schools are secondary and 40 schools provide both primary and secondary levels of education. Of 364 privately owned schools, 309 are elementary schools, 23 are secondary schools and 32 schools provide both primary and secondary levels of education. Of 558,644 school-age children who are enrolled in schools, 240,508 are boys and 318,136 are girls. This study was conducted from May 15 to June 14, 2016. A cross-sectional study design was used.
Population and eligibility criteria
Source population was all school-age children in Addis Ababa, and the study population was school-age children 6–18 years old and those who learn in selected elementary (1–8 grades) and high schools (9–10 grades).
All elementary and secondary school students in Addis Ababa were included, those who had difficulty in communicating absentees during the eye campaign, and non-Ethiopian citizens were excluded.
Sample size determination
Single population proportion formula was employed using the following assumptions: 37% prevalence of visual impairment16 and Za/2 as the Z value at 95% confidence level (1.96) and 0.035 margin of error (d). The sample size for the study was calculated using single population proportion formula:
|
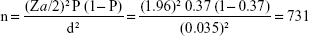
Adding 10% for the nonresponse rate, the final sample size was 804.
Sampling procedures
Four schools were selected by using the simple random method among schools in the study area. Then, a stratified sampling technique was used. The strata were the schools. The sample was selected using simple random sampling within each stratum. Their identification number was used as a sampling frame. Finally, students were selected using the simple random method to attain the final students from each school based on the sample size determined by using proportional allocation. Accordingly, 152 students from Assay School, 220 students from Medhanialem School, 128 students from Nazareth School and 218 students from St Joseph School were selected.
Study variables
Dependent variable
The dependent variable was visual impairment.
Independent variable
The independent variables were age, sex, family income, school type, duration of exposure to television, distance to television, duration of mobile phone exposure, medical visit and clinical patterns.
Operational definition
The operational definition is as follows:
- Blindness: Snellen chart reading (<3/60) or refractive field loss of <10° relative to the point of fixation
- Sever visual impairment: Snellen chart reading (<6/60–3/60)
- Moderate visual impairment: Snellen chart reading (<6/12–6/60)
- Low vision: inability to perform everyday visual tasks, such as reading or recognizing faces, resulting from a visual impairment
- Visual impairment: Snellen chart reading (<6/12–6/60)
- Refractive error: an optical defect of the eye that prevents light from being brought to a sharp focus on the retina
- Astigmatism: an irregularity on the surface of cornea (optical lens defect)
- Amblyopia: failure of vision to develop properly often due to squinting (lazy eye)
- Hyperopia: refractive error, also known as far sightedness, where visual acuity is good at far and poor at near
- Myopia: refractive error, also known as nearsightedness, where visual acuity is good at near and poor at distance.
Data collection procedures and instruments
Data collection procedures and materials
The structured survey questionnaire was adapted after the review of different literature.4,15,22 It was filled and completed by the students’ parents or legal guardians regarding their respective consents and sociodemographic information. Before taking the eye medical screening, the questionnaires were collected, and parental consent was obtained as well as assent from the participants. The data were transferred to the treatment card. In each school, the principals prepared two separate rooms to conduct the medical test. The first room was used to screen and examine refractive errors by an optometrist and ophthalmic nurse through the autorefractor test, Snellen chart reading and retinoscopy checkup. For examinees, who have been wearing eyeglasses, further investigation has been carried out by lensometer. Visual acuity was measured for each eye by one of the ophthalmic nurses using the Snellen’s chart E-type. During the initial visual acuity testing, all subjects were asked if they could read up to 6/12. Only children with uncorrected refractive errors and presenting visual acuity <6/12 were rechecked and allowed to go for cycloplegic refraction by the doctor and ophthalmic paramedics. Then, after collecting all the necessary data, the subjects were transferred to the second room where the ophthalmologist and the assigned ophthalmic nurse carried out further investigation of ocular diseases by utilizing slit lamp and ophthalmoscopy. To screen school-age children for cycloplegic refraction and ocular examinations, Snellen chart was used at 3–6 m. Afterward, retinoscopy was done at 2/3 m in the dark room.
Personnel
The data collection was carried out by a team comprising an ophthalmologist, a researcher, an optometrist, an ophthalmic nurse, a coordinator and a driver.
Ethics statement and data quality assurance
Ethical issues within the study were taken into consideration when carrying out the study. Ethical clearance was obtained from the Institutional Review Board of the Adama General Hospital and Medical College. A formal letter was submitted to Sun Optical Technologies and schools involved in the study. Parental consent was obtained and assent was taken from the participants. Medical treatment for minor ophthalmic problems and spectacles was provided free of charge at the time of examination. Children, requiring further diagnostic assessment or treatment, were referred to the hospital/clinic nearest to their home.
Training and supervision were provided to the data collectors and the supervisor. Codes were given to the questionnaires. The filled questionnaire was checked for completeness by the data collector and supervisor every day. Computer frequencies and data sorting were used to check for missed variables, outliers or other errors during data entry. Before the actual data collection was started, the prepared questionnaires were pretested at Dandii Boru primary and secondary schools and appropriate modifications were made based on the inputs.
Data processing and analysis
Data were first checked manually for completeness and then coded and entered using EpiData Manager (V2.0.0.25) and EpiData Entry Client (V2.0.7.22). The generated data were exported to SPSS version 20. The data were cleaned by visualizing, calculating frequencies and sorting. Frequencies and proportions were computed. The statistical association was done for categorical variables. To assess the association between dependent variables and independent variables, logistic regression was done. The independent variables with the p-values <0.25 on bivariate logistic regression were entered into multiple logistic regressions to identify different predictor variables considering p-values <0.05 at 95% confidence interval (CI).
Results
A total of 718 students participated in the study, obtaining a response rate of 89.3%.
Sociodemographic characteristics
Of the respondents, 389 (54.19%) were boys and 326 (45.4%) were in the age group of 6–9 years. In all, 177 (24.65%) children’s family had an income of 5,001–10,000 Ethiopian Birr (Table 1).
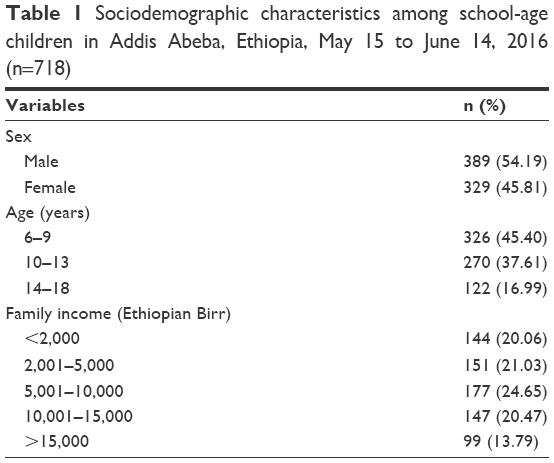 | Table 1 Sociodemographic characteristics among school-age children in Addis Abeba, Ethiopia, May 15 to June 14, 2016 (n=718) |
In Assay School and Medhanialem School, boys were 91 (12.67%) and 112 (15.59%), respectively. In Nazareth School, which is the school of female students only, females were 128 (17.83%). In St Joseph School, which is the school of male students only, males were 218 (30.36%; Table 2).
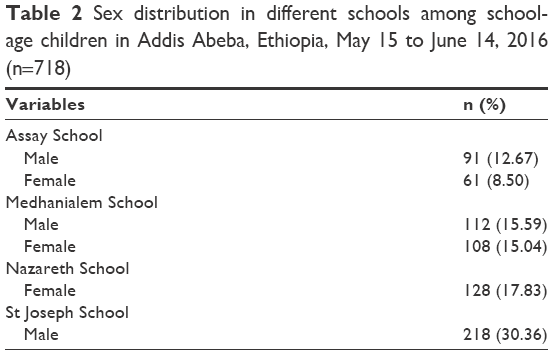 | Table 2 Sex distribution in different schools among school-age children in Addis Abeba, Ethiopia, May 15 to June 14, 2016 (n=718) |
Patterns of visual impairment
Visual impairment was found in 52 (7.24%) of the respondents. Of the respondents with visual impairment, 28 (53.85%) were diagnosed with moderate visual impairment and 24 (46.15%) had developed severe visual impairment. The prevalence of both moderate visual impairment and severe visual impairment was found to be relatively higher in female students (30, 57.69%) than in boys (22, 42.31%). The age range of 10–13 years revealed a higher prevalence of visual impairment with 24 (46.16%). In all, 37 (71.15%) cases were diagnosed among public school students and the rest 15 (28.85%) cases among private school children (Figure 1 and Table 3).
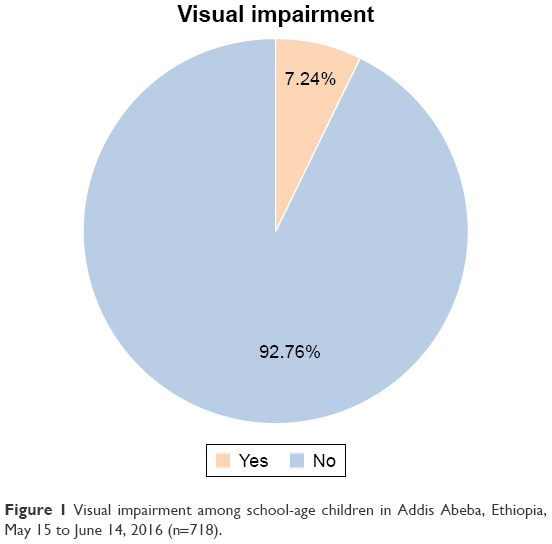 | Figure 1 Visual impairment among school-age children in Addis Abeba, Ethiopia, May 15 to June 14, 2016 (n=718). |
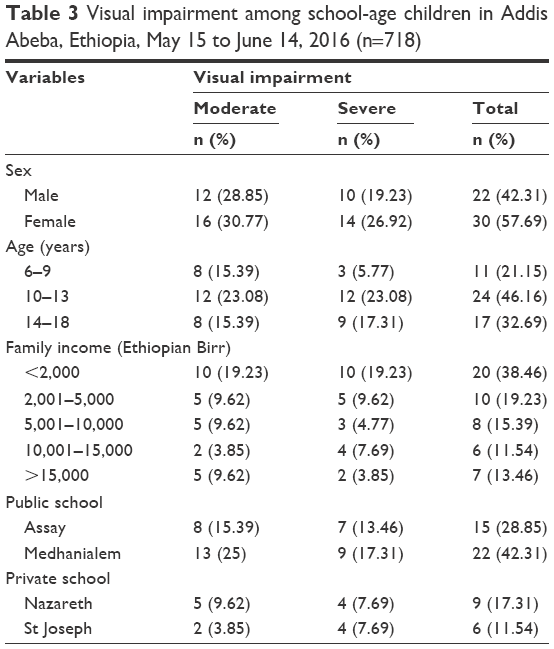 | Table 3 Visual impairment among school-age children in Addis Abeba, Ethiopia, May 15 to June 14, 2016 (n=718) |
Clinical causes of visual impairments
In all, 26 (70.27%), five (13.15%), three (8.11%), two (5.41%) and one (2.7%) cases of visual impairments were due to refractive error, vitamin A deficiency, corneal problem, retinal disease and amblyopia, respectively (Table 4).
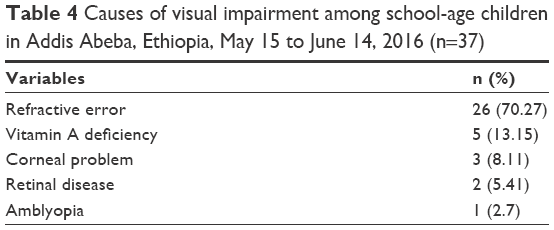 | Table 4 Causes of visual impairment among school-age children in Addis Abeba, Ethiopia, May 15 to June 14, 2016 (n=37) |
Clinical pattern of refractive error
Of the students with refractive error, 13 (50%) had astigmatism and 10 (38.46%) had myopia. Three (11.54%) students developed hyperopia. Based on the sex distribution, seven (26.92%), one (3.85%) and eight (30.76%) of the female students had developed myopia, hyperopia and astigmatism, respectively (Figure 2).
 | Figure 2 Refractive errors among school-age children in Addis Abeba, Ethiopia, May 15 to June 14, 2016 (n=26). |
Factors associated with visual impairment
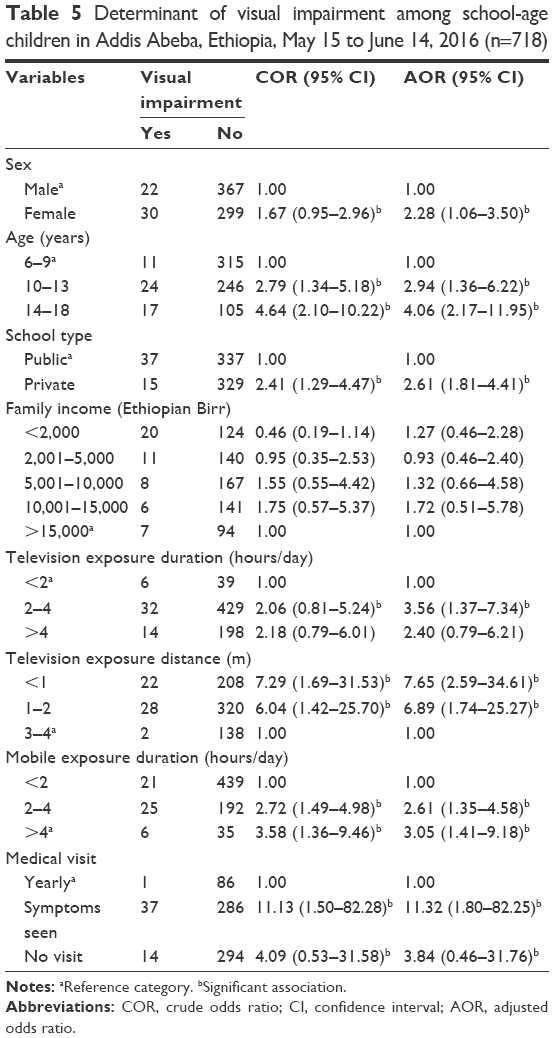
On multivariate logistic regression, sex, age, school type, television exposure duration, the distance of television exposure, mobile exposure and medical visit were found to be factors associated significantly with visual impairment. On the other hand, family’s income did not show statistically significant association with visual impairment (p>0.05).
Females were 2.3 times more likely to develop visual impairment as compared to males (adjusted odds ratio [AOR], 2.28; 95% CI, 1.06–3.50).
Those students in the age group of 10–13 years were 2.9 times more likely to develop visual impairment as compared to students in the age group of 6–9 years (AOR, 2.94; 95% CI, 1.36–6.22). Similarly, students in the age group of 14–18 years were four times more likely to develop visual impairment as compared to students in the age group of 6–9 years (AOR, 4.06; 95% CI, 2.17–11.95).
Regarding school type where the students enrolled, those students who have enrolled in private school were 2.6 times more likely to develop visual impairment as compared to public school students (AOR, 2.61; 95% CI, 1.81–4.41).
Respondents watching television for 2–4 hours/day on average were 3.6 times more likely to develop visual impairment as compared to students watching television on average for <2 hours/ day (AOR, 3.56; 95% CI, 1.37–7.34).
Distance to watch television was also found to have a significant association with visual impairments; so, students who watch television at <1 m distance were 7.6 times more likely to develop visual impairment as compared to students who watch television at 3–4 m (AOR, 7.65; 95% CI, 2.59–34.61). Furthermore, students who watch television at 1–2 m distance were 6.9 times more likely to develop visual impairment as compared to students who watch television at 3–4 m (AOR, 6.89; 95% CI, 1.74–25.27).
Mobile exposure duration was also found to be one of the factors associated with visual impairment. Students who had exposure to mobile for 2–4 hours/day were 2.6 times more likely to develop visual impairment as compared to students who had exposure to mobile for <2 hours/day (AOR, 2.61; 95% CI, 1.35–4.58). Students who had exposure to mobile for >4 hours/day were three times more likely to develop visual impairment as compared to students who had exposure to mobile for <2 hours/day (AOR, 3.05; 95% CI, 1.41–9.18).
Medical visit experience was also found to be significantly associated with visual impairment. Those students who had the medical visit when they experienced symptoms were 11 times more likely to develop visual impairment as compared to students who had a yearly medical visit (AOR, 11.32; 95% CI, 1.80–82.25). Those students who had no visit were four times more likely to develop visual impairment as compared to students who had a yearly medical visit (AOR, 3.84; 95% CI, 0.46–31.76; Table 5).
 | Table 5 Determinant of visual impairment among school-age children in Addis Abeba, Ethiopia, May 15 to June 14, 2016 (n=718) |
Discussion
The study assessed the prevalence and factors associated with visual impairment among school-age children in Addis Abeba. It was found that 7.24% of the students had visual impairment. This implies that the prevention techniques applied were at a low level. This might be related to the limitation of technologically advanced health care services. According to the Vision 2020 plan, the major priority area to act on is corneal scarring and visual impairment eradication.12 With this prevalence of visual impairment, it might be hard to achieve this plan. Hence, increase in immunization coverage and vitamin A supplementation is required.
The study revealed that those students who watch television for 2–4 hours/day were 3.6 times more likely to develop visual impairment than students watching television on average for <2 hours/day. This might be related to the fact that watching television close-up creates a visual strain on the eye of the children. A lot of television watching can surely cause eye sore and fatigue, particularly for those sitting very close and watching from odd angles.
Those students who had a medical visit when they experienced symptoms were 11.3 times more likely to develop visual impairment than those school-age students who had a medical visit yearly. This could be due to the fact that most of the serious eye problems that cause visual impairment can be prevented through screening for potential eye problems before the occurrence. However, in those school-age students who had a medical visit when they experienced clinical features may not cure the disorder because of the lack of early management.
In this study, 7.24% of the students had a visual impairment. On the other hand, according to a study conducted in Nigeria, 2.09% had a visual impairment.23 The difference could be due to the fact that in the study area, there was no adequate provision of eye care service that might increase the occurrence.
In this study, refractive error causes 70.27% of the visual impairment. Similarly, in the study conducted in Nigeria, 76.8% of the students had a refractive error.23 The difference could be due to the current implementation of better immunization coverage and vitamin A capsule supplementation program for preschool- and school-age children in the study area.
In all, 38.46% children had developed myopia. On the other hand, according to a study did in Brazil, the prevalence of myopia was 5.46%,24 and in India, it was 16.75%.25 This difference could be due to the difference in the feature of health care service provided in the hospitals and accessibility of health care service.
In this study, none of the school-age students were blind, whereas according to the study conducted in Sudan, 4.1%26 school-age students had developed blindness. WHO estimates showed the prevalence of blindness was 1.0%,27 and according to the study performed in Nigeria, the prevalence was 1.22%.23 This difference could be due to under sampling of the blind people in this study.
This study’s limitation was that retinal and optic nerve disease would have been missed as not every child underwent indirect ophthalmoscopy. Xerophthalmia was only assessed clinically and was not evaluated by serum determination of vitamin A levels. Some of the cases with Bitot’s spots could have been old cases of vitamin A deficiency with normal current levels.
Conclusion
The study has clearly shown that the majority of the school-age children with visual impairment had low vision. Females were more affected. Vitamin A deficiency was found to be the main cause of visual impairment. Astigmatism was the most important refractive error. According to the finding of the study, sex, age, school type, television exposure duration, distance of television exposure, mobile exposure and medical visit were significantly associated with visual impairment.
Acknowledgments
The authors express our deepest gratitude to Adama General Hospital and Medical College for sponsoring this thesis project. We also thank the schools administrators for their collaboration, while conducting this study. We deeply appreciate Mr Berhane Abrha for his valuable support during the research project. Sun Optical Technologies’ management staff, especially Marketing Department, deserve our heartfelt appreciation for their kindness and unlimited support in regard to providing us with access for the required data. Last but not the least, our appreciation also goes to the data collectors, supervisors, nurses and students.
Disclosure
The authors report no conflicts of interest in this work.
References
Whitifield R, Schwab L, Ross-Dgnan D, Steinkuller P, Swartwood J. Blindness and eye diseases in Kenya: ocular status survey results from the Kenya Rural Blindness Prevention Project. Br J Ophthalmol. 1990;74(6):333–340. | ||
World Health Organization [webpage on the Internet]. Prevention of Blindness and Deafness. 2017. Available from: http://www.who.int/pbd/en/. Accessed October 7, 2017. | ||
Serge R, Donatella P, Mariotti SP, Pokharel GP. Global magnitude of visual impairment caused by uncorrected refractive errors in 2004. Bull World Health Organ. 2008;86:63–70. | ||
World Health Organization. Prevention of Childhood Blindness. Geneva: WHO Press; 1992. | ||
Maberley DA, Hollands H, Chuo J, et al. The prevalence of low vision and blindness in Canada. Eye. 2006;20(3):341–346. | ||
Pizzarello L, Abiose A, Ffytche T, et al. VISION 2020: the right to sight a global initiative to eliminate avoidable blindness. Arch Ophthalmol. 2004;122(4):615–620. | ||
West S, Munoz B, Lynch M, et al. Impact of face washing on trachoma in Kongwa, Tanzania. Lancet. 1995;345(8943):155–158. | ||
Berhane Y, Worku A, Bejiga A. National Survey on Blindness, low vision and trachoma in Ethiopia: methods and study clusters profile. Ethiop J Health Dev. 2007;21(3):185–203. | ||
Emslie-Smith D, Paterson CR, Scratcherd T, Read NW. Textbook of Physiology. 11th ed. New York:Oxford University Press. 1998:456–457. | ||
Central Statistical Authority. Federal Democratic Republic of Ethiopia Central Statistical Authority. Statistical Abstract 2003. Addis Ababa: Central Statistical Authority; 2004. | ||
Gogate P, Gilbert C, Zin A. Severe visual impairment and blindness in infants: causes and opportunities for control. Middle East Afr J Ophthalmol. 2011;18(2):109–114. | ||
Brien Holden Vision Institute. Aboriginal Eye Care Program. 2012. Available from: http://www.brienholdenvision.org/our-work/westernpacific/australia/aboriginal-eye-areprogram.html. Accessed January 2, 2017. | ||
Brien Holden Vision Institute. Myopia Control. 2012. Available from: www.visioncrc.org/our-programs/myopia-control.html. Accessed December 15, 2017. | ||
Diez MA, Luque MJ, Capilla P, Gomez J, de Fez MD. Detection and assessment of colour vision anomalies and deficiencies in children. J Pediatr Ophthalmol Strabismus. 2001;38(4):195–205. | ||
Abebe Y, Wondmikun Y. Defective colour perception among car drivers in Addis Ababa, Ethiopia. Traffic Inj Prev. 2002;3(4):294–297. | ||
Alemayehu W, Tekle-Haimanot R, Forsgren L, Erkstedt J. Causes of visual impairment in Central Ethiopia. Ethiop Med J. 1995;33(3):163–174. | ||
Aniza I, Azmawati MN, Jamsiah M, Idayu BI, Mae Lynn CB. Prevalence of visual acuity impairment and its associated factors among secondary school students in Beranang, Selangor. Malays J Public Health Med. 2012;12(1):39–44. | ||
Sharpe Lindsay T, Stockman A, Nathans J. Chapter 1: opsin genes, cone photopigments, color vision, and color blindness. In: Gegenfurthner Karl R, Sharpe Lindsay T, editors. Color Vision: From Genes to Perception. Cambridge: Cambridge University Press; 2001. | ||
Murthy GVS, Gupta S, Ellwein LB. A population based eye survey of older adults in a rural district of Rajasthan: central vision impairment, blindness, and cataract surgery. Ophthalmology. 2001;108:679–685. | ||
World Health Organization. Global Data on Visual Impairments. 2010. Available from: http://www.who.int/blindness/GLOBALDATAFINALforweb.pdf. Accessed May 21, 2017. | ||
Frick KD, Foster A. The magnitude and cost of global blindness: an increasing problem that can be alleviated. Am J Opthalmol. 2003;135:471–476. | ||
Silverthorn D, Johnson B, Ober W, Silverthorn A. Human Physiology: An Integrated Approach. 5th ed. San Francisco, Pearson/Benjamin Cummings. 2010:372–378. | ||
Fasina FO, Ajaiyeoba AI. The prevalence and causes of blindness and low vision in Ogun State, Nigeria. Afr J Biomed Res. 2003;6:63–67. | ||
Salomão SR, Mitsuhiro MR, Belfort R Jr. Visual impairment and blindness: an overview of prevalence and causes in Brazil. An Acad Bras Cienc. 2009;1(3):539–549. | ||
Murthy GV, Gupta SK, Ellwein LB, et al. Refractive error in children in an Urban Population in New Delhi. Invest Ophthalmol Vis Sci. 2002;43(3):623–631. | ||
Jeremiah N, Francis OS, Alice O, et al. Prevalence and causes of blindness and low vision in Southern Sudan. PLoS Med. 2006;3(12):1–8. | ||
World Health Organization [webpage on the Internet]. Prevention of Blindness and Visual Impairment. 2005. Available from: http://www.who.int/blindness/en/. Accessed August 8, 2017. |
 © 2017 The Author(s). This work is published and licensed by Dove Medical Press Limited. The
full terms of this license are available at https://www.dovepress.com/terms
and incorporate the Creative Commons Attribution
- Non Commercial (unported, 3.0) License.
By accessing the work you hereby accept the Terms. Non-commercial uses of the work are permitted
without any further permission from Dove Medical Press Limited, provided the work is properly
attributed. For permission for commercial use of this work, please see paragraphs 4.2 and 5 of our Terms.
© 2017 The Author(s). This work is published and licensed by Dove Medical Press Limited. The
full terms of this license are available at https://www.dovepress.com/terms
and incorporate the Creative Commons Attribution
- Non Commercial (unported, 3.0) License.
By accessing the work you hereby accept the Terms. Non-commercial uses of the work are permitted
without any further permission from Dove Medical Press Limited, provided the work is properly
attributed. For permission for commercial use of this work, please see paragraphs 4.2 and 5 of our Terms.