Back to Journals » Clinical Interventions in Aging » Volume 15
Predictive Value of Nutritional Risk Screening 2002 and Mini Nutritional Assessment Short Form in Mortality in Chinese Hospitalized Geriatric Patients
Authors Zhang X ![]() , Zhang X, Zhu Y, Tao J, Zhang Z, Zhang Y
, Zhang X, Zhu Y, Tao J, Zhang Z, Zhang Y ![]() , Wang Y, Ke Y, Ren C, Xu J
, Wang Y, Ke Y, Ren C, Xu J
Received 6 January 2020
Accepted for publication 6 March 2020
Published 20 March 2020 Volume 2020:15 Pages 441—449
DOI https://doi.org/10.2147/CIA.S244910
Checked for plagiarism Yes
Review by Single anonymous peer review
Peer reviewer comments 4
Editor who approved publication: Dr Zhi-Ying Wu
Xiaoyan Zhang,* Xingliang Zhang,* Yunxia Zhu, Jun Tao, Zhen Zhang, Yue Zhang, Yanyan Wang, YingYing Ke, ChenXi Ren, Jun Xu
Department of Geriatrics, Shanghai Jiaotong University Affiliated Sixth People’s Hospital, Shanghai 200233, People’s Republic of China
*These authors contributed equally to this work
Correspondence: Xiaoyan Zhang Email [email protected]
Background and Aim: The presence of malnutrition in hospitalized geriatric patients is associated with an increased risk of mortality. This study aimed to examine the performance of Nutritional Risk Screening 2002 (NRS2002) and Mini Nutritional Assessment Short Form (MNA-SF) in predicting mortality for hospitalized geriatric patients in China.
Methods: A prospective analysis was performed in 536 hospitalized geriatric patients aged ≥ 65 years. Nutrition status was assessed using the MNA-SF and NRS2002 scales within 24 hrs of admission. Anthropometric measures and biochemical parameters were carried out for each patient. Patients were follow-up for up to 2.5 years.
Results: At baseline, 161 (30.04%) patients had malnutrition/nutritional risk according to NRS2002 assessment. According to MNA-SF, 284 (52.99%) patients had malnutrition/nutritional risk. Malnutrition/nutritional risk patients had lower anthropometric and biochemical parameters (P< 0.05). NRS2002 and MNA-SF had a strong correlation with classical nutritional markers (P< 0.05). NRS2002 versus MNA-SF showed moderate agreement (kappa=0.493, P< 0.001). During a median follow-up time of 795 days (range 10– 947 days), 118 (22%) participants died. The Kaplan–Meier curve demonstrated that malnutrition/nutritional risk patients according to NRS2002 or MNA-SF assessment had a higher risk of mortality than the normal nutrition patients (χ2=17.67, P< 0.001; χ2=28.999, P< 0.001, respectively). From the components of the Cox regression multivariate models, only the NRS2002 score was an independent risk factor influencing the mortality.
Conclusion: Both NRS2002 and MNA-SF scores could predict mortality in Chinese hospitalized geriatric patients. But only NRS2002 score was the independent predictor for mortality.
Keywords: NRS2002, MNA-SF, elderly, nutritional screening, malnutrition
Introduction
The prevalence of malnutrition in hospitalized patients has been reported as 20–60% depending on the screening instruments used for assessment.1,2 Furthermore, the importance of nutrition in hospitalized geriatric patients has been extensively documented. Malnutrition is more common in geriatric patients due to aging, comorbidities, cognitive impairment, polypharmacy, and economical difficulty.3,4 The presence of malnutrition in geriatric hospitalized patients is associated with increased risk of complications, prolonged hospital stays, readmission rate, increased mortality, and increased medical costs.5 Therefore, early diagnosis of malnutrition or nutritional risk by evaluating the nutritional status of hospitalized geriatric patients is highly important.
Screening for malnutrition is the recommended first step in nutritional management.6 Nutritional risk screening using validated tools is a simple technique to rapidly identify geriatric patients at nutritional risk, providing a basis for prompt and adequate nutritional support referrals, as well as an individualized nutritional intervention. Therefore, appropriate tools must be applied when assessing the risk of malnutrition in hospitalized geriatric patients. Within the last several decades, 33 different nutritional risk screening tools have been invented to detect malnutrition patients in worldwide hospitals, home care institutions, and community settings.7
Although there are many widely used nutritional screening tools, well-known examples are Mini Nutritional Assessment (MNA) and Nutritional Risk Screening 2002 (NRS2002). The MNA was developed to certain subgroups, especially for elderly individuals before changes in weight or albumin occur.8 Short-form of MNA (MNA-SF) was designed later to provide a simple and more practical screening tool given the original MNA was time-consuming.9 Another reason for the development of MNA-SF is the original MNA had low specificity, as well as subjects had difficulties in completing the full assessment without the help of a caregiver. MNA-SF has been validated as a screening tool and shown as high sensitivity (97%) and specificity compared to the MNA full test. The MNA-SF only incorporates 6 of the original 18 items that were on the MNA and takes approximately 5 mins to perform. NRS2002 was developed for hospitalized patients and recommended by the European Society for Clinical Nutrition and Metabolism.10 NRS2002 was thought to be effective allowing for quicker identification, especially in case of acute illness; however, its initial design was not for use in the elderly population. The use of an inappropriate screening tool negatively influences patients care and risks misdiagnosis or missed diagnosis of nutrition-related problems.
There is a need for universal nutrition screening tools as a “gold standard” for use in hospitalized geriatric patients.11 Since the different tools were used in different settings by different studies, it is very hard to compare between studies and conclude which tool is the “adequate tool” to screen the nutritional status of hospitalized elderly patients. To assess which tool performs the best, studies comparing NRS2002 and MNA-SF in the same population are very valuable and informative, since they are not biased by differences between populations, setting, or age.7
The purpose of this study was to evaluate the performance of NRS2002 and MNA-SF, the main nutritional screening tools used nowadays, especially in predicting mortality in hospitalized geriatric patients in China.
Methods
Study Design
The study was a prospective longitudinal analysis in patients hospitalized in the Department of Geriatrics at Shanghai Jiaotong University Affiliated Sixth People’s Hospital. A total of 536 consecutive patients between April 2017 and April 2018 were recruited in this study. The study inclusion criteria were being ≥65 years of age, not having received nutritional therapy at the time of assessment. The exclusion criteria were age <65 years, presence of ending carcinomatous cachexia (referent to the clinical history), inability to communicate. The study was approved by the Ethics Committee of the Shanghai Jiaotong University Affiliated Sixth People’s Hospital (approval number, 2016-141-(1)). Written informed consent was obtained from all participants and adhered to the tenets of the Declaration of Helsinki.
Data Collection
Participants’ demographic information, lifestyle variables, and personal disease history were collected using questionnaires and confirmed through examination of medical records. The variables included age, sex, history of diabetes, hypertension, cerebral infarction, chronic obstructive pulmonary disease, coronary heart disease, dementia, and neoplasms.
Anthropometric Measurements
Anthropometric parameters included height, weight, mid-arm circumference (MAC), waist circumference (WC), and calf circumference (CC). Height and weight were measured while the participants were barefoot and in light clothing using the height and weight scale to the nearest 0.1 cm and 0.1 kg, respectively. Body mass index (BMI) was calculated as weight in kilograms divided by height in meters squared. MAC was measured with a millimeter tape at the midpoint of the arm, between the olecranon and acromion. WC was measured at the middle point between the rib cage and iliac crests. CC was measured with the elderly individual in standing position, at the greatest circumference of the lower right leg, recorded in centimeters (cm), accurate to one decimal place. All measurements were performed in duplicate, and the means were calculated for analysis.
Nutritional Risk Assessment
NRS2002 was used to determine malnutrition and nutritional risk. Nutritional status was determined by three variables: recent weight loss, low food intake, and BMI during the week before admission. The diseases were analyzed as an indicator of metabolic stress and increased nutritional requirements. Both categories give 0 to 3 points. An adjustment factor was used in individuals aged ≥70 years. The total NRS2002 score indicates whether the patient is at nutritional risk or malnutrition (score ≥3) or normal nutritional status.
MNA-SF contains six questions selected from MNA. These questions include BMI, recent weight loss, appetite or eating problems, mobility impairment, acute illness/psychological stress, and dementia or depression. Each question is rated from 0 to 2 or 3 and the total score of MNA-SF is 14. Patients with 12–14 points are at the normal nutritional status and patients with scores ≤11 are at nutritional risk/malnutrition. A multidisciplinary nutrition research team evaluated the nutritional status of each patient. All patients underwent nutritional status assessment in the first 24 h of hospital stay. Moreover, the research team members were not aware of the laboratory test results at the time of assessment.
Laboratory Measurements
Fasting blood samples were collected from each patient. Hemoglobin (Hb) level was measured using a standard cyanmethemoglobin method. Total lymphocyte count (TLC) was assayed automatically by a blood cell analyzer (Beckman Coulter LH750). Serum iron (Iron) levels were measured by performing a colorimetric endpoint assay with commercial kits from Roche China (Shanghai, China). Serum albumin (ALB), prealbumin (PAB), Retinol-binding protein (RBP), and creatinine (Cr) levels were assessed using turbidimetric immunoassay (Hitachi, Tokyo, Japan). Serum transferrin was detected by nephelometry on Behring BNⅡ automatic specific protein determination system and its supporting reagents (Siemens, Erlangen, Germany). Serum folic acid and vitamin B12 levels were measured using a chemiluminescent immunoassay. Serum C-reactive protein (CRP) was measured by particle-enhanced immunonephelometric assay (Dade Behring Inc., Newark, NJ, USA).
Handgrip Strength (HGS)
HGS was measured with the subject in the seated position, knee and hip flexion at 90 degrees, and two feet naturally placed on the ground; the shoulders remained adducted, the upper arm is flat with the chest, the forearm is neutral, and the elbow is bent to 90 degrees. The maximum HGS of the dominant hand (WCS-100 electronic vibrometer, China) was measured three times with 1 min of rest between each repetition. HGS has defined the maximum value of three repetitions.
Follow-Up for Adverse Outcomes
All the participants were followed in the geriatric outpatient clinic of Shanghai Jiaotong University Affiliated Sixth People’s Hospital. The deadline for the follow-up was October 30, 2019. All deaths occurring between study entry and deadline were included. Due to the participants accepting healthcare at Shanghai Jiaotong University Affiliated Sixth People’s Hospital, there were no missing follow-ups.
Statistical Analysis
For continuous variables, results were presented as mean ± standard deviation or median (25th percentile to 75th percentile), and the differences between groups were evaluated with the Student’s t-test or Mann–Whitney U-test. Categorical variables were presented as frequency percentage, and intergroup comparisons were analyzed using the chi-square test. The association between NRS2002 and MNA-SF scores and other nutritional parameters were evaluated with Pearson or Spearman correlation analysis. The agreement between the two screening tools was compared using the kappa coefficient. The results were interpreted as follows: <0, no agreement; ≤0.20, poor agreement; 0.20–0.40, weak agreement; 0.40–0.60 moderate agreement; 0.61–0.80, substantial agreement; and 0.81 to 1.00, almost perfect agreement. Kaplan–Meier analysis with the Log rank test was used to compare the difference between the normal and malnutrition/nutritional risk groups according to the NRS2002 and MNA-SF. The results of the mortality were illustrated by survival curves. All variables with a P<0.05 in the univariate analysis were included in the multivariate Cox regression analyses. Multivariable Cox regression models with hazard ratios (HR) and 95% CI were conducted to examine the association of NRS2002 and MNA-SF with mortality. All statistical analyses were performed using SPSS 21.0 (SPSS Inc., Chicago, IL). A two-sided P-value <0.05 was considered statistically significant.
Results
Baseline Characteristics of the Patients with and Without Malnutrition/Nutritional Risk
A total of 536 individuals met the eligibility criteria and completed a nutrition assessment within 24 h of admission. The average age was 86.84±4.23 years, including 406 men and 130 women. The most frequent cause of hospitalization was cardiac disease (n=168), followed by cerebrovascular disease (n=96), hypertension (n=91), pulmonary infection (n=90), diabetes (n=53), dementia (n=20), and cancer (n=18). Due to the comorbidity of geriatric patients, all the patients had several diseases when admission. We only ranked according to the first diagnosis.
At baseline, 284 (52.99%) patients were malnutrition/malnutritional risk and 252 (47.01%) patients were well-nutritional according to MNA-SF assessment. According to NRS2002 assessment, 161 (30.04%) patients were malnutrition/nutritional risk and 375 (69.96%) patients were normal nutritional status. Patients who were classified as malnutrition/nutritional risk using either NRS2002 or MNA-SF had lower BMI, MAC, CC, HGS, ALB, PAB, Hb, RBP, Iron, transferrin, but higher age and CRP levels when compared to normal nutritional status (P<0.05). There was no significant difference between malnutrition/nutritional risk and normal groups in TLC, Cr, folic acid, and vitamin B12 (P>0.05). Distribution of the basic characteristics at baseline between normal and malnutrition/nutritional risk according to NRS2002 and MNA-SF were summarized in Table 1.
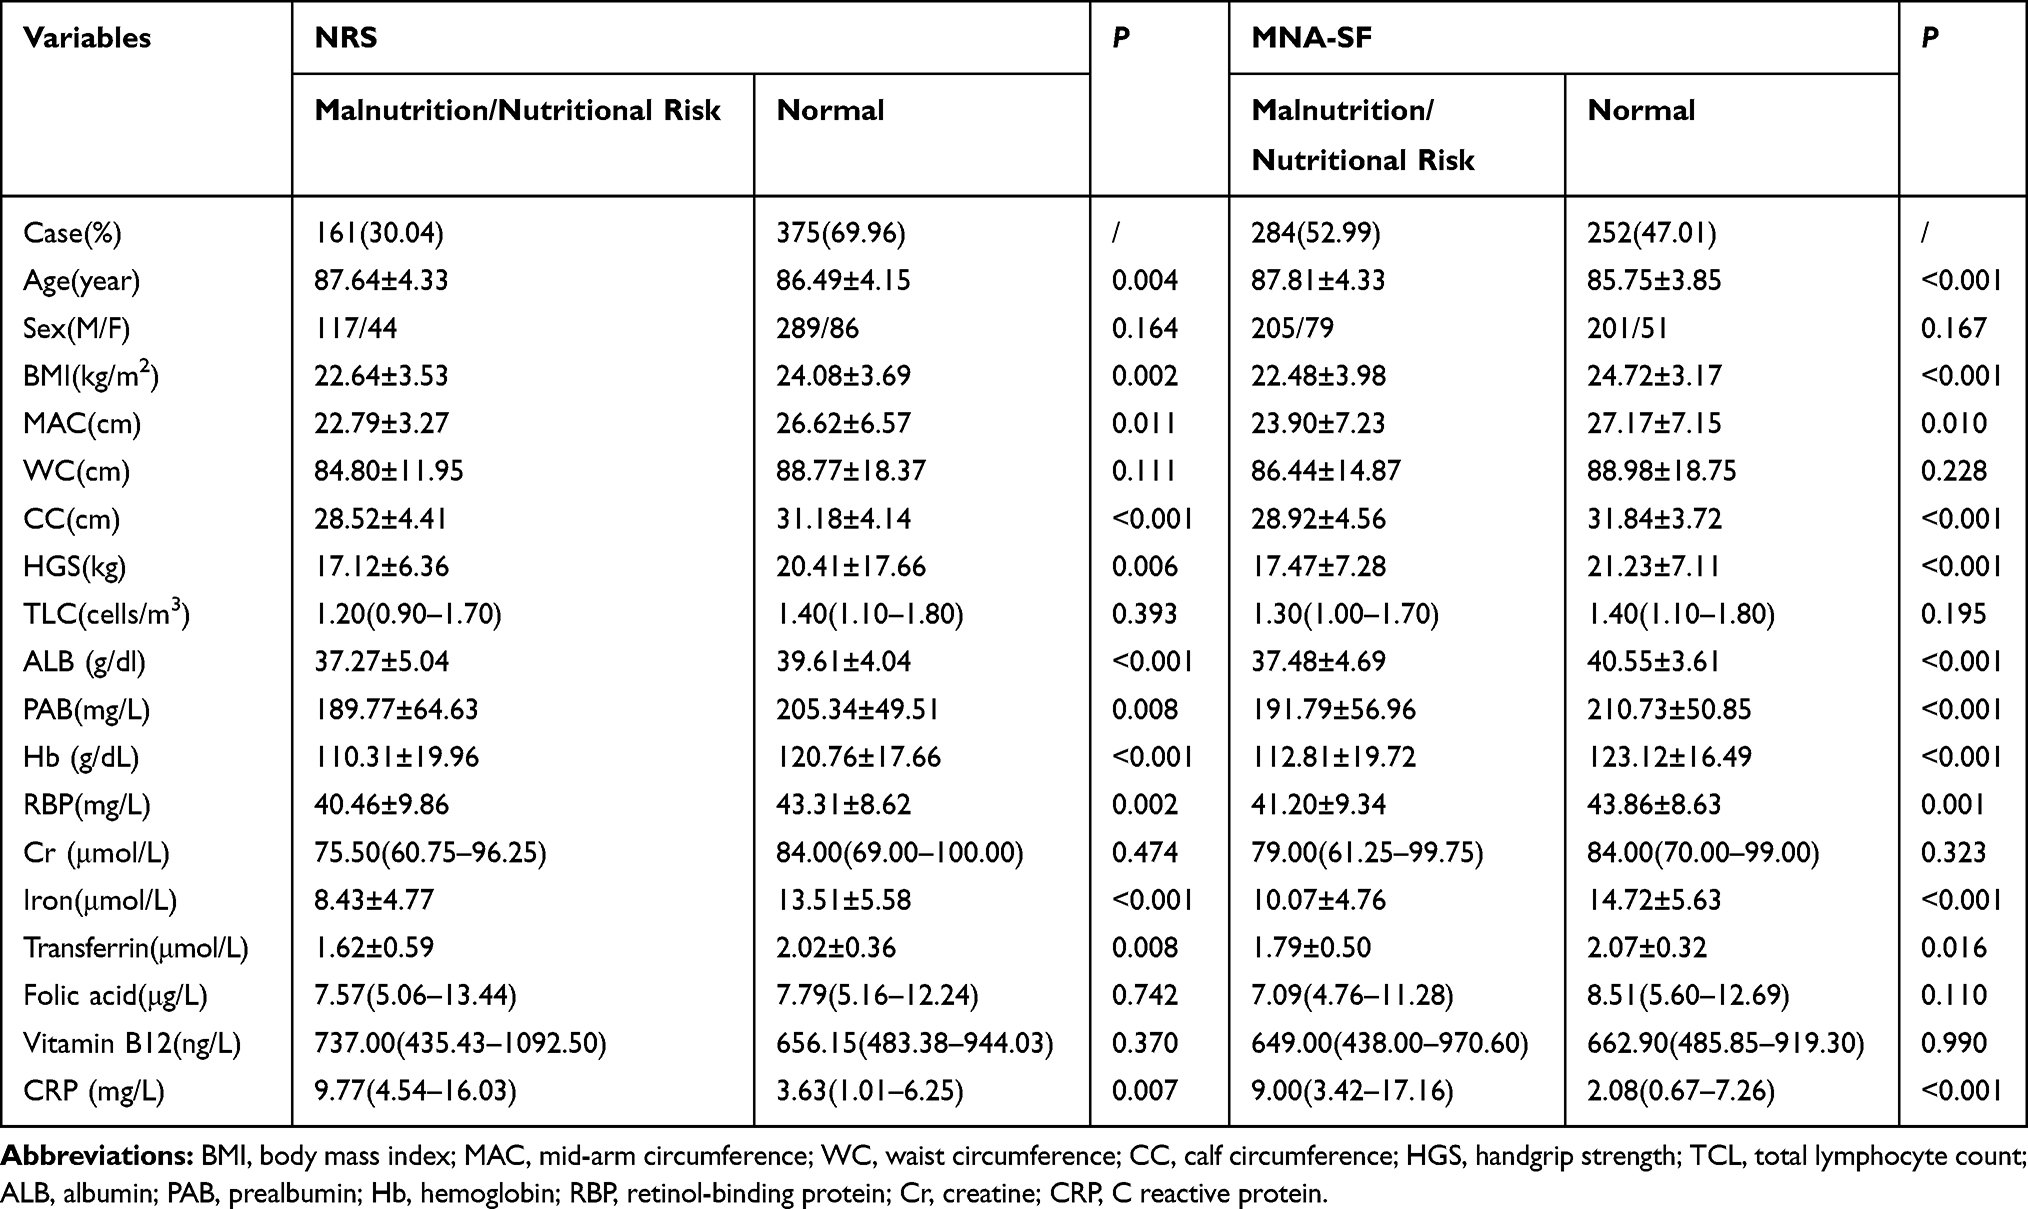 |
Table 1 Comparison of Basic Baseline Anthropometric and Biochemical Characteristics of Subjects According to NRS2002 and MNA-SF Assessment |
Variables Associated with the NRS2002 and MNA-SF Scores
Table 2 shows the Pearson or Spearman correlation coefficients of NRS2002 and MNA-SF scores with serum nutrition-related biomarkers and anthropometric parameters. Anthropometric parameters (MAC, WC, CC) and serum nutrition-related biomarkers (ALB, PAB, Hb, RBP, Cr, Transferrin, TLC) correlated positively with malnutrition scores of MNA-SF and correlated inversely with the scores of NRS2002 (P<0.05). It was found a significant negative correlation of MNA-SF scores with age and CRP (P<0.05). While NRS2002 scores with age and CRP have a positive correlation (P<0.05).
 |
Table 2 Correlation of Anthropometric and Biochemical Parameters with NRS2002 and MNA-SF Scores |
The Agreement of NRS2002 and MNA-SF Assessment
Table 3 shows the cross-classification of NRS2002 and MNA-SF with regards to two nutritional categories. It revealed that NRS2002 showed a moderately low consistency (kappa=0.493, P<0.001) with MNA-SF. MNA-SF identified more patients who were as malnutrition/nutritional risk than the NRS2002 assessment did (284 vs 161, respectively). The 131 patients who were classified as malnutrition/nutritional risk according to MNA-SF assessment were at low or no risk according to NRS2002 assessment. Only 8 participants considered by NRS2002 to be malnutrition/nutritional risk were classified as normal nutritional status using MNA-SF.
 |
Table 3 Kappa Test for Agreement in Diagnosing Malnutrition/Nutritional Risk Between NRS2002 and MNA-SF Scores (n=536) |
We further analyzed the characteristic of 131 cases of disagreement and 153 cases of agreement patients according to NRS2002 and MNA-SF assessment. Only Hb and Iron levels were significantly different between the two groups (P>0.05). Furthermore, no difference in survival days between the two groups (P>0.05) (Table 4).
 |
Table 4 Comparison of the Characteristics of the Agreement and Disagreement Patients According to NRS2002 and MNA-SF Assessment |
Predictive Performance of the NRS2002 and MNA-SF Scores for Mortality
During a median follow-up time of 795 days (range 10–947 days), 118 (22%) participants died. The death rate in the malnutrition/nutritional risk group was higher than their counterparts according to NRS2002 assessment (33.54% vs 17.07%, P<0.001). There was a significant difference between malnutrition/nutritional risk group and normal patents in death according to MNA-SF assessment (31.33% vs 11.51%, P<0.001). The Kaplan–Meier curve demonstrated that malnutrition/nutritional risk patients according to NRS2002 assessment had a higher risk of death than the normal nutritional status patients (Log rank test, χ2=17.67, P<0.001). The difference of the survival curve between the malnutrition/nutritional risk and normal groups according to MNA-SF assessment was statistically significant (Log rank test, χ2=28.999, P<0.001) (Figure 1).
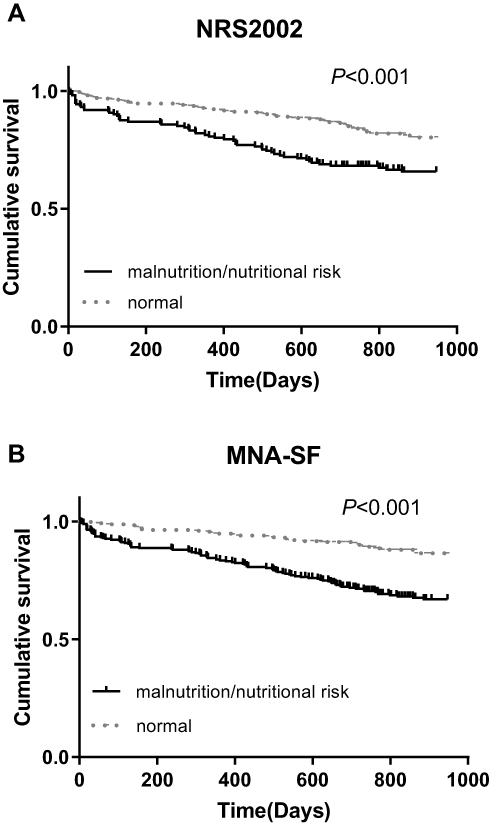 |
Figure 1 Kaplan–Meier analysis for mortality. (A) Malnutrition/nutritional risk vs normal according to NRS2002 assessment, Log rank test χ2=17.67, P<0.001. (B) Malnutrition/nutritional risk vs normal according to MNA-SF assessment, Log rank test χ2=28.999, P<0.001. |
Cox Proportional Hazard Analysis for Mortality
A univariate Cox regression analysis indicated that age, MAC, CC, HGS, Hb, ALB, PAB, Cr, Iron, NRS2002 scores, and MNA-SF scores were significantly correlated with mortality (Table 5). All significant factors in the univariate Cox analysis were entered into the multivariate regression analysis. From the components of the Cox regression multivariate models, only the NRS2002 score was an independent factor influencing the mortality of geriatric hospitalized patients. In the case of the other constant factors, the risk of mortality increased by 2.657-fold when the NRS2002 score increased by 1 point (Table 5).
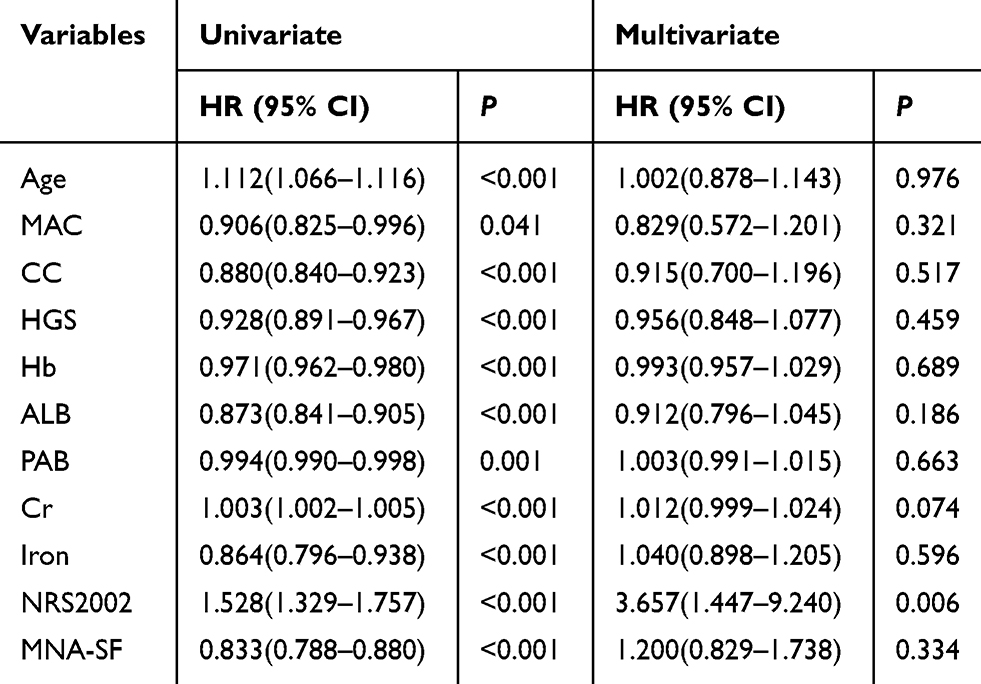 |
Table 5 Cox Proportional Hazard Regression Analysis of Mortality |
Discussion
In the present study, we compared the performance of NRS2002 and MNA-SF in 536 cases of hospitalized geriatric patients in China. Our data demonstrate that whether assessed by NRS2002 or MNA-SF all the patients with malnutrition/nutritional risk had lower serum nutritional biomarker and anthropometric parameters and higher levels of inflammatory markers. These nutritional surveys moderately agreed with one another, however, MNA-SF identified more patients at malnutrition/nutritional risk than NRS2002. The Kaplan–Meier curve demonstrated that malnutrition/nutritional risk patients according to NRS2002 or MNA-SF assessment had a higher risk of mortality than the normal nutrition patients. From the components of the Cox regression multivariate models, only the NRS2002 score was an independent factor influencing the mortality.
Nutritional status is more likely to be addressed to healthy aging for its implications on functional status and ability.12 The prevalence of nutritional risk in our population was 30.04% according to NRS2002 assessment, lower than other recently reported in the Chinese population. Zhou et al reported the prevalence of malnutrition classified by NRS2002 was 38% in 142 elderly patients admitted to surgery in northern China.13 Another study from China enrolled 425 hospitalized patients aged more than 70 years old and reported a prevalence of malnutrition of 40.9% as classified by NRS2002.14 The reason may be due to most of the participants in our study were not in an emergency, while NRS2002 assessment focused on the acute illness. On the other hand, the prevalence of malnutrition classified by MNA-SF of our study was in the middle of the aforementioned studies as our study was 52.99% prevalence while the other two studies were 45% and 58.6% respectively.
Laboratory-based parameters, such as ALB, Hb, and TLC may provide valuable information about patients’ nutritional status, however they are mostly delayed and costly.15,16 ALB and other serum proteins synthesized by the liver, including transferrin, RBP, and PAB, have been widely used as nutritional released markers.17 Besides, Hb and TLC are also proposed as useful indicators of nutritional status. Both tools showed a significant association with these traditional single nutritional indexes. But TLC was found not to have any relationship with MNA-SF or NRS2002 scores.
The assessment of micronutrients is as important as the assessment of macronutrients. For example, laboratory values may help to detect deficiencies in vitamin B12 and folic acid, particularly in chronically malnourished patients.18 But in our study, neither NRS2002 nor MNA-SF assessment can reflect vitamin B12 and folic acid deficiency. Malnutrition diminishes muscle strength and power, which can be measured with HGS as it is closely correlated with nutritional status. There was a significant difference between the malnutrition/malnutritional risk and normal nutrition cohorts in HGS classified by NRS2002 or MNA-SF. Chronic low-grade inflammation has been pointed out as a key element for defining etiology-based types of malnutrition, as both nutritional assessments appear related to CRP, an indicator of systemic inflammation.19
Our results revealed that only a moderate agreement was found between NRS2002 and MNA-SF, indicating that these nutritional assessments identify different at-risk groups. MNA-SF identified more patients at malnutritional risk or malnutrition than NRS2002. MNA-SF is the only nutrition screening tool specially designed for the elderly, but overestimation occurred when MNA-SF was used.20–24 A nutritional screening tool with high sensitivity will allow further diagnosis and appropriate intervention of malnutrition, while a nutritional screening tool with high specificity will reduce the risk of overtreatment of malnutrition. The high sensitivity of MNA-SF may cause a high prevalence of nutrition support associated with its use. This could bring the question about the cost-effectiveness of “overtreatment”. Except for over diagnosis, the need of caregiver’s help to complete MNA-SF, especially for the questions on weight loss, and cognitive or disabilities evaluation, is a limitation in using MNA-SF.25
Malnutrition is associated with a worsening of the prognosis of the underlying disease and increased the risk of mortality. Both NRS2002 and MNA-SF assessment could predict mortality well in our study. But NRS2002 appears to perform better than MNA-SF in predicting mortality when evaluated in the same model that includes other blood biochemical nutritional indicators. Blood biochemical indicators also were no longer significant predictors of mortality in the presence of NRS2002 together with MNA-SF in this model. There were two studies compared the predictive values of NRS2002 and MNA for mortality in elderly people. But the results were contradictory. Diekmann et al reported that the MNA had greater predictive power than the NRS2002 for survival with a follow-up period of up to one year in 200 nursing-home residents.1 On the contrary, Holst et al studied a cohort of 233 hospitalized geriatric patients and found that neither NRS2002 nor MNA could predict 12-month mortality.26 As to the comparison of MNA-SF and NRS2002, Donini et al reported that the MNA-SF had higher predictive value for mortality than the NRS2002, but this study was in a cohort of 246 institutionalized participants.27 Another study from Brazil focused on 705 hospitalized geriatrics patients found that the abilities of the NRS2002 to predict complications, prolonged hospital stay, and death during stay at the hospital were better than MNA-SF.28 Collectively, it appears that these studies has too small of a sample size and not a long enough follow-up period (at most 1 year), causing the contradictory results. The prognostic value of NRS2002 and MNA-SF for mortality in hospitalized geriatric patients still need more study to investigate.
This study had some strengths. This study included a large sample size over 500 subjects, which is more than previous investigations malnourishment in geriatric patients. Secondly, the longest follow-up period was 947 days, thus enhancing our analysis on effects of nourishment status on mortality for ~ 2.5 years. Lastly, the current study used both NRS2002 and MNA-SF assessments, allowing for comparisons of the two assessments.
This study also had some limitations. Firstly, although the NRS2002 scores as an independent predictor can be established in our study, as an observational study, we were unable to establish the causality of the relationship between the NRS2002 scores and mortality. Secondly, the caring teams were not blinded to the nutritional screening results and may have altered their care plans based on assessment results, which might alter the mortality risk. Lastly, it was a single-center study of hospitalized patients in geriatric wards. All study participants were Chinese, so the study results may not be suitable for other ethnic groups.
Conclusion
Both NRS2002 and MNA-SF scores could predict mortality in Chinese hospitalized geriatric patients. But only NRS2002 score was the independent predictor for mortality. More studies are needed to investigate if similar findings also apply to other groups of hospitalized older patients.
Abbreviations
NRS2002, nutritional risk screening 2002; MNA-SF, mini nutritional assessment short form; MNA, mini nutritional assessment; MAC, mid-arm circumference; WC, waist circumference; CC, calf circumference; BMI, body mass index; Hb, Hemoglobin; Iron, serum iron; ALB, serum albumin; PAB, prealbumin; RBP, retinol-binding protein; Cr, creatinine; CRP, C-reactive protein; TLC, total lymphocyte count.
Data Sharing Statement
The data supporting this study is available from the corresponding author for reasonable request.
Acknowledgments
We thank all the team involved in the development and implementation of the study: Jin Wang, Caihua Zhang, Xuelian Chen, Xiaokang Sun, Ji Li.
Funding
No funding support for this study.
Disclosure
The authors declare that they have no conflict of interest in this work.
References
1. Diekmann R, Winning K, Uter W, et al. Screening for malnutrition among nursing home residents - a comparative analysis of the mini nutritional assessment, the nutritional risk screening, and the malnutrition universal screening tool. J Nutr Health Aging. 2013;17(10):326–331. doi:10.1007/s12603-012-0396-2
2. Stratton RJ, Hackston A, Longmore D, et al. Malnutrition in hospital outpatients and inpatients: prevalence, concurrent validity and ease of use of the ‘malnutrition universal screening tool’ (‘MUST’) for adults. Br J Nutr. 2004;92(5):799–808. doi:10.1079/BJN20041258
3. Fávaro-Moreira NC, Krausch-Hofmann S, Matthys C, et al. Risk factors for malnutrition in older adults: a systematic review of the literature based on longitudinal data. Adv Nutr. 2016;7(3):507–522. doi:10.3945/an.115.011254
4. Álvarez-Hernández J, Planas Vila M, León-Sanz M, et al.; PREDyCES researchers. Prevalence and costs of malnutrition in hospitalized patients; the PREDyCES Study. Nutr Hosp. 2012;27(4):1049–1059. doi:10.3305/nh.2012.27.4.5986
5. Correia MI, Waitzberg DL. The impact of malnutrition on morbidity, mortality, length of hospital stay and costs evaluated through a multivariate model analysis. Clin Nutr. 2003;22(3):235–239. doi:10.1016/S0261-5614(02)00215-7
6. Field L, Hand R. Differentiating malnutrition screening and assessment: a nutrition care process perspective. J Acad Nutr Diet. 2015;115(5):824–828. doi:10.1016/j.jand.2014.11.010
7. Bokhorst-de van der Schueren MA, Guaitoli PR, Jansma EP, de Vet HC. Nutrition screening tools: does one size fit all? A systematic review of screening tools for the hospital setting. Clin Nutr. 2014;33(1):39–58. doi:10.1016/j.clnu.2013.04.008
8. Vellas B, Guigoz Y, Garry PJ, et al. The Mini Nutritional Assessment (MNA) and its use in grading the nutritional state of elderly patients. Nutrition. 1999;15(2):116–122. doi:10.1016/S0899-9007(98)00171-3
9. Rubenstein LZ, Harker JO, Salvà A, Guigoz Y, Vellas B. Screening for undernutrition in geriatric practice: developing the short-form mini-nutritional assessment (MNA-SF). J Gerontol a Biol Sci Med Sci. 2001;56(6):M366–M372. doi:10.1093/gerona/56.6.M366
10. Cederholm T, Bosaeus I, Barazzoni R, et al. Diagnostic criteria for malnutrition - An ESPEN consensus statement. Clin Nutr. 2015;34(3):335–340. doi:10.1016/j.clnu.2015.03.001
11. Cascio BL, Logomarsino JV. Evaluating the effectiveness of five screening tools used to identify malnutrition risk in hospitalized elderly: a systematic review. Geriatr Nurs. 2018;39(1):95–102. doi:10.1016/j.gerinurse.2017.07.006
12. Cereda E, Veronese N, Caccialanza R. The final word on nutritional screening and assessment in older persons. Curr Opin Clin Nutr Metab Care. 2018;21(1):24–29. doi:10.1097/MCO.0000000000000431
13. Zhou J, Wang M, Wang H, Chi Q. Comparison of two nutrition assessment tools in surgical elderly inpatients in Northern China. Nutr J. 2015;14:68. doi:10.1186/s12937-015-0054-8
14. Miao JP, Quan XQ, Zhang CT, et al. Comparison of two malnutrition risk screening tools with nutritional biochemical parameters, BMI and length of stay in Chinese geriatric inpatients: a multicenter, cross-sectional study. BMJ Open. 2019;9(2):e022993. doi:10.1136/bmjopen-2018-022993
15. James WP, Ferro-Luzzi A, Waterlow JC. Definition of chronic energy deficiency in adults. Report of a working party of the International Dietary Energy Consultative Group. Eur J Clin Nutr. 1988;42(12):969–981.
16. Hurwitz J. Interpreting laboratory tests in the elderly. Clin Biochem. 1993;26(6):433–434. doi:10.1016/0009-9120(93)80004-E
17. Abd Aziz NAS, Teng NIMF, Abdul Hamid MR, Ismail NH. Assessing the nutritional status of hospitalized elderly. Clin Interv Aging. 2017;12:1615–1625. doi:10.2147/CIA.S140859
18. Reber E, Gomes F, Vasiloglou MF, Schuetz P, Stanga Z. Nutritional risk screening and assessment. J Clin Med. 2019;8(7):E1065. doi:10.3390/jcm8071065
19. Cederholm T, Barazzoni R, Austin P, et al. ESPEN guidelines on definitions and terminology of clinical nutrition. Clin Nutr. 2017;36(1):49–64. doi:10.1016/j.clnu.2016.09.004
20. Baek M, Heo Y. Evaluation of the efficacy of nutritional screening tools to predict malnutrition in the elderly at a geriatric care hospital. Nutr Res Pract. 2015;9(6):637–643. doi:10.4162/nrp.2015.9.6.637
21. Bauer JM, Kaiser MJ, Sieber CC. Evaluation of nutritional status in older persons: nutritional screening and assessment. Curr Opin Clin Nutr Metab Care. 2010;13(1):8–13. doi:10.1097/MCO.0b013e32833320e3
22. Abd-El-Gawad WM, Abou-Hashem RM, El Maraghy MO, Amin GE. The validity of geriatric nutrition risk index: simple tool for prediction of nutritional-related complication of hospitalized elderly patients. Comparison with mini nutritional assessment. Clin Nutr. 2014;33(6):1108–1116. doi:10.1016/j.clnu.2013.12.005
23. Drescher T, Singler K, Ulrich A, et al. Comparison of two malnutrition risk screening methods (MNA and NRS 2002) and their association with markers of protein malnutrition in geriatric hospitalized patients. Eur J Clin Nutr. 2010;64(8):887–983. doi:10.1038/ejcn.2010.64
24. Wu ML, Courtney MD, Shortridge-Baggett LM, Finlayson K, Isenring EA. Validity of the malnutrition screening tool for older adults at high risk of hospital readmission. J Gerontol Nurs. 2012;38(6):38–45. doi:10.3928/00989134-20120509-03
25. Cereda E, Pedrolli C. The geriatric nutritional risk index. Curr Opin Clin Nutr Metab Care. 2009;12(1):1–7. doi:10.1097/MCO.0b013e3283186f59
26. Holst M, Yifter-Lindgren E, Surowiak M, et al. Nutritional screening and risk factors in elderly hospitalized patients: association to clinical outcome? Scand J Caring Sci. 2013;27(4):953–961. doi:10.1111/scs.2013.27.issue-4
27. Donini LM, Poggiogalle E, Molfino A, et al. Mini-nutritional assessment, malnutrition universal screening tool, and nutrition risk screening tool for the nutritional evaluation of older nursing home residents. J Am Med Dir Assoc. 2016;17(10):
28. Raslan M, Gonzalez MC, Dias MC, et al. Comparison of nutritional risk screening tools for predicting clinical outcomes in hospitalized patients. Nutrition. 2010;26(7–8):721–726. doi:10.1016/j.nut.2009.07.010
 © 2020 The Author(s). This work is published and licensed by Dove Medical Press Limited. The
full terms of this license are available at https://www.dovepress.com/terms
and incorporate the Creative Commons Attribution
- Non Commercial (unported, 3.0) License.
By accessing the work you hereby accept the Terms. Non-commercial uses of the work are permitted
without any further permission from Dove Medical Press Limited, provided the work is properly
attributed. For permission for commercial use of this work, please see paragraphs 4.2 and 5 of our Terms.
© 2020 The Author(s). This work is published and licensed by Dove Medical Press Limited. The
full terms of this license are available at https://www.dovepress.com/terms
and incorporate the Creative Commons Attribution
- Non Commercial (unported, 3.0) License.
By accessing the work you hereby accept the Terms. Non-commercial uses of the work are permitted
without any further permission from Dove Medical Press Limited, provided the work is properly
attributed. For permission for commercial use of this work, please see paragraphs 4.2 and 5 of our Terms.