Back to Journals » Medical Devices: Evidence and Research » Volume 13
Prediction of Left Ventricular Mass Index Using Electrocardiography in Essential Hypertension – A Multiple Linear Regression Model
Authors Ahmed SN ![]() , Jhaj R
, Jhaj R ![]() , Sadasivam B
, Sadasivam B ![]() , Joshi R
, Joshi R
Received 15 March 2020
Accepted for publication 15 May 2020
Published 11 June 2020 Volume 2020:13 Pages 163—172
DOI https://doi.org/10.2147/MDER.S253792
Checked for plagiarism Yes
Review by Single anonymous peer review
Peer reviewer comments 2
Editor who approved publication: Dr Scott Fraser
Shah Newaz Ahmed,1 Ratinder Jhaj,1 Balakrishnan Sadasivam,1 Rajnish Joshi2
1Department of Pharmacology, All India Institute of Medical Sciences Bhopal, Bhopal, Madhya Pradesh, India; 2Department of General Medicine, All India Institute of Medical Sciences Bhopal, Bhopal, Madhya Pradesh, India
Correspondence: Shah Newaz Ahmed
Department of Pharmacology, All India Institute of Medical Sciences Bhopal, Bhopal, Madhya Pradesh, India
, Tel +9903857789
Email [email protected]
Background: Current electrocardiography (ECG) criteria indicate only the presence or absence of left ventricular hypertrophy (LVH). LVH is a continuum and a direct relationship exists between left ventricular mass (LVM) and cardiovascular event rate. We developed a mathematical model predictive of LVM index (LVMI) using ECG and non-ECG variables by correlating them with echocardiography determined LVMI.
Patients and Methods: The model was developed in a cohort of patients on treatment for essential hypertension (BP> 140/90 mm of Hg) who underwent concurrent ECG and echocardiography. One hundred and forty-seven subjects were included in the study (56.38± 11.84 years, 66% males). LVMI was determined by echocardiography (113.76± 33.06 gm/m2). A set of ECG and non-ECG variables were correlated with LVMI for inclusion in the multiple linear regression model. The model was checked for multicollinearity, normality and homogeneity of variances.
Results: The final regression equation formulated with the help of unstandardized coefficients and constant was LVMI=18.494+ 1.704 (aLL) + 0.969 (RaVL+SV3) + 0.295 (MBP) + 15.406 (IHD) (aLL – sum of deflections in augmented limb leads; RaVL+SV3 – sum of deflection of (R wave in aVL + S wave in V3); MBP – mean blood pressure; IHD=1 for the presence of the disease, IHD=0 for the absence of the disease).
Conclusion: In the model, 50.4% of the variability in LV mass is explained by the variables used. The findings warrant further studies for the development of better and validated models that can be incorporated in microprocessor-based ECG devices. The determination of LVMI with ECG only will be a cost-effective and readily accessible tool in patient care.
Keywords: left ventricular hypertrophy, electrocardiography, echocardiography
Introduction
Electrocardiography (ECG) is employed in a clinical setting to detect the presence or absence of left ventricular hypertrophy (LVH) using predefined criteria. Commonly used ECG criteria fail to adequately screen for LVH missing more than 70% cases. Sokolow-Lyon criteria have sensitivity and specificity of 5% and 97%, respectively.1 Cornell voltage criteria show better sensitivity (24%) but worse specificity (65%).2 Dichotomous categorisation of LVH using ECG does not provide any information about the degree of LVH. On the other hand, echocardiographic determination of left ventricular mass (LVM) is an anatomically validated tool that reliably calculates left ventricular (LV) mass in units of gram. Since echocardiography is not readily available in many settings, the prediction of LV mass with the help of electrocardiography is of great clinical utility.
While numerous ECG criteria for detecting LV hypertrophy are in use,1,2 studies on the predictive model for LV mass using ECG are very few. Crow et al conducted a study in 1995 on patients with mild hypertension and correlated various ECG parameters with echocardiographic LV mass. They observed that the correlations between ECG parameters and echocardiographic LV mass index varied widely (−0.12 to 0.43). When systolic blood pressure and body mass index were introduced as predictors in their regression model, the correlation improved significantly. Therefore, the researchers suggested combining ECG variables with other non-ECG variables or non-invasive measurements for improving ECG predictivity for LV mass.3 A year later (in 1996), Vries et al published a multiple linear regression model to determine LV mass using both ECG and non-ECG variables. The proportion of explained variability in the model was 45% (r = 0.67).4 The gap in total explained variability is such models warrants further exploration and research. In our study, we developed a multiple linear regression (MLR) model, predictive of the left ventricular mass index using a set of ECG and non-ECG criteria.
Patients and Methods
Study Subjects
All participants in the study were patients of uncontrolled essential hypertension. The inclusion criteria for the study were 1. Age between 35 and 85 years 2. Blood pressure >140/90 mm of Hg 3. Concentric left ventricular hypertrophy (LVMI>115 g/m2 in men and>95 g/m2 in women). The exclusion criteria were 1. Chronic kidney disease (GFR < 60mL/min/1.73 m2); 2. Pregnancy and women in childbearing age group, not on contraceptives; 3. Congestive cardiac failure NYHA class II–IV; 4. Valvular heart disease, cardiac arrhythmia, 2nd or 3rd degree heart block, sick sinus syndrome; 5. Post-myocardial infarction with regional wall motion abnormality or Ejection Fraction <50%; 6. Known bilateral renal artery stenosis; 7. Secondary hypertension; 8. Chronic liver disease (AST/ALT values>3 times the upper limit of normal). The study was approved by the Institutional Human Ethics Committee (IHEC), All India Institute of Medical Sciences, Bhopal vide approval letter no. IHEC-LOP/2017/MD001 dated 13 October 2017.
Sample Size
The data for the linear regression model were obtained from a larger study conducted to compare the efficacy of anti-hypertensive regimens. The patients (n=156) who underwent concurrent electrocardiography and echocardiographic examination were included in the analysis. Nine outlier data that were influencing the fit of the model were excluded. The power of the study was determined post-hoc. Using a one-tailed alpha=0.05, a sample size of 147 and R2 =0.53 (Coefficient of determination), the power of the study was found to be 99% to detect statistically significant correlation (P<0.05) between the dependent variable and the predictors.
Determination of Left Ventricular Mass Index (LVMI) Using Echocardiography
The measurements of the left ventricle were made in the parasternal long-axis view. The direction of the ultrasound beam was kept perpendicular to the long axis of the left ventricle. Oblique sections overestimate ventricular dimensions and therefore, meticulously minimised. A standard protocol of taking the measurements at or immediately below the tip of mitral valve leaflets was adopted. All measurements were taken either in 2D linear or M mode. The measurements of the posterior (PWT) and septal wall thickness (IVST) and left ventricular end-diastolic (LVID) and end-systolic diameters were undertaken according to the recommendations of the American Society of Echocardiography (ASE). The formula used for determination of LVM was:
LVM=0.8 [1.05 (LVID+IVST+PWT)3 – (LVID)3] +0.65
LVMI=LVM/Body surface area
Body surface area= 0.007184 x W0.425 x H0.725.6
(W= Weight, H= Height)
As per the latest American Society of Echocardiography (ASE) guidelines, for designating a case as Echocardiography detected LVH, left ventricular mass index (LVMI) should be more than 115 g/m2 and 95 g/m2 for men and women, respectively. Alternatively, Interventricular Septal wall thickness (IVST) should be more than 1.0 cm and 0.9 cm in men and women, respectively.7
Model Development
The MLR model was developed using SPSS version 22.0. The dependent variable in the model was echocardiography determined LVMI. A set of independent variables (both categorical and continuous) were selected and tested for inclusion in the model. Outliers were identified and removed before testing of variables for significance. A step by step approach towards the development of the model is described under the following headings.
Selection of Variables
A relevant set of ECG and non-ECG variables were identified for presumed inclusion in the model.
The choice of ECG variables is based on the assumption that the electrical deflections of QRS complexes in ECG leads are dependent on ventricular mass (predominantly on the left ventricle due to larger size). Considering the inter-individual variation in the anatomical position of the heart, it is hypothesized that the sum of the deflections in the limb leads, augmented limb leads and precordial leads will be representative of voltage change in the oblique, central and transverse position of the heart, respectively.8 For simplicity, we decided to separately test the three explanatory variables – sum of the deflections in the (i) limb leads, (ii) augmented limb leads and (iii) precordial leads. We introduced a fourth explanatory variable – the sum-total of deflections of all the leads taken together. It is assumed that the most correlated variable representative of the voltage change (and hence the cardiac mass) will depend on the proportion of the different types of the anatomical position of the heart in the study sample.9 Since echocardiography cannot differentiate this variation in cardiac topography, we decided to test all the four variables in multiple linear regression analysis and introduced the most appropriate variables in the best fit model. All the deflections were measured in terms of small square divisions in the ECG paper. One small square division is 1 mm in length and corresponds to 0.1 mV. In addition, Sokolow-Lyon and Cornell voltage criteria were also tested. All ECG parameters included for screening were continuous scale variables.
Non-ECG continuous variables included for analysis were age, weight, body mass index, body surface area, duration of hypertension, systolic blood pressure, diastolic blood pressure, mean blood pressure and pulse rate. Non-ECG categorical variables analysed were gender, dyslipidaemia, presence of diabetes and presence of ischemic heart disease.
Testing of Variables
Bivariate correlation between LV mass (dependent variable) and the independent variables was determined using Pearson correlation coefficient. The dichotomous independent variables were tested by recoding into “0” and “1”. For example, gender was recoded into “1” for male and “0” for female. A two-tailed p value of <0.05 was considered statistically significant.
Feeding Variables into Model (Model Building)
The significant variables obtained through bivariate correlation were tested for inclusion in an MLR model by the stepwise forward selection method. In this method, the correlates are added sequentially in decreasing order of the strength of correlation. The model is assessed for improvement in explained variability and significance of variables after each addition.
Removing Variables from Model (Model Trimming)
A variable is removed from the model if the significance level falls below a predefined critical value during each step of the stepwise forward selection method. We kept the cut off probability for removing a variable from our model at >0.05. A variable is also removed if there is redundancy due to multicollinearity between variables. In our MLR model, a variable was discarded if the value of Variance Inflation Factor (VIF) was found to be more than 2.5.
Creation of Best Fit Model
The final multiple linear regression model was developed using the significant independent variables that were retained after the entry and elimination step. The model was checked for normality and homogeneity of variances. The model was re-run with significant predictors only. R2 value was obtained which denotes the total variation in the dependent variable explained by the independent variables in the best fit model. The final regression equation was formulated with the help of unstandardized coefficients and constant.
Model Cross-Validation
The model was tested for Goodness of Fit by cross-validation using two methods – the simple Hold-out method and the iterative Leave-one-out method.
We split our sample population into two consecutive sets – a training cohort (the initial 2/3rd, n=98) and a validation cohort (the later 1/3rd, n=49). A best fit MLR model was developed in the training cohort with the significant predictors. The regression equation of the best fit model of the training cohort was used to predict the dependent variable in the validation cohort. The strength of correlation between observed and predicted data in the validation cohort was used to judge the validity of the model. The margin of error and 95% confidence interval for the slope of the regression line were also calculated. A P-value of less than 0.05 was considered statistically significant.
In this method, every single observation was assigned a predicted value using the best-fit model based on all but the said observation. The strength of correlation between the observed and predicted values in the whole cohort (n=147) was used to judge the validity of the model. The margin of error and 95% confidence interval for the slope of the regression line were also calculated. A P-value of less than 0.05 was considered statistically significant.
Results
One hundred and forty-seven subjects were included in the study (97 men and 50 women) after removing outliers that were influencing the fit of the model. The mean value of left ventricular mass index (LVMI), the dependent variable, was 113.76 gm/m2 with a standard deviation of 33.06 gm/m2.
Tables
The summary statistics of the explanatory variables and their correlation with LVMI are tabulated under three headings – 1) non-ECG continuous (Table 1), 2) non-ECG categorical (Table 2), 3) ECG continuous (Table 3). Continuous variables were expressed as mean and standard deviation and categorical variables were expressed as counts and percentages.
 |
Table 1 Non-ECG Continuous Variables Tested for Inclusion in the Predictive Model for Left Ventricular Mass Index (LVMI) |
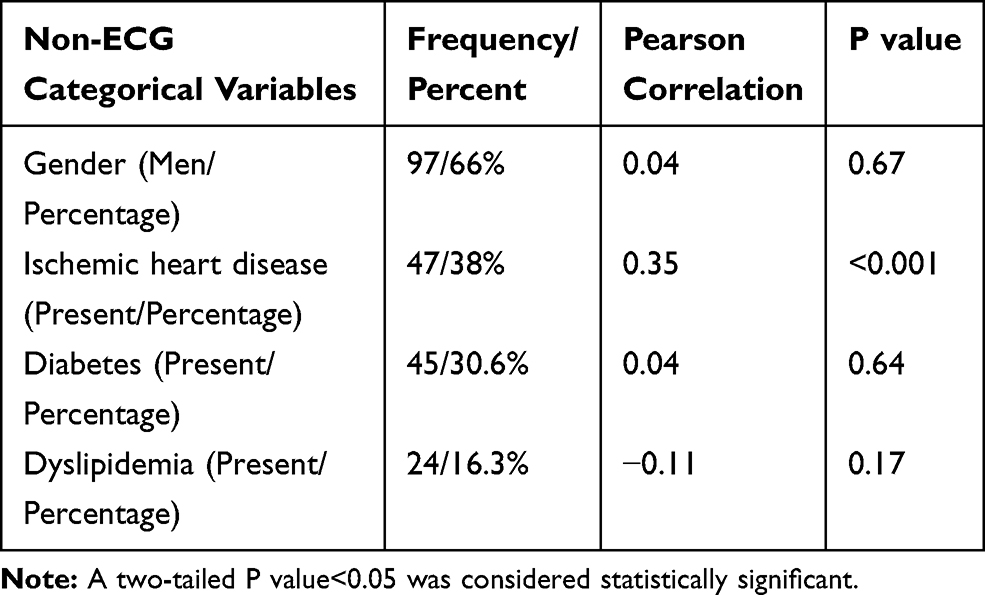 |
Table 2 Non-ECG Categorical Variables Tested for Inclusion in the Predictive Model for Left Ventricular Mass Index (LVMI) |
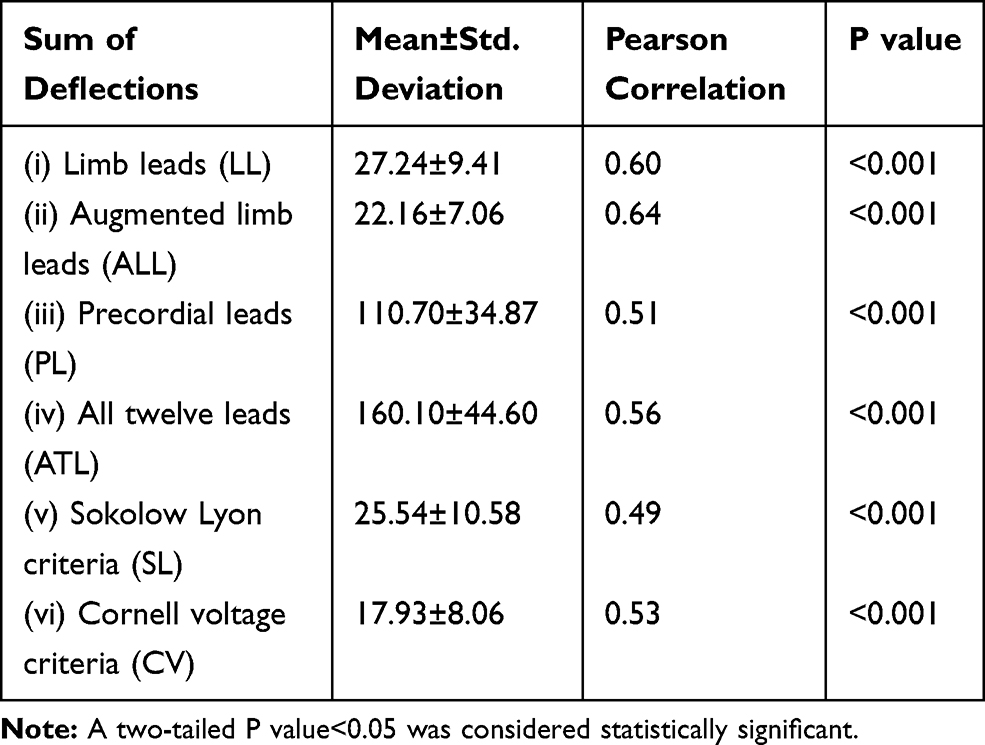 |
Table 3 ECG Continuous Variables Tested for Inclusion in the Predictive Model for Left Ventricular Mass Index (LVMI) |
Non-ECG Continuous Variables
The non-ECG continuous variables found to be significantly correlated were body weight (r= −0.22), body surface area (r = −0.20), systolic blood pressure (r =0.28), diastolic blood pressure (r =0.26) and mean blood pressure (r =0.32). Body weight and body surface area were not included in the multiple linear regression model because the dependent variable LVMI was already adjusted for body weight and body surface area. To avoid redundancy, mean blood pressure (MBP) was the only blood pressure variable included in the final model as it was maximally correlated with LVMI Other continuous variables – age (r =0.03), pulse rate (r = −0.08) and duration of hypertension (r = −0.001) were not found to have a significant correlation with LVMI.
Non-ECG Categorical Variables
The only non-ECG categorical variable found to be significantly related to LVMI was the presence of ischemic heart disease (IHD) (r =0.35). Other categorical variables – gender distribution (r =0.04), presence of diabetes (r =0.04) and presence of dyslipidaemia (r = −0.11) were not found to have a significant correlation with the dependent variable.
ECG Variables
All the six ECG variables tested showed a significant correlation with LVMI and were included for analysis in the multiple linear regression model (Table 3).
Retained and Removed Variables
The variables were retained or removed by the stepwise forward selection method as shown in Table 4. The non-ECG continuous and categorical variables retained were MBP and IHD, respectively. The ECG variables retained were Augmented limb leads and Cornell voltage (Figure 1). Being the only non-ECG continuous variable, MBP (P=0.07, R2 change=0.012) was retained as an exceptional variable.
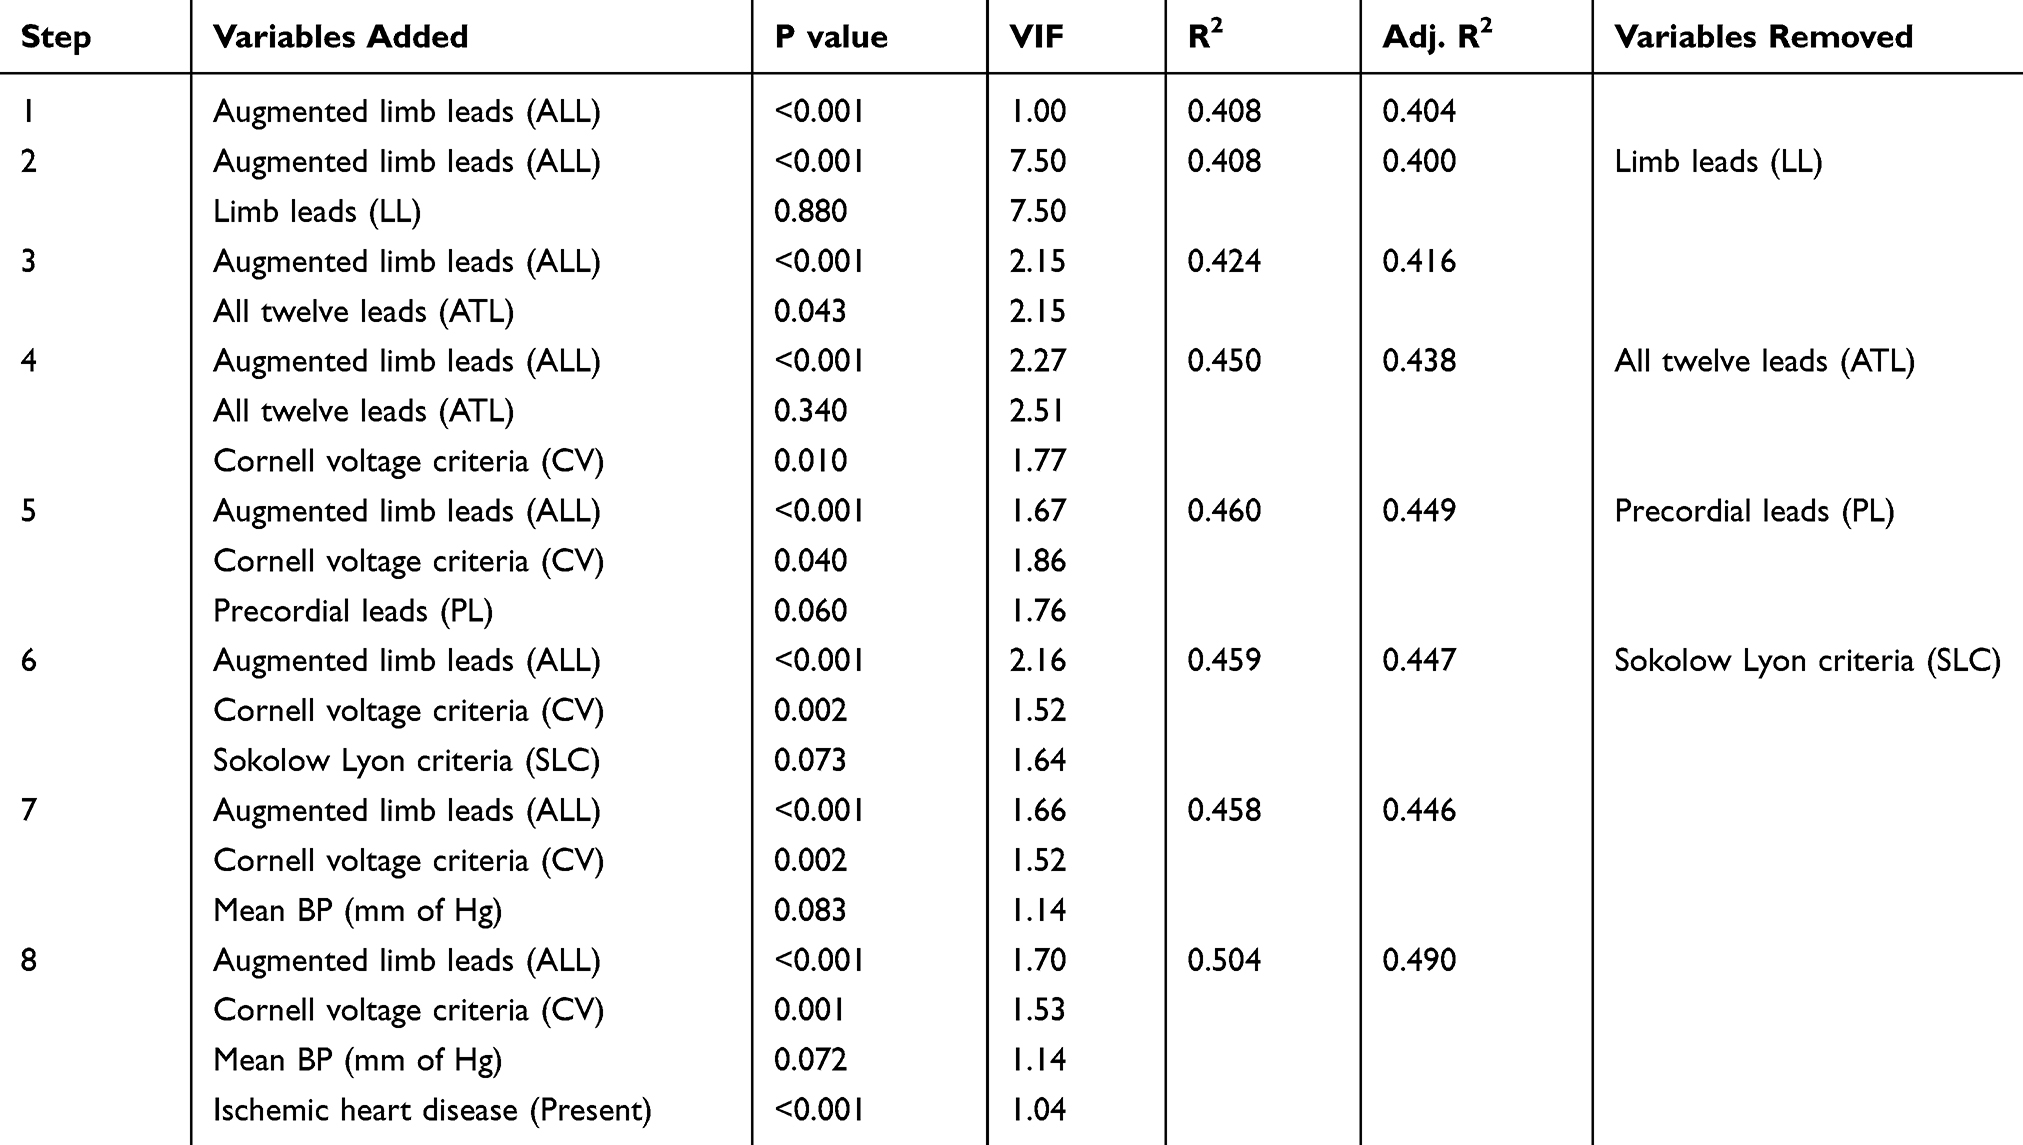 |
Table 4 Stepwise Forward Selection Method for Construction of Multiple Linear Regression Model Predictive of LVMI |
 |
Figure 1 Scatter plots of ECG variables against the dependent variable (LVMI). (A) Sum total of deflections in augmented limb leads (ALL) (R=0.64). (B) Sum of deflection of R wave in aVL and S wave in V3, Cornell Voltage(CV) (R=0.53). Abbreviation: LVMI, left ventricular mass index. |
Best Fit Model
The model was re-run with retained significant variables (Table 5). The proportion of explained variability (R2) was 50.4%. There was a significant improvement in adjusted R2 with the addition of each variable. Multicollinearity was eliminated. The residuals were normally distributed (Figure 2). The values of the standardized residual values indicated that no outliers and influential cases were present in the data set. Finally, using the unstandardized coefficients and the value of the constant obtained from the results of the best fit model, the regression equation to predict LVMI was conceived.
 |
Table 5 Best Fit Model for LVMI with Retained Significant Predictors |
 |
Figure 2 (A) Histogram of standardised residuals indicating normal distribution. All residuals are lying within the limit of 3 SDs. (B) Scatter plot of standardised residuals against standard predicted values. The dots are uniformly distributed on either side of the horizontal line at the level of standardised residual=0. The plot shows homogeneity of variance at different standardised predicted values. |
LVMI=18.494 + 1.704 (aLL) + 0.969 (RaVL+SV3) + 0.295 (MBP) + 15.406 (IHD)
(aLL – sum of deflections in augmented limb leads; RaVL+SV3 – sum of deflection of (R wave in aVL + S wave in V3); MBP – mean blood pressure; IHD=1 for the presence of the disease, IHD=0 for the absence of the disease)
Cross-Validation
Hold-Out Method
The mean LVMI in the training cohort was 115.93 ±35.62 gm/m2. The mean observed and predicted LVMI in the validation cohort was 109.42±27.03 and 115.24±27.91 gm/m2 respectively. There was a strong correlation between predicted and observed values of LVMI in the validation cohort (R=0.69, P<0.001) (Figure 3A). The slope of the regression line (unstandardized coefficient) was 0.708 (95% confidence interval: 0.487–0.928, P<0.001) with a margin of error of 21.6%.
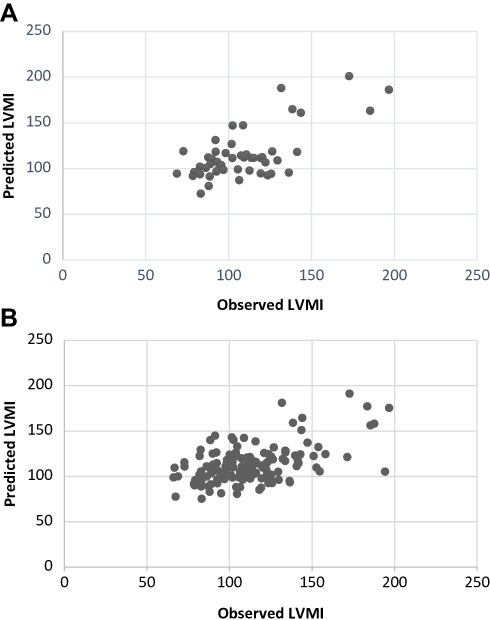 |
Figure 3 (A) Scatter plot of predicted against the observed values of LVMI in the hold-out validation method (R=0.69). (B) Scatter plot of predicted against the observed values of LVMI in the leave-one-out validation method (R=0.62). Abbreviation: LVMI, left ventricular mass index. |
Leave-One-Out Method
The mean LVMI was 113.76 ±33.06 and 113.40±21.70 gm/m2 in the original cohort and leave-one-out set, respectively. There was a strong correlation between predicted and observed values of LVMI in the two sets (R=0.62, P<0.001) (Figure 3B).The slope of the regression line (unstandardized coefficient) was 0.405 (95% confidence interval: 0.321–0.490, P<0.001) with a margin of error of 8.4%.
Discussion
The objective of the MLR method is to simultaneously incorporate the optimum number of explanatory variables in a predictive model and derive the maximum explained variability for the dependent variable. The MLR model eliminates redundant variables and pools the contribution of individual predictors into a single effect. Validated models with a low proportion of error can serve as ready-made tools in risk assessment, establishing diagnoses or judging response to therapy. In our work, we developed an MLR model for the prediction of LVMI (measured in gm/m2) in hypertensive LVH. Though recent work in this field are few, we present a comparative assessment of existing literature vis-a-vis our own work.
In as early as 1991, Wolf et al had developed a model on ECG criteria only. Although there was significant variability in patient characteristics, it was a pioneering work and opened avenues for further research. They developed separate models for men (n=203) and women (n=252) using ECG criteria in a variegated sample comprising normal subjects, patients of valvular heart disease, coronary artery disease, hypertension and others (R2 = 0.18–0.68). The researchers observed that for a given number of independent variables, the multiple correlation was always slightly higher with LVMI than the LV mass. We observed the same phenomenon while developing our model. LVMI is also a clinically more meaningful and precise measure of LV hypertrophy. Therefore, we also developed our regression model with LVMI as the outcome of interest. The R2 value in our study was 0.504. In their hypertensive sub-cohort (n=17; 10 men and 7 women), the R2 for men and women was 0.34 and 0.54, respectively. Unlike our study, the predictors were R (aVL), T (V), and S (V) for men and R (aVL), T (V), and S (I) for women.10 These predictors were found to be weaker correlates in our study and could not be included in our model.
In our study, the presenting mean blood pressure was the most important measurable clinical correlate of LVMI (R=0.3, p<0.001). Recently, in 2014, Varis et al reported a correlation between systolic blood pressure and cardiac mass (R=0.4–0.6) involving both normotensive (n=252) and hypertensive (n=275) subjects. Using two non-ECG variables – Body Mass Index and systolic BP (SBP) and one ECG predictor-Cornell voltage/Cornell product, the researchers developed models that could explain 33% to 41% of the variability in LVMI.11 In an otherwise old literature (Glasser and Koehn 1989), however, the authors did not find any significant correlation between SBP/MBP (R=0.03/0.00). Instead, a high correlation with the variability of blood pressure was seen (R=0.56).12 In a similar study (n=317), Hammond et al found that the correlation of SBP and DBP with hypertensive LVH was 0.22 (P<0.001) and 0.17 (P<0.05), respectively.13 Although the degree and duration of high blood pressure that induces development of LVH is not known, these studies (including our present study) show that high blood pressure may be an important determinant of echocardiography detected cardiac enlargement. Conversely, blood pressure reduction brings significant regression of LVH in as less as 24 weeks regardless of the duration of hypertension and previous therapy.14 This indicates that the progression and regression of LVH may be more dynamic than anticipated. Another clinical characteristic, the presence of ischemic heart disease (IHD), was observed as an important predictor variable in our study. Considering the presence or absence of IHD as a dichotomous variable, a significant correlation was observed (R= 0.33, P <0.001). LVMI was higher in patients who had IHD by a mean value of 15.406. We could not identify any other study using ischemic heart disease as an explanatory variable in the predictive model of LVMI.
The ECG variables which explained the maximum variability in LVMI without redundancy in our best fit model were the sum of deflections in augmented limb leads and Cornell voltage. The sum of deflections in augmented limb leads has the maximum correlation coefficient (R=0.64) and independently explained 41% of the variability in LVMI. The sum of deflections corresponding to Cornell voltage criteria was also high (R=0.53). Collectively, the two ECG variables in our model explained 44.6% of the variance in LVMI. Laszlo et al (2016) and Varis et al (2014) reported a correlation coefficient between Cornell voltage and left ventricular mass or its indices as 0.68 and 0.44, respectively. The study by Laszlo et al was a part of a large population-based observational study (ActiFE-Ulm study) which recruited 432 subjects from the original cohort to study ECG-Echo correlation. The majority of the patients were hypertensive (70%) with or without comorbidities (coronary artery disease – 19%, diabetes – 15%, dyslipidaemia – 33%).15 In contemporary literature, Cornell voltage and product are very frequently used ECG predictors of LV mass (R=0.438–0.443, Xie et al, R=0.15–0.17, Zhang et al, R=0.439–0.427, Varis et al, R=0.68, Laszlo et al). Xie et al (2010) studied 546 consecutive hypertensive patients and found the correlation coefficient for Cornell voltage in men (BMI<24), men (BMI>24), women (BMI<24) and women (BMI>24) was 0.265, 0.446, 0.375, and 0.385, respectively.16
Model by Vries et al in 1996 was the first successful attempt to develop a predictive model for left ventricular mass using both ECG and non-ECG criteria. Using multiple regression analysis, the representative equation to predict left ventricular mass was formulated:
LV mass (g) = ~137.5–13.1*SEX + 1.1*AGE+ 101.4*BSA + 0.43*PVldur + 28.7*SV1 + 26.5*SV4,
where SEX = gender (0 = male, 1 = female); AGE = age (years); BSA = body surface area (m2); PV1dur = duration of the terminal part of the P-wave in V1 (milliseconds): and SV1 and SV4= S-voltages (mV) in the corresponding precordial leads V1 and V4 (R2 = 0.45, mean squared residual = 1020). Statistical significance levels of the β coefficients: SEX (P = 0.034), AGE (P = 0.000), BSA (P = 0.000), PV1dur (P <0.009). SV1 (D <0.001) and SV4 (p = <0.001). The researchers opined
Where the above model explains 45% of the variance, a model with only sex, age and BSA as independent variables explains 31%, indicating that an additional 14% of the variance is explained by the ECG variables. We found no evidence for collinearity problems in our model, with all variance inflation factor values <2.
Post hoc, the authors validated the model in a validation sample (n=92) and found a relatively high correlation between the predicted and the observed LV mass, r = 0.65, corresponding to 42% of the explained variance.4 Our study was cross-validated by two methods. The correlation between the predicted and the observed LV mass was 0.69 and 0.62 by hold-out and leave-one-out method, respectively.
Varis et al, in a community-based study in 2014, involving a population sample (n=252) and a hypertension sample (n= 275) in middle age group subjects, developed gender-specific models based on BMI, systolic blood pressure, Cornell voltage and Cornell product. There was no significant difference in the various models based on Cornell voltage and Cornell product. The researchers observed a greater correlation with Cornell product (although the difference was not significant statistically). In our study, both Cornell voltage and Cornell product were significant predictors. However, we did not include Cornell product in our best fit model to avoid multicollinearity and greater significance of Cornell voltage. The three determinants in the study by Varis et al explained 46–48% (47–49%) of the variation in LVMI among men and 50–54% (52–57%) among women.11
In our model, we had combined a set of ECG and non-ECG criteria to increase the predictability of the outcome variable. We found a significant correlation with two non-ECG variables – Mean blood pressure and presence or absence of ischemic heart disease. While high blood pressure as an etiological factor associated with LVH is established beyond doubt, few studies have shown its usefulness as an explanatory variable for calculation of left ventricular mass. Crow et al observed in their study that the use of non-ECG parameters like systolic blood pressure and body mass index consistently improved LV mass predictability.3 Earlier, Glasser and Koehn had developed a regression model for LVMI based on non-ECG criteria only. The equation for calculating LVMI was formulated as LVMI=93.85+6.91 (1 SD of blood pressure) −3.09 duration of hypertension.12 In our study, we had included both old and new cases of hypertension in the age group of 35 to 85 years of age. We did not find a significant correlation based on gender and therefore conceived a single model for both the sexes. Instead, the dichotomous variable of presence or absence of ischemic heart disease was found to be a significant predictor in our model. Although the association of ischemic heart disease with left ventricular hypertrophy has been shown in previous studies (Eskerud et al),17 the incorporation of this variable in the predictive model of LVMI is a novel concept. Eventually, the best fit model which was developed with all the significant regressors was able to explain 50.4% of the variability in LVMI irrespective of gender, age, weight, body mass index, presence of diabetes, presence of dyslipidaemia and duration of hypertension.
In the clinical scenario, more than 36 ECG criteria are in vogue to judge the presence or absence of LVH.18 ECG criteria are obscure in terms of quantifying the magnitude of an increase in LV mass. Most of them have low sensitivity and high specificity which means that a large part of the population at risk will not be identified.19 This has tremendous clinical significance because a direct and progressive relationship exists between left ventricular mass in grams and the rate of cardiovascular events.20 Since the imaging method to measure LV mass is both cost and skill dependent, algorithm based on mathematical modelling incorporated in ECG units can serve as a viable alternative. Though our single centre cross-validated model is not robust enough for use as a tool in clinical practice, our work justifies the need for further research in the field. Existing know-how on this potential technology is scarce and we need more research to shape an error-free and robust model that can be applied universally.
Limitations
Our study was a single centre study with a relatively small sample size. We recorded office BP only in our study. Office BP readings reflect only an instantaneous picture of a patient’s true BP and provide no idea about the diurnal variation in BP. Recent research have shown that ambulatory blood pressure is better than office BP in diagnosis and monitoring of hypertension.21 The use of ambulatory blood pressure in our study would have provided more realistic results but could not be done due to limitation of cost and resources.
Echocardiography is the standard clinical method for the estimation of left ventricular mass. Though the inter-observer and intra-observer variabilities are not clinically significant, the correlation between echocardiography determined LV mass and post-mortem measurement (Gold standard) showed that echocardiography explains 85% of the variance.4 Cardiac magnetic resonance imaging provides better resolution and quantification of LV mass, but low cost, real-time imaging and prompt interpretation make echocardiography popular in clinical practice. In studies where regression of LV mass is the primary outcome, magnetic resonance imaging should be the preferred imaging modality.22 The proportion of error due to errors in measurement of LV mass in echocardiography method, lies undetermined in our study.
Conclusion
In our study, we have developed a multiple linear regression model to predict left ventricular mass index from a set of ECG and non-ECG variables. We used predefined ECG criteria (as continuous independent variables), mean blood pressure (as continuous non-ECG independent variable) and presence of ischemic heart disease (as dichotomous non-ECG independent variable). A r value of 0.701 was obtained which indicates that 50.4% of the variability in LV mass is explained by the variables used in the model.
Ethical Approval
All procedures performed in studies involving human participants were in accordance with the ethical standards of the institutional and/or national research committee and with the 1964 Helsinki declaration and its later amendments or comparable ethical standards.
Informed Consent
Informed consent was obtained from all individual participants included in the study.
Disclosure
The authors report no conflicts of interest in this work.
References
1. Schröder J, Nuding S, Müller-Werdan U, et al. Performance of Sokolow-Lyon index in detection of echocardiographically diagnosed left ventricular hypertrophy in a normal Eastern German population - results of the CARLA study. BMC Cardiovasc Disord. 2015;15(1):69–75. doi:10.1186/s12872-015-0066-5
2. Mahn JJ, Dubey E, Brody A, et al. Test characteristics of electrocardiography for detection of left ventricular hypertrophy in asymptomatic emergency department patients with hypertension. Acad Emerg Med. 2014;21(9):996–1002. doi:10.1111/acem.12462
3. Crow RS, Prineas RJ, Rautaharju P, Hannan P, Liebson PR. Relation between electrocardiography and echocardiography for left ventricular mass in mild systemic hypertension (results from Treatment of Mild Hypertension Study). Am J Cardiol. 1995;75(17):1233–1238. doi:10.1016/S0002-9149(99)80769-3
4. de Vries SO, Heesen WF, Beltman FW, et al. Prediction of the left ventricular mass from the electrocardiogram in systemic hypertension. Am J Cardiol. 1996;77:974–978. doi:10.1016/S0002-9149(96)00032-X
5. Devereux RB, Reichek N. Echocardiographic determination of left ventricular mass in man. Anatomic validation of the method. Circulation. 1977;55:613–618. doi:10.1161/01.CIR.55.4.613
6. Du Bois D, Du Bois EF. A formula to estimate the approximate surface area if height and weight be known. 1916. Nutr Burbank Los Angel Cty Calif. 1989;5:
7. Lang RM, Badano LP, Mor-Avi V, et al. Recommendations for Cardiac Chamber Quantification by Echocardiography in Adults: an Update from the American Society of Echocardiography and the European Association of Cardiovascular Imaging. Eur Heart J – Cardiovasc Imaging. 2015;16:233–271. doi:10.1093/ehjci/jev014
8. Mirjalili SA, Hale SJM, Buckenham T, Wilson B, Stringer MD. A reappraisal of adult thoracic surface anatomy. Clin Anat. 2012;25:827–834. doi:10.1002/ca.22091
9. Keough N, Mirjalili SA, Suleman FE, Lockhat ZI, van Schoor A. The thoracic surface anatomy of adult black South Africans: a reappraisal from CT scans. Clin Anat. 2016;29:1018–1024. doi:10.1002/ca.22776
10. Wolf HK, Burggraf GW, Cuddy E, et al. Prediction of left ventricular mass from the electrocardiogram. J Electrocardiol. 1991;24:121–127. doi:10.1016/0022-0736(91)90003-5
11. Varis JP, Puukka PJ, Karanko HM, Jula AM. Risk assessment of echocardiographic left ventricular hypertrophy with electrocardiography, body mass index and blood pressure. Blood Press. 2014;23:39–46. doi:10.3109/08037051.2013.803313
12. Glasser SP, Koehn DK. Predictors of left ventricular hypertrophy in patients with essential hypertension. Clin Cardiol. 1989;12:129–132. doi:10.1002/clc.4960120303
13. Hammond IW, Devereux RB, Alderman MH, Laragh JH. Relation of blood pressure and body build to left ventricular mass in normotensive and hypertensive employed adults. J Am Coll Cardiol. 1988;12(4):996–1004. doi:10.1016/0735-1097(88)90467-6
14. Gaudio C, Ferri FM, Giovannini M, et al. Comparative effects of irbesartan versus amlodipine on left ventricular mass index in hypertensive patients with left ventricular hypertrophy. J Cardiovasc Pharmacol. 2003;42(5):622–628. doi:10.1097/00005344-200311000-00007
15. Laszlo R, Kunz K, Dallmeier D, et al. ActiFE Study group. Accuracy of ECG indices for diagnosis of left ventricular hypertrophy in people >65 years: results from the ActiFE study. Aging Clin Exp Res. 2017;29:875–884. doi:10.1007/s40520-016-0667-6
16. Xie L, Wang Z. Correlation between echocardiographic left ventricular mass index and electrocardiographic variables used in left ventricular hypertrophy criteria in Chinese hypertensive patients. Hell J Cardiol HJC Hell Kardiologike Epitheorese. 2010;51:391–401.
17. Eskerud I, Gerdts E, Larsen TH, Lønnebakken MT. Left ventricular hypertrophy contributes to Myocardial Ischemia in Non-obstructive Coronary Artery Disease (the MicroCAD study). Int J Cardiol. 2019;286:1–6. doi:10.1016/j.ijcard.2019.03.059
18. Hancock EW, Deal BJ, Mirvis DM, et al.; American Heart Association Electrocardiography and Arrhythmias Committee, Council on Clinical Cardiology, American College of Cardiology Foundation, Heart Rhythm Society. AHA/ACCF/HRS recommendations for the standardization and interpretation of the electrocardiogram: part V: electrocardiogram changes associated with cardiac chamber hypertrophy: a scientific statement from the American Heart Association Electrocardiography and Arrhythmias Committee, Council on Clinical Cardiology; the American College of Cardiology Foundation; and the Heart Rhythm Society. Endorsed by the International Society for Computerized Electrocardiology. J Am Coll Cardiol. 2009;53:992–1002. doi:10.1016/j.jacc.2008.12.015
19. Peguero JG, Lo Presti S, Perez J, Issa O, Brenes JC, Tolentino A. Electrocardiographic criteria for the diagnosis of left ventricular hypertrophy. J Am Coll Cardiol. 2017;69(13):
20. Levy D, Garrison RJ, Savage DD, Kannel WB, Castelli WP. Prognostic implications of echocardiographically determined left ventricular mass in the Framingham Heart Study. N Engl J Med. 1990;322(22):1561–1566. doi:10.1056/NEJM199005313222203
21. Dadlani A, Madan K, Sawhney JPS. Ambulatory blood pressure monitoring in clinical practice. Indian Heart J. 2019;71(1):91–97. doi:10.1016/j.ihj.2018.11.015
22. Agabiti-Rosei E, Muiesan ML, Salvetti M. New approaches to the assessment of left ventricular hypertrophy. Ther Adv Cardiovasc Dis. 2007;1:119–128.
 © 2020 The Author(s). This work is published and licensed by Dove Medical Press Limited. The
full terms of this license are available at https://www.dovepress.com/terms
and incorporate the Creative Commons Attribution
- Non Commercial (unported, 3.0) License.
By accessing the work you hereby accept the Terms. Non-commercial uses of the work are permitted
without any further permission from Dove Medical Press Limited, provided the work is properly
attributed. For permission for commercial use of this work, please see paragraphs 4.2 and 5 of our Terms.
© 2020 The Author(s). This work is published and licensed by Dove Medical Press Limited. The
full terms of this license are available at https://www.dovepress.com/terms
and incorporate the Creative Commons Attribution
- Non Commercial (unported, 3.0) License.
By accessing the work you hereby accept the Terms. Non-commercial uses of the work are permitted
without any further permission from Dove Medical Press Limited, provided the work is properly
attributed. For permission for commercial use of this work, please see paragraphs 4.2 and 5 of our Terms.