Back to Journals » Journal of Asthma and Allergy » Volume 14
Predicting Environmental Allergies from Real World Data Through a Mobile Study Platform
Authors Sarabu C, Steyaert S, Shah NR ![]()
Received 16 November 2020
Accepted for publication 18 February 2021
Published 18 March 2021 Volume 2021:14 Pages 259—264
DOI https://doi.org/10.2147/JAA.S292336
Checked for plagiarism Yes
Review by Single anonymous peer review
Peer reviewer comments 2
Editor who approved publication: Dr Amrita Dosanjh
Chethan Sarabu,1,2 Sandra Steyaert,1 Nirav R Shah1– 3
1Sharecare Inc., Atlanta, GA, USA; 2Stanford Medicine, Palo Alto, CA, USA; 3Clinical Excellence Research Center, Stanford, CA, USA
Correspondence: Chethan Sarabu
Sharecare Inc., 255 East Paces Ferry Road NE, GA, Atlanta, 30305, USA
Tel +1 315-794-2354
Email [email protected]
Introduction
Environmental allergies are extremely disruptive to the daily life of many globally. Nearly 15 million clinic visits, 3.5 million days of missed work, and $24.8 billion in direct costs are incurred annually due to allergic rhinitis in the United States alone.1,2 In treatment protocols, allergen avoidance is the primary clinical recommendation; however, few interventions have been broadly effective.3
If patients and clinicians can better predict the risk of symptom flares, preventative steps can be taken to mitigate downstream consequences. The heterogeneity of triggers and symptom patterns across individuals and geographies, however, has historically precluded collective learning and predictive efforts have been only modestly successful.4,5 Advances in machine learning and smartphone-based data collection can help clarify these relationships and provide personalized actionable intelligence.6
We launched a mobile research platform designed to gather real world subjective symptom data and objective sensor data, linked to select external datasets. Smartphone sensor data including physical activity (steps/day) and geolocation (linked to external ambient pollen data) were collected, and participants logged their allergy symptoms in an e-diary using the app (Figure 1). These data were used to develop and train a machine learning algorithm to predict the emergence and severity of symptoms related to allergic rhinitis.
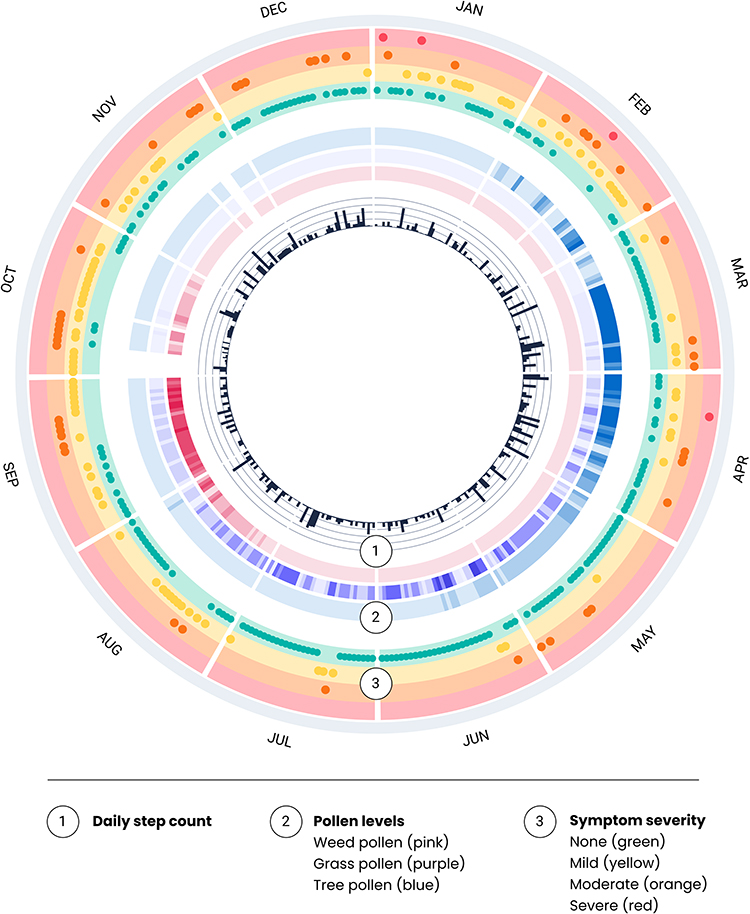 |
Figure 1 Smartphone-based collection allows for much richer data capture. Circular representation of a year of data (October 2018 to September 2019) from a single participant. The inner ring (1) shows daily step count as measured by the smartphone. The middle ring (2) shows the level of types of pollen on a normalized scale in their location for the year. The outer ring (3) quantifies symptom data and highlights the magnitude of longitudinal data that can be captured. |
Results
Participant Demographics
2012 participants were recruited from July to November 2018 across all 50 US states and the District of Columbia. The mean age of participants was 40.6 years (ranging from 18 to 68), and 68% were female. All participants provided their geolocation and physical activity data, and 809 (40.2%) tracked daily allergy symptoms in the app divided into low (n=328), medium (n=264), and high reporters (n=217) based on the number of days symptoms were tracked with a mean of 48.2 and median of 16 tracked days. High reporters tracked at least 50 days, and furthermore, 108 (5.3%) entered at least 100 days of data and 22 (1.1%) submitted data for all 365 days.
Allergic Symptoms and Disease Course
The most commonly reported symptoms in the participant population were “sneezing or runny nose” (27.2%) and ‘watery eyes’ (15.3%); however, only 7.0% and 9.8% of the time were these reported as “severe.” In contrast, “headache” (9.5%) and “fatigue” (7.8%) were less commonly reported but were more often rated as “severe” 13.3% and 15.0% of the time, respectively (p-value <2.2e-16 with regards to severe vs moderate).
While “pollen”, ‘dust mites’, and “cold air” were the most common triggers selected by patients, symptom severity associated with these antigens was modest: 90.3%, 92.8%, and 91.4% of the time, symptoms were not reported as severe. In comparison, when “smoke or air pollution” or “infection (cold/flu)” were selected as suspected triggers, associated symptoms were more frequently severe (18.3% or 23.0% of cases, respectively) (p-value <2.2e-16).
We found that physical activity correlated with the severity of symptoms. A median number of steps/day were statistically significantly lower when symptoms were severe (2853 steps/day) compared to days when there were no symptoms (3927 steps/day), mild symptoms (4089 steps/day) or moderate symptoms reported (4151 steps/day). (p-value = 0.005)
Development of a Machine Learning Model to Predict Allergy Symptom Burden
Using the collected real world data, we built a machine learning model to predict the presence and severity of allergy symptoms (Figure 2). Input samples were randomly shuffled and split into training and test sets at a ratio of 80/20 with stratification. Test samples were left out of all model training steps and only used for final parameter validation. Severity was graded on a scale of “none,” “mild,” “moderate,” and “severe.” There were eight input (independent) variables including month, age, sex, body mass index (BMI), geographical location (based on the American Academy of Asthma, Allergy, and Immunology’s regional definitions),7 and pollen indices for trees, grasses, weeds.
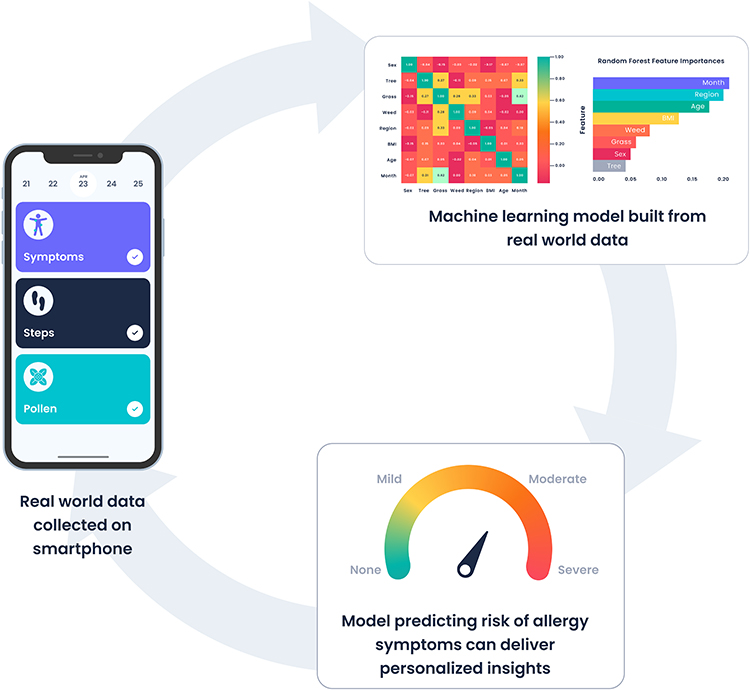 |
Figure 2 Collecting real world data symptom and sensor data on a smartphone which feeds into a machine learning model that can predict individual risk of allergy symptoms. |
Supervised classification methods were implemented to tackle the inherently skewed class distribution: Balanced Bagging, Random Forest with class weighting, Random Forest with bootstrap class weighting, Balanced Random Forest and Easy Ensemble. From these, Random Forest with class weighting was the (close) winner in predicting allergy occurrence with a 5-fold cross-validation balanced accuracy of 0.726 and weighted F1-score of 0.810. The accuracy, balanced accuracy, and weighted F1 score on the test set were 0.816, 0.730 and 0.816, respectively. After hyperparameter fine-tuning, scores only marginally improved: on the test set accuracy and balanced accuracy were 0.801 and 0.733, respectively, the weighted F1-score stayed 0.816.
Discussion
In this study, we collected symptoms and risk factors associated with environmental allergies via a novel mobile platform in order to build a machine learning model that predicts symptom occurrence and severity. The smartphone-based, decentralized data platform provides a proof-of-principle for the feasibility of collecting high fidelity, multimodal real world data in a continuous and individualized way.
The use of these multi-dimensional and patient-centric forms of data in predictive models is less common than the use of standardized health record data. While there have been a few related studies, our model is among the first to quantify, on a daily basis, user-specific allergy risk and severity level primarily based on mobile data. With a performance of 80% on our test data, our model illustrates the promise of mobile data providing improved predictive power in the service of clinical care.
While our study uses only real world patient data, which may be less “objective” than medical record or administrative claims data, the study data have substantiated prior clinical knowledge of environmental allergies. The timing of symptoms is in accordance with what was previously known. In a Finnish study of allergic rhinitis, the morning was clearly the most troublesome time period.7 When participants were asked to select suspected triggers (based on participant understanding but no quantified test results) there was appropriate seasonal variation when symptoms were related to pollen (spring through fall) or cold air (winter). Seasonal variation was (appropriately) not observed when the suspected trigger was pets. Well-designed digital user experiences can facilitate a higher quality of data entry.
Key findings from the models developed in this study add richness and granularity to the clinical understanding of the natural history of environmental allergies. For example, the onset of relatively less common symptoms, such as headache and fatigue, is more highly correlated with severe allergy flares than more common symptoms, such as runny nose or watery eyes. Similarly, the observation that exposure to smoke and/or air pollution can precipitate a more severe disease course—as opposed to pollen or dust—is new clinically relevant information. Such distinctions allow for more individualized care, especially in the wake of rapidly changing environmental conditions. These findings will equip clinicians with the means to better risk-stratify their individual patients and initiate preventive regimens ahead of an imminent and potentially debilitating flare. Over time this model could be integrated into a patient-facing app that provides real-time personalized recommendations with individuals’ data never leaving their phone. Such models could ensure privacy while supporting a federated learning approach (Figure 3).
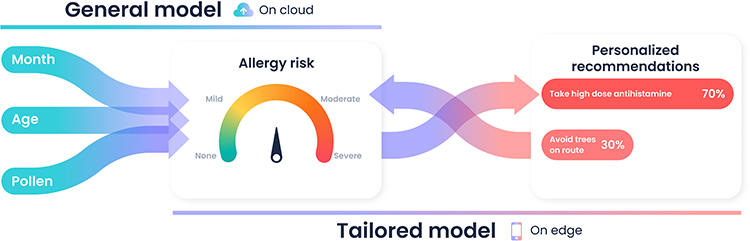 |
Figure 3 Planned future direction shows how risk prediction can be integrated into a tailored model for personalized recommendations. |
There are a range of limitations of our study, starting with the fact that participants discovered the study through social media advertisements and self-enrolled without strict inclusion criteria requiring that they be diagnosed with any allergic condition. Another major limitation was that all suspected triggers were purely based on the patient’s subjective experience and understanding rather than objective tests confirming allergic sensitizations. The objective data that we include were pollen measurements; however, these were limited to the granularity of a city and not at a more fine-grained resolution which might better approximate real world pollen burden. We hope in future studies to incorporate some of these features to build a better personalized allergy prediction model.
Conclusion
Machine learning models in healthcare tend to focus first on clinicians with decision support or administrators with forecasting. To date, less emphasis has been placed on patient-facing care models. When such models are capable of identifying personalized predictors and offer a strategy for tailoring clinical care and prevention, they will be integrated into care delivery. We demonstrate the feasibility of collecting multi-modal real world data through a mobile research platform in order to build a patient-facing predictive model for environmental allergies.
Methods (To Be Included in Online Repository)
Study Design
This study was a mobile-based observational study of individuals’ allergy symptoms and triggers over 1 year, from participants all across the United States. Interested participants who downloaded the research app on their smartphones were asked a series of questions to ensure they met the study’s inclusion criteria: (i) at least 18 years old, (ii) be able to comprehend consent forms in English, (iii) lived in the US for the duration of the study (July 2018–September 2019) and (iv) had and could use a smartphone which supported the research app. There were no exclusions based on race, gender or ethnic background. Participants were recruited via multiple social media channels that coincided with the launch of the research app in August 2018. All study materials including but not limited to the protocol, informed consent, and advertisements were approved by the Salus IRB (Ethics approval ID: DOC-001-2018). This study was conducted in accordance with The Declaration of Helsinki.
Data Collection
Upon successful self-enrollment via a written electronic consent form, participants self-reported their allergy events with the corresponding date and time of day, symptoms, suspected trigger and severity level (mild, moderate, or severe). The questions chosen for allergy symptoms and suspected triggers were created by two clinical experts who reviewed the medical literature on environmental allergy symptoms.
At the beginning and end of the study, participants were prompted to enter/update their location, physical activity, and demographic data. A proprietary neural network via a selfie photo was used to predict participant’s age, sex, height, and weight, followed by a manual correction if needed. Participants entered their location at the granular level of a city, which was a decision that balanced privacy with accuracy. Using the Google® City Application Program Interface (API) the midpoint of the city was identified and then used to collect pollen data at that location from Breezometer®. Participants imported their step count via Apple® HealthKit. All data were recorded directly on the doc.ai app, securely stored on a HIPAA compliant cloud provider.
Data Sharing Statement
The data that support the findings of this study are available from the corresponding author upon request.
Acknowledgments
We would like to acknowledge the following individuals who helped throughout multiple phases of this study: Chirag Patel PhD, Arjun Manrai PhD, Neeraj Kashyap PhD, Rohan Jahagirdar, Hui Tan, Wan Zhu PhD, Larry Meyer PhD, Alan Greene MD, Savita Sinha, Akshay Sharma, Sam De Brouwer, and Walter De Brouwer PhD.
Author Contributions
All authors made substantial contributions to conception and design, acquisition of data, or analysis and interpretation of data; took part in drafting the article or revising it critically for important intellectual content; agreed to submit to the current journal; gave final approval of the version to be published; and agree to be accountable for all aspects of the work.
Disclosure
All three authors (CS, SS, NS) are employees of Sharecare, the company which sponsored this research study and developed the Omix Digital Clinical Research Platform and the doc.ai app where the study was deployed. The authors report no other conflicts of interest in this work.
References
1. Burton WN, Conti DJ, Chen C-Y, Schultz AB, Edington DW. The impact of allergies and allergy treatment on worker productivity. J Occup Environ Med. 2001;43(1):64–71. doi:10.1097/00043764-200101000-00013
2. Mudarri DH. Valuing the economic costs of allergic rhinitis, acute bronchitis, and asthma from exposure to indoor dampness and mold in the US. J Environ Public Health. 2016;2016:1–12. doi:10.1155/2016/2386596
3. Sur DKC, Plesa ML. Treatment of allergic rhinitis. Allerg Rhinitis. 2015;92:8.
4. Bousquet J, Ansotegui IJ, Anto JM, et al. Mobile technology in allergic rhinitis: evolution in management or revolution in health and care? J Allergy Clin Immunol Pract. 2019;7(8):2511–2523. doi:10.1016/j.jaip.2019.07.044
5. Wang D-Y. Risk factors of allergic rhinitis: genetic or environmental? Ther Clin Risk Manag. 2005;1(2):115–123. doi:10.2147/tcrm.1.2.115.62907
6. Steinhubl SR, Wolff-Hughes DL, Nilsen W, Iturriaga E, Califf RM. Digital clinical trials: creating a vision for the future. Npj Digit Med. 2019;2(1):
7. Smolensky M, Reinberg A, Labrecque G. Twenty-four hour pattern in symptom intensity of viral and allergic rhinitis: treatment implications. J Allergy Clin Immunol. 1995;95(5):1084–1096. doi:10.1016/S0091-6749(95)70212-1
 © 2021 The Author(s). This work is published and licensed by Dove Medical Press Limited. The
full terms of this license are available at https://www.dovepress.com/terms
and incorporate the Creative Commons Attribution
- Non Commercial (unported, 3.0) License.
By accessing the work you hereby accept the Terms. Non-commercial uses of the work are permitted
without any further permission from Dove Medical Press Limited, provided the work is properly
attributed. For permission for commercial use of this work, please see paragraphs 4.2 and 5 of our Terms.
© 2021 The Author(s). This work is published and licensed by Dove Medical Press Limited. The
full terms of this license are available at https://www.dovepress.com/terms
and incorporate the Creative Commons Attribution
- Non Commercial (unported, 3.0) License.
By accessing the work you hereby accept the Terms. Non-commercial uses of the work are permitted
without any further permission from Dove Medical Press Limited, provided the work is properly
attributed. For permission for commercial use of this work, please see paragraphs 4.2 and 5 of our Terms.