Back to Journals » Clinical and Experimental Gastroenterology » Volume 12
Potential risk factors for celiac disease in childhood: a case-control epidemiological survey
Authors Bittker SS ![]() , Bell KR
, Bell KR ![]()
Received 26 March 2019
Accepted for publication 8 May 2019
Published 4 July 2019 Volume 2019:12 Pages 303—319
DOI https://doi.org/10.2147/CEG.S210060
Checked for plagiarism Yes
Review by Single anonymous peer review
Peer reviewer comments 2
Editor who approved publication: Professor Wing-Kin Syn
Video abstract presented by Seth Scott Bittker
Views: 666
Seth Scott Bittker,1 Kathleen Roberta Bell2
1Interdisciplinary Center for Innovative Theory and Empirics (INCITE), Columbia University, New York, New York, US; 2Ontario College of Teachers, Toronto, Ontario, Canada
Background: Celiac disease (CD) prevalence has increased significantly in recent decades in some developed countries. Yet the environmental factors in the existing literature do not appear to provide a satisfactory explanation for this increase.
Objective: To determine whether nine variables are associated with CD in children. These variables are: incidence of ear infection before 2 years old, courses of antibiotics before 2 years old, duration of breastfeeding, vitamin D drop exposure in infancy, vitamin D supplement exposure between 2–3 years old, age at gluten introduction into the diet, fat content of cow’s milk consumed between 2–3 years old, quantity of cow’s milk consumed between 2–3 years old, and type of water consumed at 2 years old.
Methods: An Internet-based survey was conducted among parents living in the US with at least one biological child between 3 and 12 years old. Potential participants were informed about the survey through social media, websites, electronic newsletters, and advertisements.
Results: After exclusions, there remained 332 responses associated with children with CD (cases), and 241 responses associated with children who do not have CD (controls). In this data set, skim milk as the primary form of liquid cow’s milk consumed between 2–3 years old (adjusted odds ratio [aOR]=3.556, CI=1.430–10.22, P=0.010), vitamin D drops administered for more than 3 months (aOR=1.749, CI=1.079–2.872, P=0.025), courses of antibiotics (aOR=1.133, CI=1.037–1.244, P=0.007), and incidence of ear infection (aOR=1.183, CI=1.041–1.348, P=0.010) are all associated with CD in children.
Conclusions: This study is the first to find an association between skim milk consumption and CD and vitamin D drop use for greater than 3 months and CD. It also adds to evidence that early life exposure to antibiotics and early life infection, specifically ear infection, are associated with CD.
Keywords: coeliac, milk, vitamin D, antibiotic, ear infection, epidemiology, gluten
Plain language summary
In order to determine whether certain factors are associated with CD, we conducted an Internet-based survey among parents whose children have CD and parents whose children do not have CD. Based on the responses from this survey, we find that skim milk consumption between ages two and three and vitamin D drop exposure for greater than three months are associated with CD. These first two results are novel. In addition, we find associations between antibiotic use before age two and CD and ear infection before age two and CD. Variants of these latter two results appear in the existing literature.
Introduction
Celiac disease (CD) is a chronic small intestine enteropathy induced by exposure to the protein gluten, which is a component of wheat, rye, and barley.1 Both genetic and environmental factors contribute to the risk of CD.2
The prevalence of CD in the US has increased significantly in recent decades, and this increase is not solely due to increased awareness and more efficient diagnosis.3,4 Relatedly, a significant increase in the incidence of CD in Sweden occurred starting in 1984.5 While some research had suggested that variations in incidence of CD could be connected to breastfeeding duration or the timing of gluten introduction into the diet,6–9 these hypotheses have been largely disproven by more recent studies.10–12 This prompted Ludvigsson and Green13 to suggest that there is a “missing environmental factor in celiac disease” that is responsible for the increased incidence.
Thus, a study examining novel potential risk factors for CD could be of great value. Six novel variables are considered in this study. They are: the type and quantity of cow’s milk consumed between the second and third birthdays (2–3 years old), oral vitamin D supplementation in infancy and between 2–3 years old, the type of water consumed at 2 years old, and incidence of ear infection before 2 years old.
Regarding cow’s milk, those with CD have a greater propensity than controls to have an inflammatory reaction to milk protein exposure in the rectal mucosa.14 Such a reaction mimics the effect of gluten on the same tissue.14 Thus, it is reasonable to consider whether there may be a common biological mechanism, and whether consumption of large quantities of cow’s milk early in life may increase the risk of CD. Relatedly, whole milk is 21% protein by calories, while skim milk is 39% protein by calories.15,16 Thus, if the protein in milk is associated with an inflammatory reaction in many of those who are later diagnosed with CD, the fat content of milk consumed may be worthy of examination.
With respect to supplemental vitamin D, CD is an autoimmune disease,17 vitamin D has immunomodulatory effects,18 and some have hypothesized that oral vitamin D supplementation may decrease the risk of autoimmune diseases in general.18 Separately, CD is more prevalent in the northern latitudes of the US.19 Sunlight, which is less prevalent in the northern latitudes, is necessary for vitamin D to be generated in the skin.20 Based on these observations, one might reasonably infer that those who do not receive supplemental oral vitamin D in infancy could be at increased risk of developing CD.
However, in Sweden, CD is more prevalent in the southern latitudes than in the northern latitudes,21 the opposite of the pattern seen in the US. In addition, as one of this study’s authors has highlighted previously, time trends of CD incidence tend to mirror time trends of vitamin D fortification and supplementation.22 For example, the significant increase in incidence of CD in Sweden began in 1984,5 within a year after a program of mandatory vitamin D fortification was instituted in Sweden.23
With respect to the type of water consumed, reverse osmosis (RO) filtration may remove 95% of sulfate from water.24 Sulfated mucins line the healthy human digestive tract.25 Thus, it seems conceivable that reduced availability of sulfate early in life, perhaps caused by drinking RO water or other low sulfate water, could lead to reduced protection for the villi lining the intestine, which may increase the risk of CD.
Some evidence suggests that frequent early life infections are associated with CD.26–28 Ear infections are extremely common in early childhood.29 Thus, it seems plausible that ear infection in early childhood is associated with CD.
Some additional variables that are examined in this study have been investigated in prior studies on CD epidemiology. These include breastfeeding duration,6,10–12 age at gluten introduction,7–12 and early life antibiotic exposure.26,30–32
Methods
Similarity to a previous study
While the medical condition and many of the variables under consideration are different, this survey study is similar in design to an epidemiological survey study that the authors previously conducted on potential postnatal risk factors for autism spectrum disorder.33
Questionnaire
A survey was constructed using Qualtrics software. Participants were to be biological parents of at least one child between the ages of 3 and 12, who was born in and resided in the US. The survey had between 28 and 39 questions, depending on whether the child in question had a gluten sensitivity condition. For the purpose of this study, gluten sensitivity conditions include CD, non-celiac gluten sensitivity (NCGS), and wheat allergy. Each participant with a child with one of these conditions was asked questions regarding the participant’s youngest child with CD, NCGS, or wheat allergy. Each participant whose children did not have any of these conditions was asked questions regarding the participant’s youngest child between 3 and 12 years old.
Most questions on exposures were focused on the first 2 years of life. Two exceptions were questions on the fat-content and quantity of cow’s milk consumed between 2–3 years old. As breastfeeding or infant formula is recommended until at least 1 year of age in the US,34 and only whole milk or in some cases 2% milk is recommended until the second birthday,34 the authors inferred that there would be greater variability in exposure to cow’s milk of different fat-contents among children between 2-3 years old than earlier in life.
A question on water was focused on the type of water consumed at the time of the child’s second birthday. As a number of infants are breastfed and obtain much of their fluid intake directly through human milk,35 the authors believed that this question should be focused on an age when the vast majority of infants are fully weaned.
Two questions examined supplemental vitamin D exposure. One was focused on the duration of exposure to vitamin D drops in infancy. In the US, vitamin D drops are available in a dose of 400 international units (IU), which is the standard daily dose used in infant supplementation.36,37 The other question focused on vitamin D supplementation between 2-3 years old.
Participants who indicated that their child has a gluten sensitivity condition were also asked questions about the age of diagnosis of the child, the type of professional who made the diagnosis, and the types of medical tests that were conducted as part of the process of diagnosis.
Ethics
This study was approved by Columbia University’s MS IRB. The protocol identifier is AAAR8822. All survey participants completed an electronic informed consent, which served as the first question in the survey.
Recruitment
Potential participants were informed via social media posts, electronic newsletters, websites, and Facebook advertisements that the investigators were conducting an Internet-based research survey. The primary mode through which potential participants were recruited was Facebook posts. To increase participation, participants were offered the opportunity to enter a raffle with two $50 gift cards as prizes. A “thank you” landing page appeared upon completion of the survey and included buttons for sharing the survey on Facebook and Twitter.
In total, 111 different groups permitted the survey to be highlighted through their media (Table S1). Of these groups, two are national patient advocacy organizations focused on CD, one is a CD research center, 20 are focused on CD in children, seven are focused on the gluten-free diet for children, 32 are focused on CD in general, and 49 are focused on the gluten-free diet in general.
The two national patient advocacy organizations that participated are Beyond Celiac and the National Celiac Association. Beyond Celiac made multiple postings to its Facebook page highlighting the survey. The National Celiac Association included a link to the survey in its electronic newsletter, highlighted the survey to its regional affiliates, and included a post on the survey on its Facebook page. The Center for Celiac Research and Treatment at Massachusetts General Hospital is the CD research center that highlighted the survey through its media. Two posts appeared on the Center’s Facebook page, and a notice about the survey was distributed through the Center’s Twitter feed.
While the recruitment materials acknowledged that the study’s purpose is to better understand factors associated with CD and gluten sensitivity, the materials also emphasized that all groups were needed as participants. To increase participation among parents whose children do not have gluten sensitivity conditions, participants were encouraged to share the survey link with friends whose children are not known to have a gluten sensitivity condition.
The specific variables being examined were not disclosed in the recruitment materials. To decrease the likelihood of survey fraud, internet protocol addresses of participants were recorded, and each participant was asked to provide an email address. While providing an email address was optional, it was required if the participant wished to be included in the raffle.
Sample
After the data was collected, case and control groups were determined. Only responses from parents residing in the US who answered the survey questions regarding a biological child between 3 and 12 years old were included.
While the subjects in this study are children, only a minority of the groups used in recruiting for this study are focused on CD or gluten sensitivity in children. Most groups are not restricted to a particular age range, and the vast majority include an extremely high proportion of parents who have CD themselves. This suggests that parents with CD would be significantly over-represented among survey respondents, and this is especially true among respondents whose children do not have CD.
Yet, a parent who has a diagnosis of CD prior to the birth of her child could make very different decisions than she otherwise would have regarding the variables under consideration in this study due to the fact that she has CD. For example, perhaps a mother with CD would choose to breastfeed her child longer than she otherwise would have if she did not have CD. Likewise, a parent with CD is more likely to be aware of the possibility that her child could develop CD,38 and more likely to seek testing for her child,38 which increases the probability of a subsequent diagnosis of CD in her child. Thus, to avoid biasing this study’s results, the significant subset of children with a parent with CD was excluded from the sample used in the main case-control analyses. For readers who are interested, analyses for a larger sample that includes children with parents with CD are included in the Supplementary Materials.
The case set was defined from the subset of participants who fulfilled the previously mentioned criteria, and who acknowledged that their child has a diagnosis of CD from a medical professional. While a number of survey respondents answered the questions in the survey about a child with NCGS or wheat allergy, these responses were excluded from the case set, since NCGS and wheat allergy are distinct conditions that differ from CD,39 and diagnostic criteria for NCGS is less well-defined than for CD.39,40 Since three of the variables under consideration in this study relate to the time period between 2-3 years old, a lower bound on age of diagnosis of 3 years was also used as a criteria in defining the case set.
The control set was defined from the subset of participants who fulfilled the previously mentioned criteria and whose children do not have CD, NCGS, or wheat allergy. In addition, since exposure to gluten is necessary for development of CD,1 any child who had never consumed gluten or who was on a gluten free diet at the time the survey was conducted was excluded from the control set.
Construction of variables
An initial set of raw binary categorical variables was constructed based on the specific answers to nine of the survey questions. For example, one question in the survey was on the fat content of cow’s milk consumed by the child between 2-3 years old. For this question, there were six possible answer choices, including “I’m not sure” as the final possible answer. Five binary categorical variables were constructed from the first five answers to this question.
Using data from these same nine questions, a second distinct set of nine exposure variables was constructed to represent magnitudes of exposure, by associating a number with each answer of each of these questions.
Five of the nine exposure variables were scaled exposure variables, in that the magnitude of exposure was represented on a numerical scale with more than three possible values. For example, the discrete answers to the question on the number of courses of antibiotics provided up to the second birthday were: “None”, “1”, “2–3”, “4–7”, “8+”, and “I’m not sure”. Each answer was associated with the number corresponding to the lower bound in the respective range. Specifically, the corresponding numbers for these answers were: 0, 1, 2, 4, 8, and NA. This correspondence was used to construct the scaled antibiotic variable.
The variable for vitamin D supplementation between 2–3 years old was defined as a trinary variable, as it had three non-NA values: 0, 1, and 2, corresponding to the respective answers: a) no supplementation, b) occasional or only part of the year supplementation, and c) regular or fairly regular supplementation for the entire year. The vitamin D drop exposure variable was defined as a dichotomous variable with a cut point at greater than 3 months exposure. Two remaining variables, skim milk and RO water, were defined as binary variables, indicating whether the exposure in question occurred during the respective time frames.
The full set of nine exposure variables is: ear infection (number), antibiotic (courses), breastfeeding (number of months), vitamin D drops >3 months (dichotomous), vitamin D supplement (trinary), age at introduction of gluten (months), skim milk (binary), milk quantity (cups per day), and RO water (binary).
Eight demographic variables were also constructed. Some were scaled variables such as maternal education where the answers were assigned to ordinal numbers. Others were binary categorical variables such as relationship to the child, where “biological mother” was associated with 0 and “biological father” was associated with 1. The full set of eight demographic variables is: age of the child (scaled), sex of the child (binary), maternal education (scaled), ethnicity of the child (binary), Southeast (binary), Northeast (binary), relationship of respondent to the child (binary), and maternal age at birth of the child (scaled). Details on the encoding of the exposure variables and the encoding of the demographic variables are provided in Table S2 and Table S3, respectively.
Statistical analysis
Analyses were run using the R statistical package. In this study, the P-value for statistical significance was defined to be ≤0.05.
Crude Wald odds ratios (ORs) and 95% confidence intervals (CIs) were computed for each of the binary categorical exposure variables.
A consistent set of demographic covariates was determined objectively for the logistic regressions presented in this study using the following procedure. For each of the nine exposure variables, a preliminary logistic regression was run where the candidate set of covariates consisted of the eight demographic variables against the outcome of CD. Variable selection in these preliminary logistic regressions was made using Akaike information criterion (AIC). AIC is a measure of relative model quality.41 The union of all covariates included in each of these logistic regressions, in which an exposure variable was included based on AIC, was used as the set of covariates to be included in all logistic regressions where results are presented.
The ORs and adjusted odds ratios (aORs) for the nine exposure variables using the consistent set of covariates were obtained.
Results
Sample
The survey was opened to participants on October 23, 2018 and closed on December 27, 2018. There were 1,178 completed survey responses excluding one redundant response from a participant who took the survey twice.
Following the procedure described in the Methods section, the responses were pared down to case and control groups, as shown in Figure 1. After exclusions, there remained: 332 responses associated with children with a diagnosis of CD that were diagnosed at 3 years or older (cases) and 241 responses associated with children who do not have CD or another gluten sensitivity condition, whose siblings do not have such conditions, and who are not on a gluten free diet (controls).
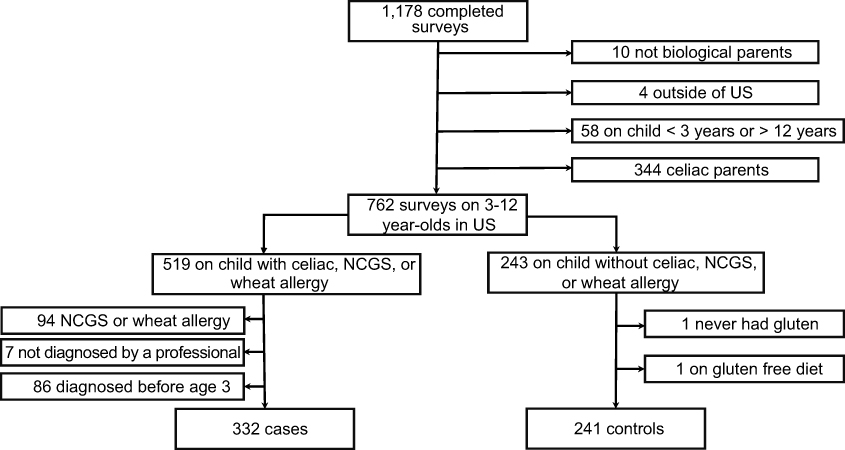 |
Figure 1 Flow chart for participant inclusion. Abbreviations: NCGS, non-celiac gluten sensitivity; US, United States. |
Demographics
Table 1 provides characteristics of the participants in the sample. Case children were on average 2.4 years older than controls, were more likely to be female than controls, and were somewhat less ethnically diverse than controls. There was proportionally somewhat less representation in the Southeast among cases than controls and, conversely, somewhat greater representation in the Northeast among cases than controls. Case biological mothers were, on average, 0.7 years younger than control biological mothers when the child was born and were slightly better educated than control biological mothers, on average. The survey respondents for both cases and controls were overwhelmingly biological mothers.
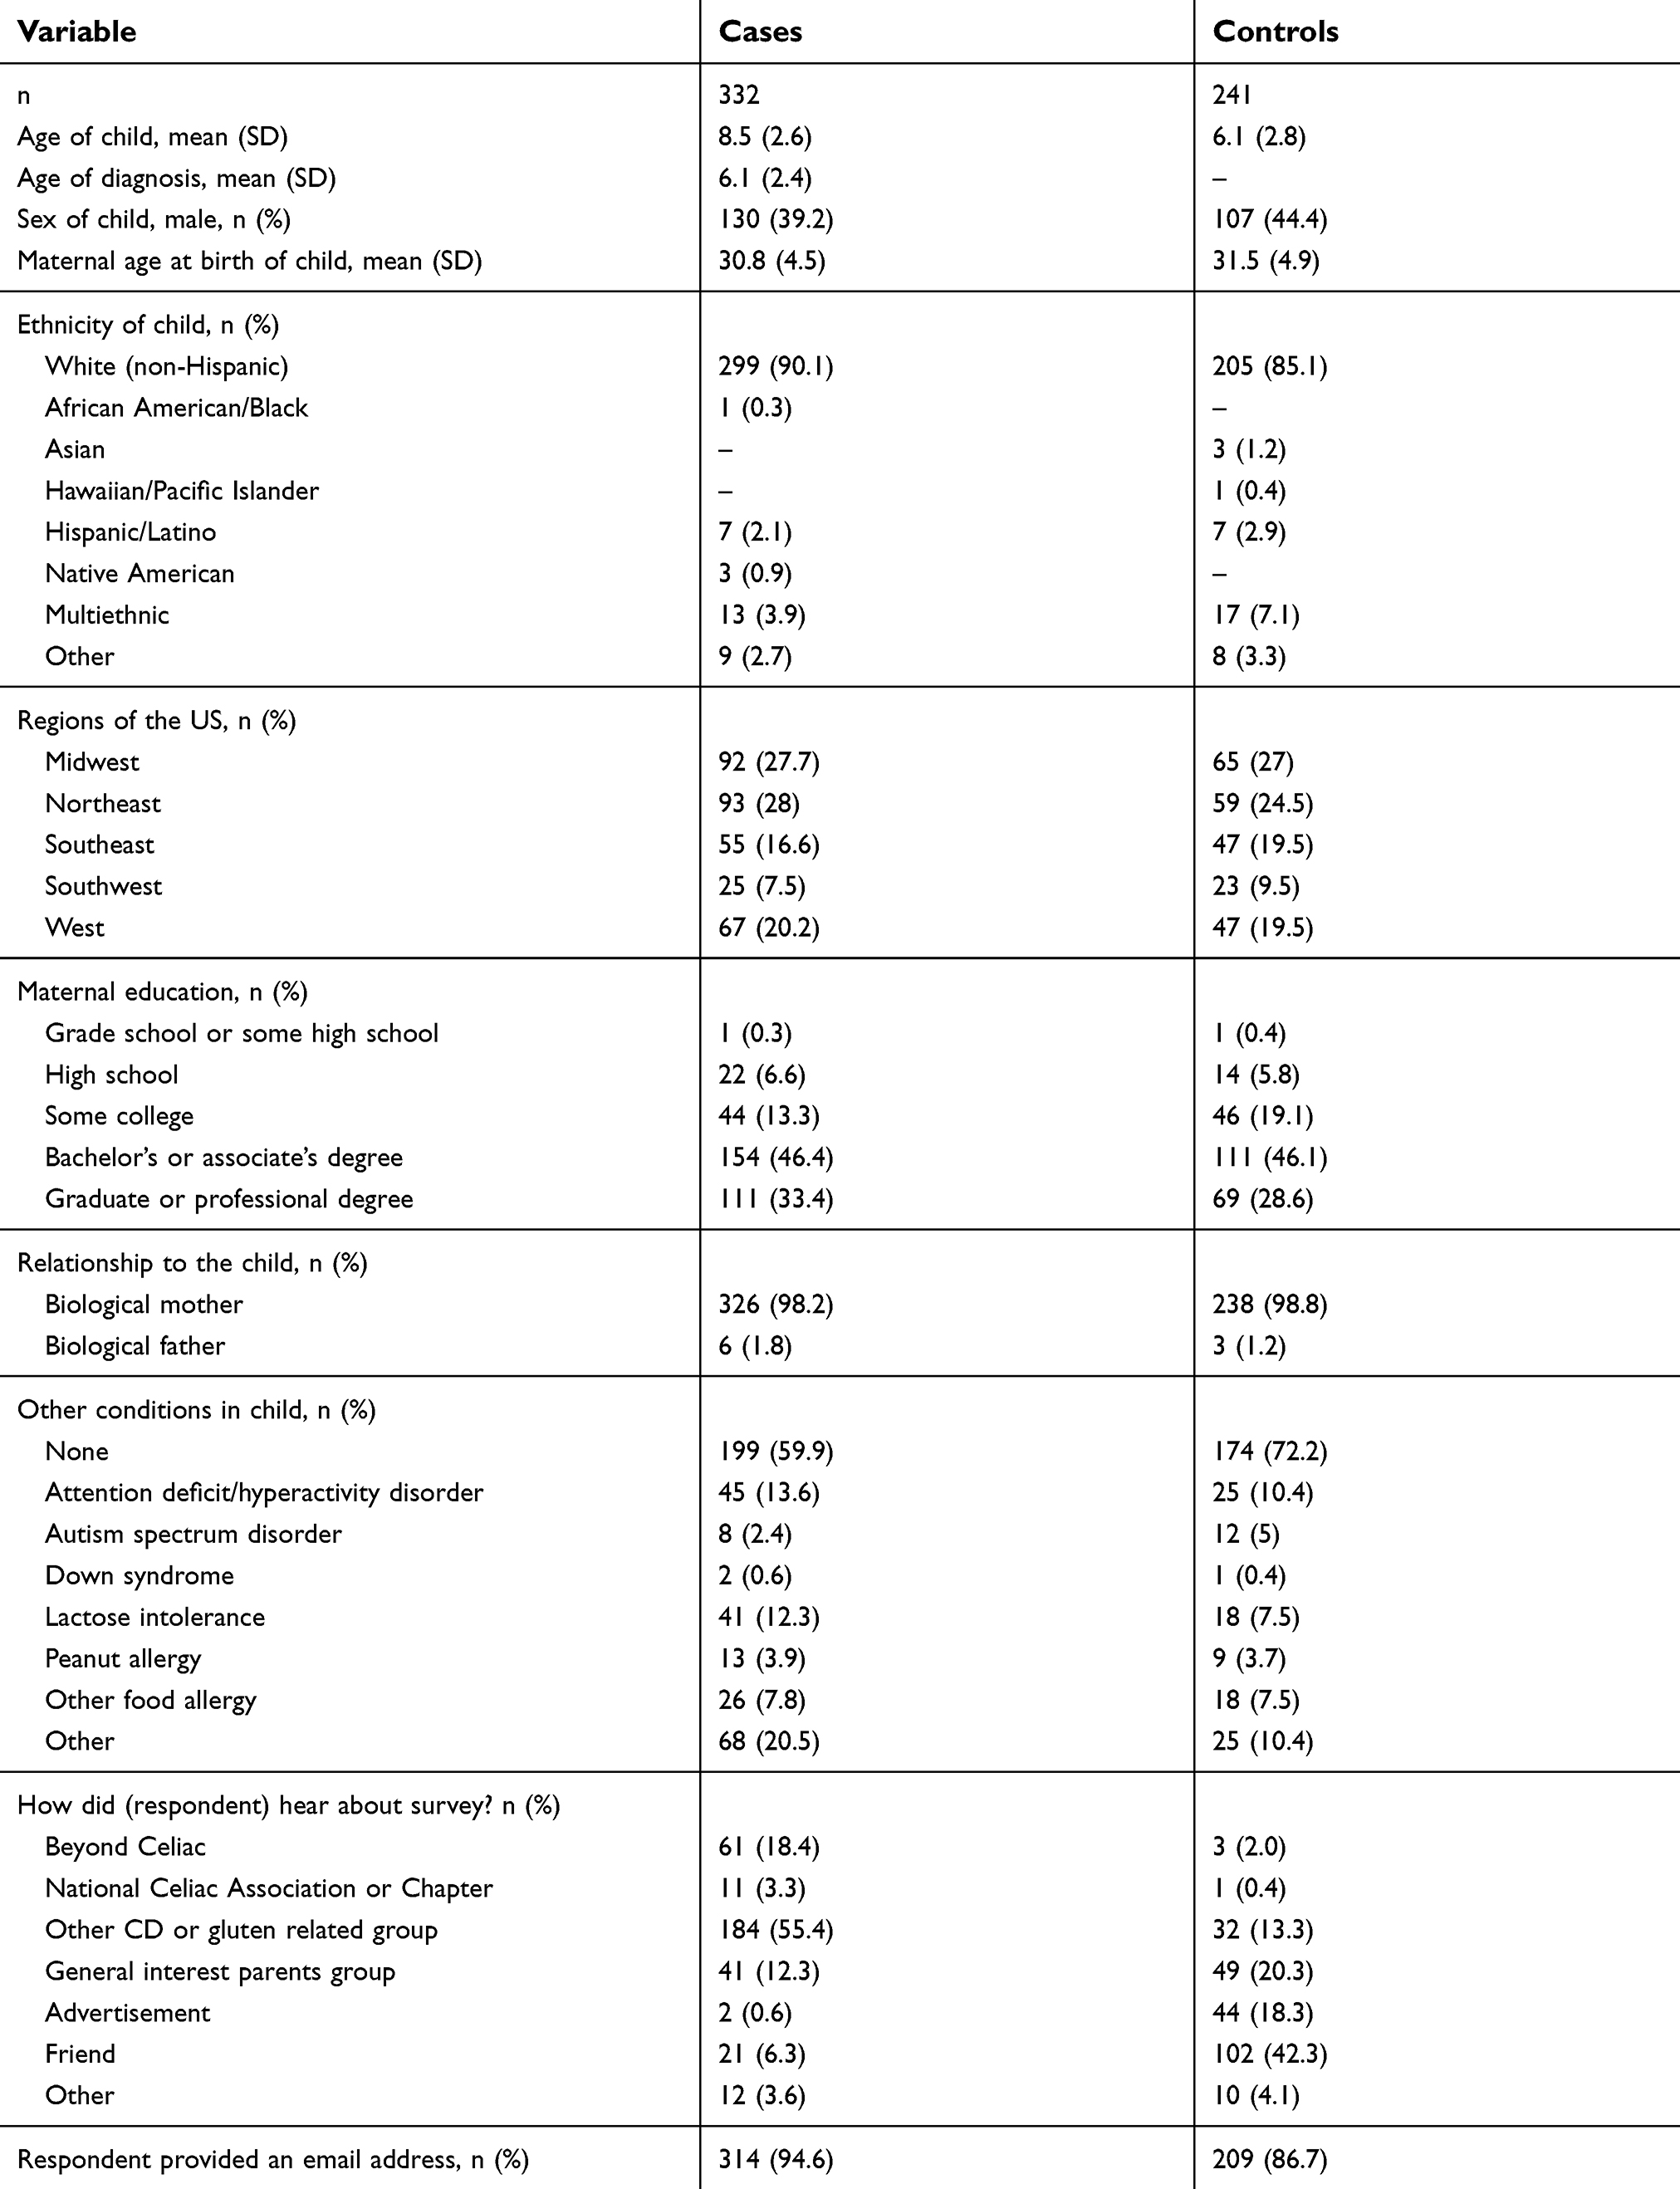 |
Table 1 Demographics |
Among the groups targeted, Beyond Celiac generated the greatest number of responses. Participants who were referred by a friend represented a much greater proportion of controls than cases.
ORs and aORs
Wald ORs for the set of raw categorical variables constructed directly from the survey responses are reported in Table 2. Four of the nine questions in this table have categorical variables with statistically significant associations with CD.
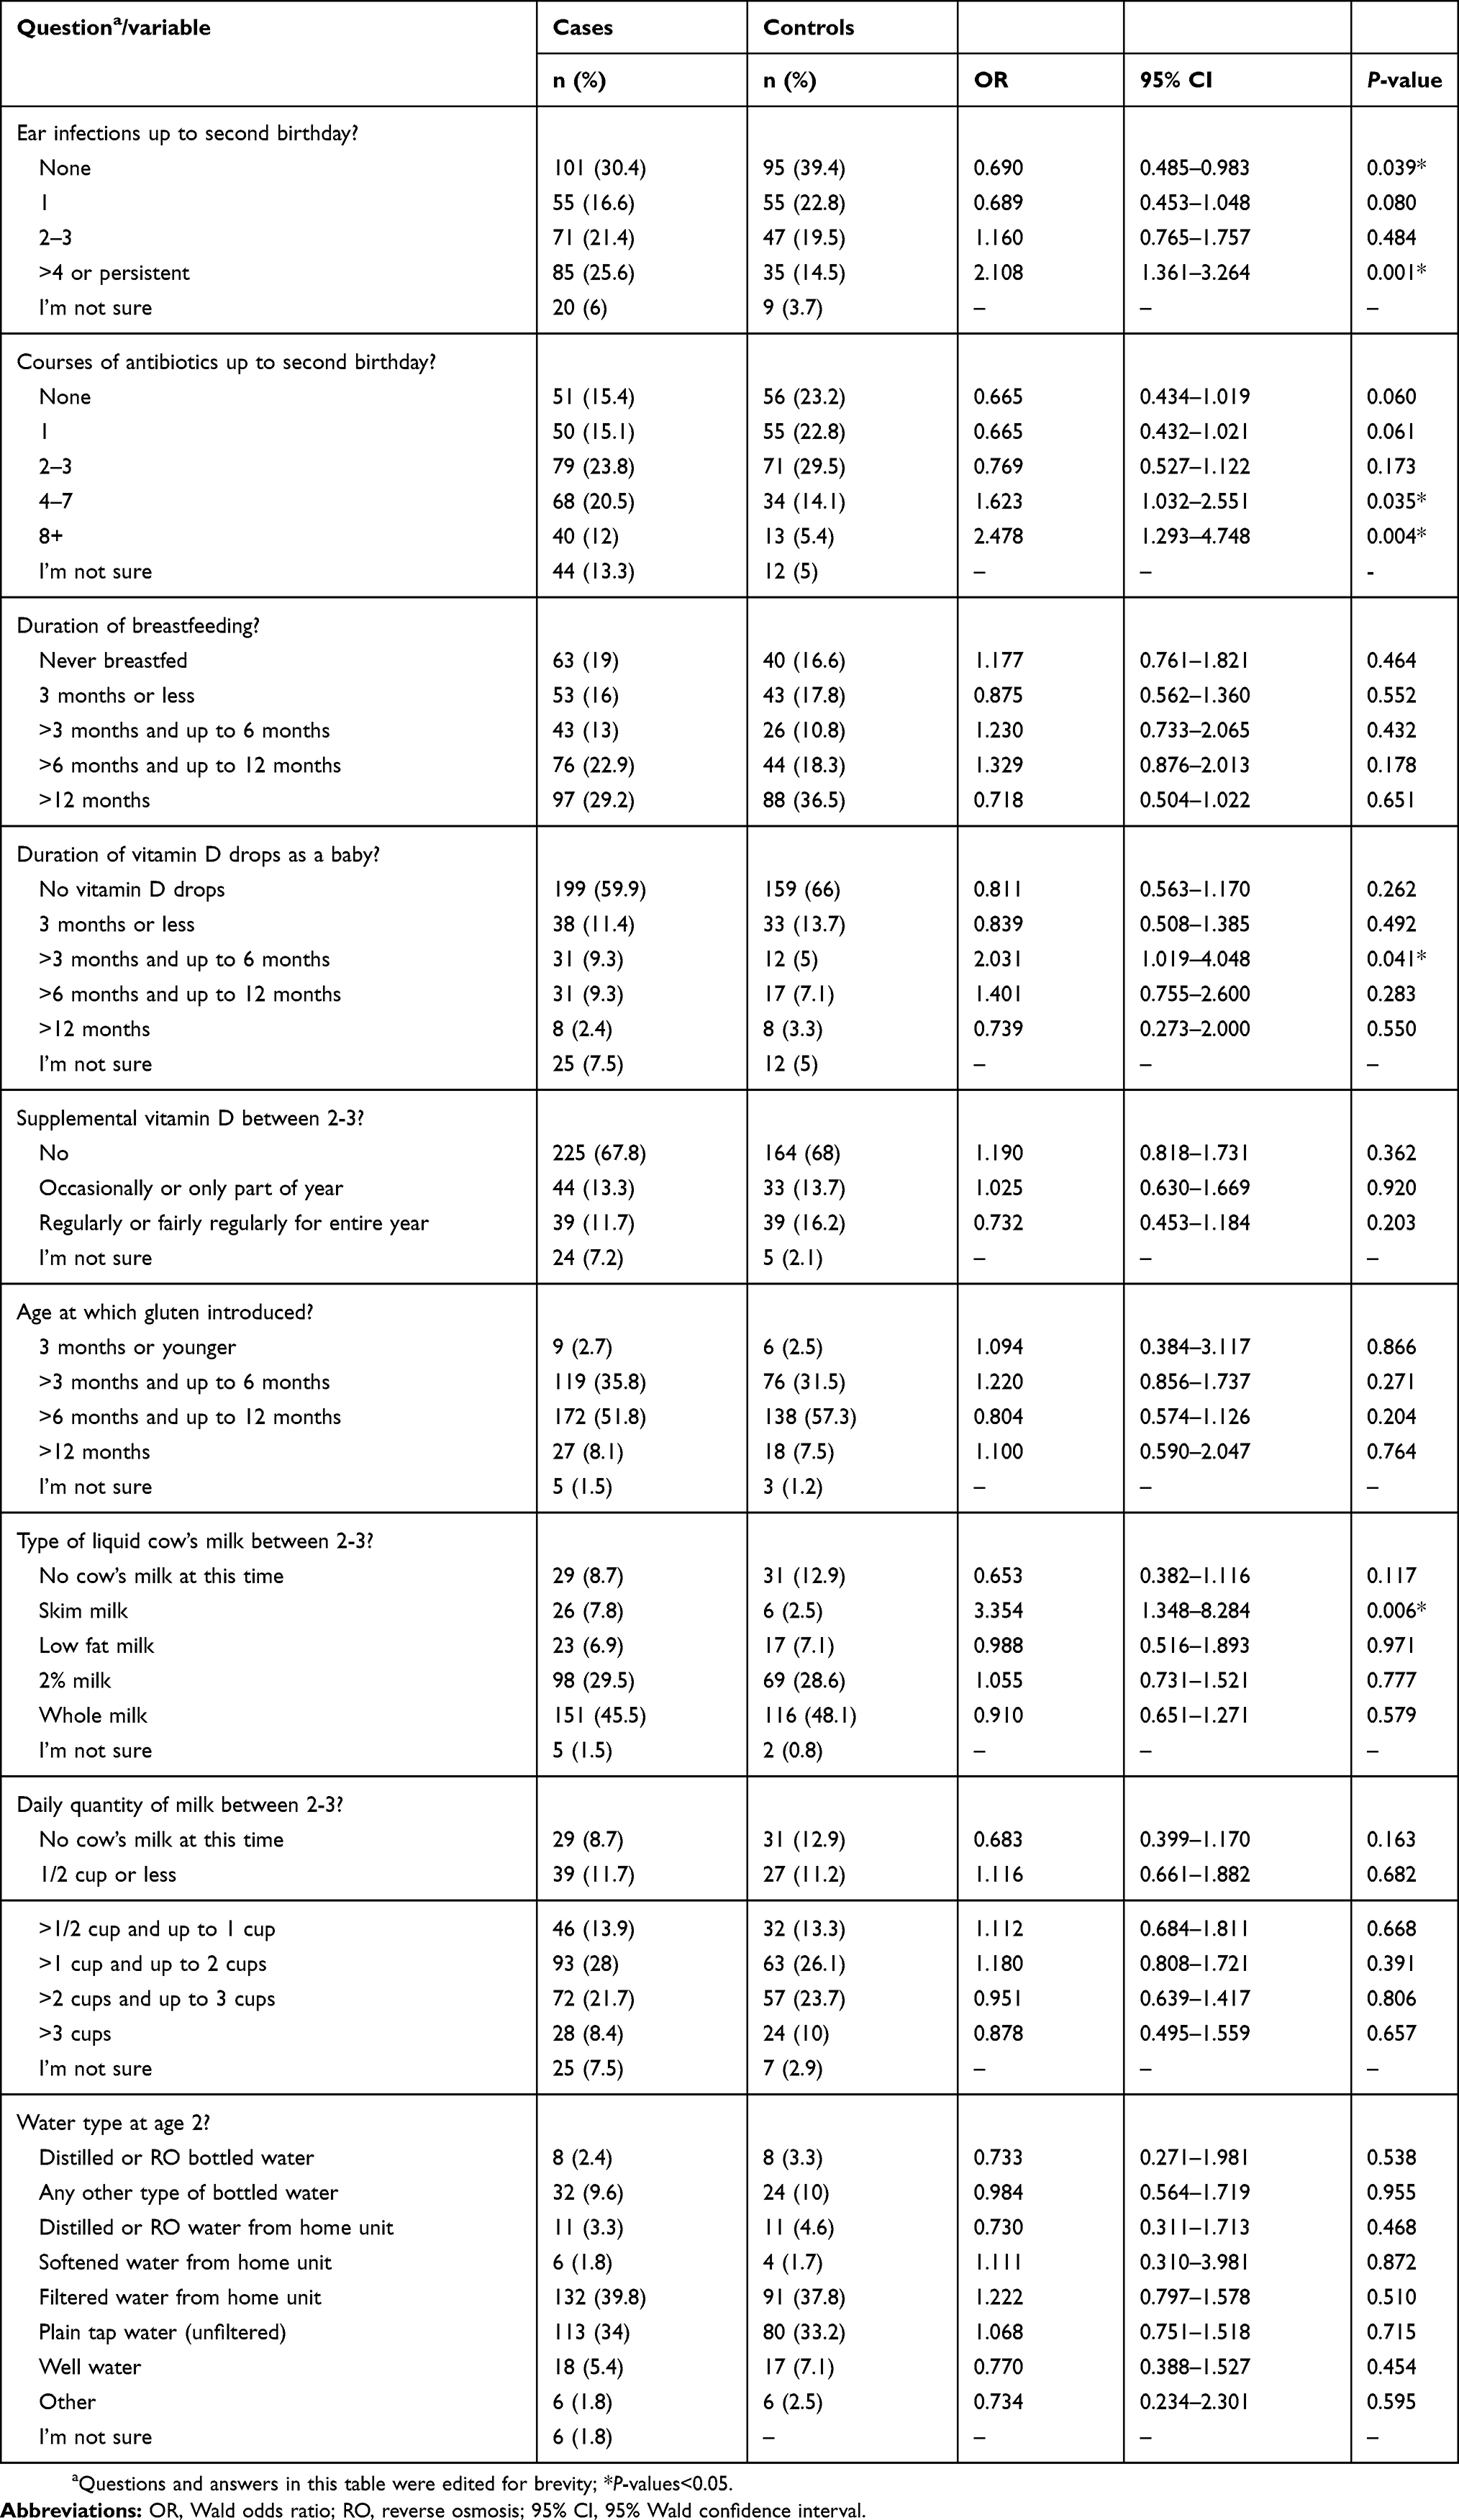 |
Table 2 Categorical variables and ORs |
The consistent set of covariates included four of the eight demographic variables in the candidate set. These four covariates are: age of the child, ethnicity, maternal education, and maternal age at birth of the child. Four of the nine exposure variables were found to have statistically significant associations with CD when adjusted for the four covariates (Table 3). These four are skim milk, vitamin D drops >3 months, ear infection, and antibiotic.
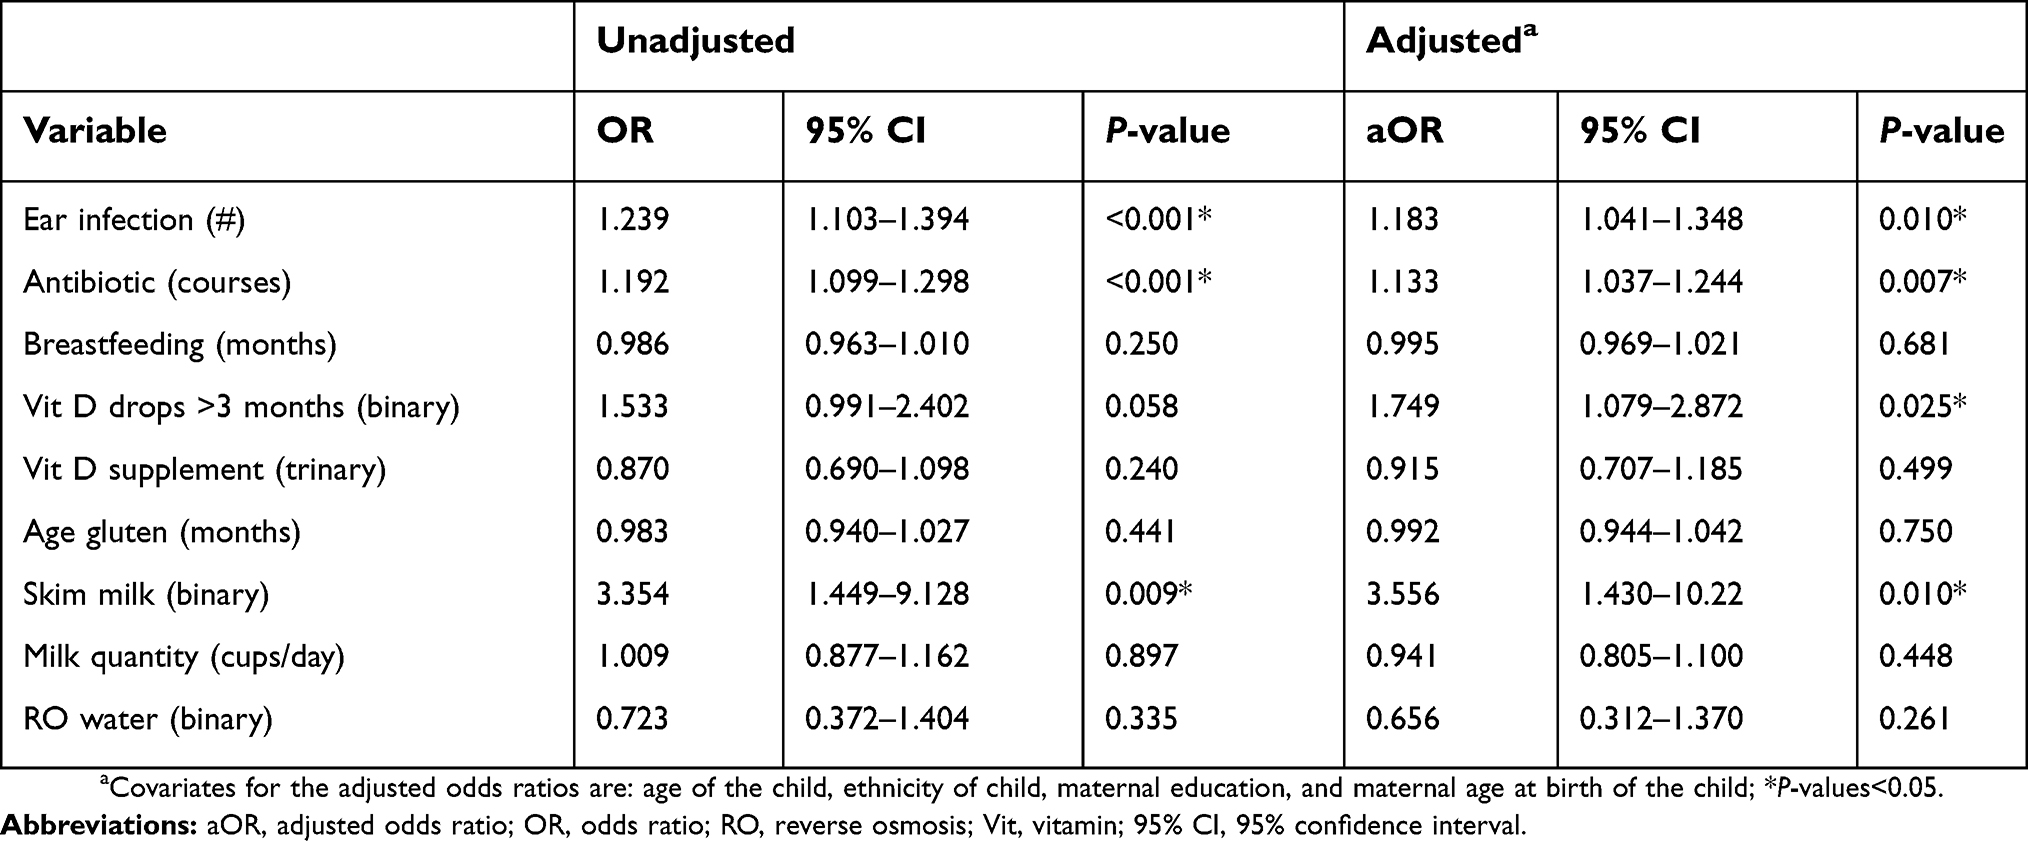 |
Table 3 ORs and aORs |
Expanded data set
Analogous results for an expanded data set, which includes the substantial response from parents who have CD, appear in the Supplementary Materials. Specifically, Figure S1 provides details on the exclusions, Table S4 provides the demographic data, Table S5 provides the ORs for the categorical data, and Table S6 provides the OR and aORs on the exposure variables for this expanded data set.
Discussion
Sample
As expected, survey participation among CD parents was disproportionate. In the expanded data set, 27% of case children had a parent with CD, and 36% of control children had a parent with CD (Table S4). In a representative data set, these statistics would be closer to 6% and 1.5%, respectively.42,43 While the remaining discussion will focus on the primary data set, which excludes CD parents, the most interesting associations found in this study are present in both the primary and expanded data sets.
Potential bias
In case-control epidemiological survey studies on severe disease where the survey population has a preconceived view that a certain exposure may be a risk factor for the disease, differential recall bias may tilt results toward a positive association with the exposure in question.44 While differential recall bias does not always play a significant role in such studies,44–46 where it does occur, it is usually attributed to case participants overestimating the exposure in question relative to controls.44
Consider the possible effects of differential recall bias in the present study. Sophisticated participants may be aware of some of the effects of infection on the immune system,47 or of the negative effects of antibiotics on the microbiome in general.48 Thus, some of the more sophisticated participants may have a preconception that ear infection or antibiotic use could be a risk factor for CD. Thus, it seems plausible that differential recall bias could tilt results toward finding associations between ear infection and CD and antibiotic and CD. Both of these associations were found in this data set.
Sophisticated participants in this study might also be aware that cow’s milk is a common allergen and that consuming excessive quantities of cow’s milk in infancy may have negative effects.49,50 Similarly, many participants are likely aware that some medical authorities promote breastfeeding and vitamin D supplementation in infancy due to their perceived benefit to early childhood development in general.35–37,51–53 Thus, a sophisticated lay person might infer that moderation in cow’s milk consumption, increased duration of breastfeeding, and increased exposure to vitamin D drops in infancy could each plausibly be associated with decreased risk of CD. However, the data from this study suggests that neither the quantity of cow’s milk consumed, nor duration of breastfeeding have a significant effect on risk of CD, and vitamin D drop exposure for greater than 3 months is actually associated with an increased risk of CD. Thus, it would seem that differential recall bias did not have a significant effect on the direction of associations of the exposure variables in this study.
A method of recruitment in which research participants play a role in recruiting their friends is known as snowball sampling.54 By construction, this study made use of snowball sampling in obtaining a small number of its case participants and in obtaining a significant minority of its control participants. Snowball sampling has been used in a number of studies on CD.55–57 While some research suggests that snowball sampling may contribute to biases in a sample,58 other research suggests that, in practice, this concern may be overstated.59–61
A key question in this study is whether the use of snowball sampling for a significant minority of the control group induced systematic bias in the answers to the exposure questions. Since many of the control participants indicated that they were social media friends of other participants, who were almost certainly case participants for the most part, it seems likely that some of the control participants had children with exposures in common with the children of the case participants who referred them. Such a scenario would tend to make control responses more similar to case responses than they otherwise would have been with a purely random sample. While this scenario could decrease the strength of some of the associations observed, it seems unlikely that it would change the direction of such associations.
Demographics
The significant age difference between case and control children can be explained by the study design. Case parents reported on their youngest biological child with CD and that diagnosis of CD must have been made at age 3 or older, while control parents were asked questions about their youngest child between 3 and 12 years of age. Hence, some case parents would have had a younger child between 3 and 12 for which data was not obtained. In addition, one can obtain a CD diagnosis throughout life.62 Since case children must have a CD diagnosis, this also suggests that there would be fewer case children at younger ages, as some children who would otherwise be included in the case set do not yet have a diagnosis of CD.
The greater percentage of females among cases than controls can be explained by CD epidemiology. Specifically, CD is more common among females than males.63
While case biological mothers were marginally better educated on average than control biological mothers, both were better educated than the female adult population of the US between 30 and 54 years of age.64 The much greater proportion of controls that were recruited by friends than cases shows that the emphasis on friend recruitment of controls appears to have been effective.
Skim milk
The data suggests that consumption of skim milk as the primary form of liquid cow’s milk between 2-3 years old is associated with a subsequent diagnosis of CD (Table 3). While the ORs for the raw categorical variables in Table 2 on milk type show no other statistically significant associations between milk type and CD, they do suggest a general trend toward consumption of lower fat milks among those subsequently diagnosed with CD.
Skim milk consumption by a child could be a result of skim milk consumption by the household in general.65 This could be connected to a parent’s concern about his or her own weight.66 Yet maternal obesity does not appear to be associated with a subsequent diagnosis of CD in the child.67 Consumption of skim milk by a child could also be motivated by parental concerns about the child’s weight. In this light, the finding on skim milk consumption from the present study could be suggestive of increased obesity among case children prior to diagnosis. This is plausible, as there is an atypical presentation of CD in children with obesity at the time of diagnosis that is becoming increasingly common.68 While this is theoretically possible, many other factors beyond obesity are involved in parental choice to use lower fat milks.65,69
Alternatively, skim milk consumption could increase the risk of developing CD. There are hints in the existing literature that consumption of skim milk by young children may have undesirable effects on digestive health. Specifically, consumption of skim milk or low-fat milk compared with consumption of whole milk in very young children may increase risk of diarrhea.70,71
In addition, long-term trends of increased skim milk consumption by children generally mirror long-term trends of increased incidence of CD. Specifically, per capita skim milk consumption by young children in the US doubled between the mid-1970s and the mid-1990s.72 During this time period, incidence of CD also increased significantly.73 Thus, the findings on skim milk in the present study are intriguing and are worthy of further investigation in a prospective study.
Oral vitamin D
While the OR on only one of the vitamin D drop categorical variables is statistically significant (Table 2), these variables do suggest a pattern. Specifically, the data suggests that infants who receive oral vitamin D drops for longer than 3 months are at increased risk of subsequently developing CD. Admittedly, there is one exception to this pattern, in that infants who receive vitamin D drops for more than 12 months are at decreased risk of developing CD according to the data, but this latter result is far from statistically significant.
The P-value for the dichotomous variable, vitamin D drops >3 months (Table 3) confirms that the association between this variable and CD is present and is statistically significant when adjusted for covariates. There is no clear pattern on the distinct variable for vitamin D supplementation between 2-3 years of age.
Other studies have found associations between nutrient supplementation and CD. Specifically, a Norwegian study found that prenatal iron supplementation is associated with CD in the child.74 A separate multi-site study was not able to replicate this result, but did find a statistically significant association between any prenatal vitamin D supplementation and CD autoimmunity in the child as defined by anti-tissue transglutaminase antibodies.75 Admittedly the authors of this latter study did not attach any importance to this vitamin D result, and analogous associations in this latter study were not statistically significant when the vitamin D exposure variable was defined alternatively as a scaled variable or when the outcome was CD as defined by biopsy.75 Separate research has found that nutrient supplementation in children is correlated with maternal nutrient supplementation.76 Thus, the finding on vitamin D drops in the present study echoes the two prior studies that found associations between nutrient supplementation and CD. In particular, the association in the present study is aligned with the association found between any prenatal vitamin D supplementation and CD autoimmunity in the multi-site study.
As previously explored in the Potential bias section, it seems unlikely that the vitamin D drop result from the present study is due to bias. Specifically, if differential recall bias did impact the result for this variable, it would likely be in the direction of vitamin D drops decreasing risk.
Plausibly, the association between vitamin D drops administered for greater than 3 months and CD could be due to some fundamental effect of oral vitamin D supplementation in infancy. Superficially, this may seem unlikely, as vitamin D supplementation in infancy is endorsed by many medical authorities,36,37,53 and plasma levels of 25-hydroxyvitamin D are often relatively low in newly diagnosed CD patients.77–79 As a result, vitamin D supplementation is often recommended for those with CD who have low plasma levels of 25-hydroxyvitamin D.80,81
Yet, findings on low 25-hydroxyvitamin D plasma levels among newly diagnosed CD patients do not preclude the possibility that oral vitamin D supplementation in infancy could be a risk factor in inducing the cascade of events leading to CD.
Vitamin D is an immunomodulator.18,82 Vitamin D supplementation in extremely high doses in mice increases susceptibility to colitis,83 and vitamin D supplementation in lethal doses in rats causes sloughing of the intestinal villi.84 In humans, supplementation in extremely high doses can have negative effects on digestion as exhibited through constipation.85,86
Regarding CD, while plasma levels of 25-hydroxyvitamin D are often low in CD in the newly diagnosed, plasma levels of 1,25-dihydroxyvitamin D, which is the active form of vitamin D, are often high in CD, and this is especially true in the newly diagnosed.87–89 Relatedly, hyperparathyroidism, which is usually assumed to be secondary hyperparathyroidism, is common in CD in the newly diagnosed.79,89–91 Parathyroid hormone increases the rate of conversion of 25-hydroxyvitamin D to 1,25-dihydroxyvitamin D.92,93
Since 1,25-dihydroxyvitamin D is the active form of vitamin D, and it is often elevated in CD, the rationale for vitamin D supplementation in CD seems suspect.94 Relatedly, the only case-control study comparing treatment with supplemental vitamin D, calcium, and gluten-free diet (GFD) relative to treatment with GFD alone in newly diagnosed patients with CD, found no incremental benefit associated with supplemental vitamin D.95 This result and other evidence prompted Zingone and Ciacci,94 in their recent review on this topic, to conclude that, “At the moment we cannot find adequate evidence of the need of vitamin D supplementation in patients with [CD] on a gluten-free diet.”
While the elevated levels of 1,25-dihydroxyvitamin D often observed in CD have generally been viewed as a result of CD rather than a cause of it,87–89 there are clues in the literature that this metabolite may also play a more fundamental role in CD etiology. First, primary hyperparathyroidism causes and is relatedly associated with high levels of 1,25-dihydroxyvitamin D in plasma,96 and two studies have found comorbidity between primary hyperparathyroidism and CD.97,98 There also is no known explanation for the comorbidity of these two seemingly unrelated conditions in the literature.97 Second, Williams syndrome, a genetic syndrome characterized by mild-to-moderate intellectual disability and hypercalcemia, is associated with extreme elevations in 1,25-dihydroxyvitamin D in plasma in infancy.99 These elevations of 1,25-dihydroxyvitamin D are due to the deletion of the WSTF gene, which normally plays a vital role in vitamin D homeostasis.100 Williams syndrome has high comorbidity with CD.101 Third, tuberculosis is associated with elevated 1,25-dihydroxyvitamin D in plasma due to macrophage activation caused by the underlying bacterial infection.102 A population-based cohort study found that those with a prior history of tuberculosis are about 2.5-times more likely to be diagnosed with CD.103
The comorbidity with CD of these three disparate conditions, each characterized by elevated plasma levels of 1,25-dihydroxyvitamin D due to three different underlying mechanisms, suggests that the elevated plasma levels of 1,25-dihydroxyvitamin D that are common to these conditions and that are often observed in other cases of CD may play a fundamental role in CD pathogenesis.
To summarize, the literature shows that, in active CD prior to the initiation of GFD, often excessive conversion of 25-hydroxyvitamin D results in low levels of 25-hydroxyvitamin D and high levels of 1,25-dihydroxyvitamin D, the active form of vitamin D. In addition, as highlighted by the examples of primary hyperparathyroidism, Williams syndrome, and tuberculosis, it seems plausible that elevated plasma levels of 1,25-dihydroxyvitamin D may increase risk of CD. Oral vitamin D supplementation raises plasma levels of 1,25-dihydroxyvitamin D.104 Thus, it also seems plausible that elevated plasma levels of 1,25-dihydroxyvitamin D due to significant vitamin D supplementation may increase the risk of CD in susceptible individuals. Perhaps this risk is greatest in infancy, a stage of development when the immune system is still immature.105 While this interpretation of the results in the literature is novel, it offers a plausible fundamental explanation for the vitamin D drop result from the present study, as well as offering a possible explanation for some aspects of CD epidemiology, as highlighted above.
Additional comorbidity data and other epidemiological evidence from the literature are also consistent with the possibility of such a connection.22 Regarding the former, some studies have found that vitamin D supplementation in infancy increases risk of atopic dermatitis and asthma in later life,106–109 and both of these conditions have significant comorbidity with CD.110,111
Regarding other epidemiological evidence, the case of Sweden is most striking. As mentioned in the Introduction, regulations requiring vitamin D fortification of food were introduced in March of 1983 in Sweden,23 and the inception of the Swedish celiac “epidemic” has been independently dated from 1984.5
Ear infection
The ORs for the raw categorical variables on ear infection increase with the number of such infections (Table 2). In addition, the scaled ear infection exposure variable is associated with a subsequent diagnosis of CD (Table 3).
While the authors believe this is the first time a result has been published establishing an association between ear infection and CD, at least three previous studies have found that infection in general early in life is associated with CD.26–28 One of these, a nationwide Norwegian study, examined infections by type and found that upper respiratory infections, lower respiratory infections, and gastroenteritis are all associated with CD.27 In this Norwegian study, ear infection was categorized as an upper respiratory infection,27 and the study found an association between upper respiratory infection and CD (aOR=1.03, CI=1.02–1.05).27 While the CI in the present study for ear infection overlaps with the CI in the Norwegian study for upper respiratory infection, the aOR and CI in the present study are larger in magnitude. Part of this difference may be an artifact of the way the exposure variable in the present study is defined. Specifically, the numeric value in the present study was assigned to the lower bound in the multiple-choice range answers. If upper bounds on ranges or means on ranges were used instead when defining the ear infection variable, the aOR in the present study would be slightly smaller in magnitude. It is also plausible that ear infections are a more sensitive indicator of subsequent diagnosis of CD than upper respiratory infections in general.
If the association between ear infection and CD is causative, it may be tied to inflammatory response to infections increasing the risk for autoimmunity, which underlies CD.112 Alternatively, it may be that ear infection increases the risk of CD through increased antibiotic exposure. In the US, ear infections are the most common reason for prescribing antibiotics to young children.29
Antibiotic
As with ear infection, the ORs for the raw categorical variables on antibiotic use generally increase with the number of courses of antibiotics (Table 2). In addition, the scaled antibiotic exposure variable is associated with subsequent diagnosis of CD (Table 3).
As with infection, there is already research in the literature suggesting an association between antibiotic use and CD. Three major studies have found such an association: two of the three were focused on exposure during the first year of life and subsequent diagnosis of CD, and the other was focused on an adult population.26,30,31 A fourth major multi-site study in children found no association between antibiotic exposure and CD autoimmunity based on its primary statistical measure, but this same study did find an association between multiple doses of macrolide antibiotics during the first year of life and CD autoimmunity.32
As three of four major studies on antibiotic exposure and CD found such an association, and the fourth found an analogous association on a specific type of antibiotic on a secondary measure, the findings from the present study are in agreement with other studies in the literature on this topic.
If the association between antibiotic and CD is causative, this could reflect the effects of antibiotic use on the microbiome. Specifically, antibiotic exposure in childhood can negatively impact diversity of the microbiome and can lead to dysbiosis.48,113 Children with active CD typically have “microbial signatures” in their microbiomes that differ from controls and have greater dysbiosis than controls.114,115
Other variables
While the aOR for breastfeeding duration points marginally in the direction of decreased risk, it is far from statistically significant. Similarly, while the aOR for age at gluten introduction points marginally in the direction of earlier gluten introduction decreasing risk, this result is also far from statistically significant. These results are consistent with recent research, which shows that neither breastfeeding nor age at gluten introduction have a significant effect on risk of CD.10–12
The aOR for the RO water variable points in the direction of RO water decreasing risk of CD. While the result is not statistically significant, this result provides no support for the hypothesis that RO water may increase the risk of CD.
Likewise, the aOR for the milk quantity variable provides no support for the authors’ preliminary hypothesis that increased consumption of cow’s milk may increase CD risk. A recent study that examined the impact of the quantity of powdered milk consumed on subsequent CD diagnosis in young children in Sweden found no association between quantity of powdered milk consumed and CD.116 Thus, while the studies are different with respect to the specifics, the result for the fluid milk quantity variable in the present study is consistent with the findings on powdered milk from this recent Swedish study.
Strengths and limitations
Some limitations of this study arose from its reliance on a retrospectively collected data set derived from an Internet survey. While efforts have been made to limit bias, and some of the analysis above suggests that bias was limited, the raw data collected from participants was essentially unverified beyond what could be gleaned from the participants’ responses. For example, only children whose parents indicated that a CD diagnosis was made by a professional were included in the case group. While data was collected on the types of medical tests conducted to obtain a diagnosis, no uniform diagnostic methodology was used among cases. In addition, in all probability most control children had not been formally tested for CD by a medical professional. In other words, a control child’s status as a control was primarily due to the fact that the child’s parents, and presumably in most cases the child’s pediatrician, did not have evidence that the child or the child’s siblings have CD or another gluten sensitivity condition.
As previously noted there were some demographic differences between case and control groups in this study. Specifically, case and control groups differed materially on the mean age of the child and to a lesser extent maternal education and ethnicity. While the main statistical measures used in this study were adjusted to account for differences in these variables, it would be desirable if the demographic characteristics of the case and control groups had greater similarity.
In addition, it would have been desirable to acquire additional detail from the participants on some of the variables analyzed in this study. For example, while 400 IU is the standard dose of vitamin D drops for infants in the US,36,37 and this study obtained information on the duration with which vitamin D drops were provided, it also would have been relevant to obtain information on the dose of vitamin D drops provided.
While using an Internet survey to obtain the underlying data set led to some of this study’s limitations, this approach was also linked to some of its strengths. For example, a large number of groups were used in recruitment for this study, and participants came from all regions of the US. In addition, using an Internet based survey to obtain the data removed the possibility of interviewer bias affecting results.
Conclusion
The two most intriguing findings in this study are that skim milk as the primary form of liquid cow’s milk between 2-3 years old is associated with CD, and oral vitamin D drop use for greater than 3 months in infancy is associated with CD. These are novel and potentially important results, and both of these variables are worthy of examination in a prospective study.
Abbreviation list
AIC, Akaike information criterion; aOR, adjusted odds ratio; CD, celiac disease; CI, 95% confidence interval; GFD, gluten-free diet; INCITE, Interdisciplinary Center for Innovative Theory and Empirics; IU, international units; NCGS, non-celiac gluten sensitivity; OR, odds ratio; US, United States.
Acknowledgments
The authors benefited from the facilities, resources, administrative, institutional, and research support provided by Columbia University’s Interdisciplinary Center for Innovative Theory and Empirics (INCITE). The authors are especially grateful to Peter Bearman of INCITE for his thoughtful suggestions on design of the questionnaire and drafts of this paper, and Michael Falco of INCITE for shepherding this research through the approval process. The authors are also grateful to the parents who took the time to participate in this study as well as the administrators and leadership of various groups who graciously permitted the survey to be highlighted through their media. We are grateful to Beyond Celiac, the National Celiac Association, and the Center for Celiac Research and Treatment at Massachusetts General Hospital for their assistance with subject recruitment. We are especially grateful to the staff of Beyond Celiac, Carla Carter of the National Celiac Association, and Dr Maureen Leonard, of the Center for Celiac Research and Treatment. This work was self-funded.
Disclosure
The authors report no conflicts of interest in this work.
References
1. Ludvigsson JF, Leffler DA, Bai JC, et al. The Oslo definitions for coeliac disease and related terms. Gut. 2012;62(1):43–52. https://dx.doi.org/10.1136%2Fgutjnl-2011-301346
2. Lionetti E, Catassi C. The role of environmental factors in the development of celiac disease: what is new? Diseases. 2015;3(4):282–293. https://doi.org/10.3390/diseases3040282
3. Rubio-Tapia A, Kyle RA, Kaplan EL, et al. Increased prevalence and mortality in undiagnosed celiac disease. Gastroenterology. 2009;137:88–93. doi:10.1053/j.gastro.2009.03.059
4. Catassi C, Kryszak D, Bhatti B, et al. Natural history of celiac disease autoimmunity in a USA cohort followed since 1974. Ann Med. 2010;42(7):530–538. doi:10.3109/07853890.2010.514285
5. Myleus A. Towards Explaining the Swedish Epidemic of Celiac Disease–An Epidemiological Approach. Umeå, Sweden: Department of Public Health and Clinical Medicine, Epidemiology and Global Health; 2012.
6. Akobeng AK, Ramanan AV, Buchan I, Heller RF. Effect of breast feeding on risk of coeliac disease: a systematic review and meta-analysis of observational studies. Arch Dis Child. 2006;91(1):39-43. https://adc.bmj.com/content/91/1/39
7. Silano M, Agostoni C, Guandalini S. Effect of the timing of gluten introduction on the development of celiac disease. World J Gastroenterol. 2010;16(16):1939–1942. https://dx.doi.org/10.3748%2Fwjg.v16.i16.1939
8. Ivarsson A, Myléus A, Norström F, et al. Prevalence of childhood celiac disease and changes in infant feeding. Pediatrics. 2013;131(3):e687–94. doi:10.1542/peds.2012-1015
9. Norris JM, Barriga K, Hoffenberg EJ, et al. Risk of celiac disease autoimmunity and timing of gluten introduction in the diet of infants at increased risk of disease. Jama. 2005;293(19):2343–2351. doi:10.1001/jama.293.19.2343
10. Vriezinga SL, Auricchio R, Bravi E, et al. Randomized feeding intervention in infants at high risk for celiac disease. N Engl J Med. 2014;371(14):1304–1315. doi:10.1056/NEJMoa1404172
11. Lionetti E, Castellaneta S, Francavilla R, et al. Introduction of gluten, HLA status, and the risk of celiac disease in children. N Engl J Med. 2014;371(14):1295–1303. doi:10.1056/NEJMoa1400697
12. Aronsson CA, Lee HS, Liu E, et al. Age at gluten introduction and risk of celiac disease. Pediatrics. 2015;135(2):239–245. doi:10.1542/peds.2014-1787
13. Ludvigsson JF, Green PH. The missing environmental factor in celiac disease. N Engl J Med. 2014;371(14):1341–1343. doi:10.1056/NEJMe1408011
14. Kristjánsson G, Venge P, Hällgren R. Mucosal reactivity to cow’s milk protein in coeliac disease. Clin Exp Immunol. 2007;147(3):449–455. doi:10.1111/j.1365-2249.2007.03298.x
15. U.S. Department of Agriculture, Agricultural Research Service. USDA national nutrient database for standard reference legacy release; 2018. Available from: https://ndb.nal.usda.gov/ndb/.
16. U.S. Department of Agriculture, Agricultural Research Service. How many calories are in one gram of fat, carbohydrate, or protein? Available from: https://www.nal.usda.gov/fnic/how-many-calories-are-one-gram-fat-carbohydrate-or-protein.
17. Green PHR, Cellier C. Celiac disease. N Engl J Med. 2007;357:1731–1743. doi:10.1056/NEJMra071600
18. Cantorna MT, Mahon BD. Mounting evidence for vitamin D as an environmental factor affecting autoimmune disease prevalence. Exp Biol Med (Maywood). 2004;229:1136–1142. doi:10.1177/153537020422901108
19. Unalp-Arida A, Ruhl CE, Choung RS, Brantner TL, Murray JA. Lower prevalence of celiac disease and gluten-related disorders in persons living in southern vs northern latitudes of the United States. Gastroenterology. 2017;152(8):1922–1932.e2. doi:10.1053/j.gastro.2017.02.012
20. Holick MF, MacLaughlin JA, Clark MB, et al. Photosynthesis of previtamin D3 in human skin and the physiologic consequences. Science. 1980;210(4466):203–205. doi:10.1126/science.6251551
21. Namatovu F, Linddvist M, Olsson C, Ivarsson A, Sandstom O. Season and region of birth as risk factors for coeliac disease a key to the aetiology? Arch Dis Child. 2016;101(12):1114–1118. https://dx.doi.org/10.1136%2Farchdischild-2015-310122
22. Bittker S. Exposure to excessive oral vitamin D in youth: a risk factor for celiac disease in later life? J Allergy and Asthma (Herbert). 2015;2(2). doi:10.7243/2054-9873-2-2
23. Livsmedelsverket. Livsmedelsverkets föreskrifter (SLVFS 1983:2) om berikning av vissa livsmedel (Food agency’s order about fortification of foodstuffs). Available from: https://www.livsmedelsverket.se/globalassets/om-oss/lagstiftning/berikn---kosttillsk---livsm-spec-gr-fsmp/slvfs-1983-02-kons.pdf.
24. Gedam VV, Patil JL, Kagne S, Sirsam RS, Labhasetwar P. Performance evaluation of polyamide reverse osmosis membrane for removal of contaminants in ground water collected from Chandrapur district. J Memb Sci Technol. 2012;2:3. http://dx.doi.org/10.4172/2155-9589.1000117
25. Irimura T, Wynn DM, Hager LG, Cleary KR, Ota DM. Human colonic sulfomucin identified by a specific monoclonal antibody. Cancer Res. 1991;51(20):5728–5735.
26. Canova C, Zabeo V, Pitter G, et al. Association of maternal education, early infections, and antibiotic use with celiac disease: a population-based birth cohort study in northeastern Italy. Am J Epidemiol. 2014;180(1):76–85. doi:10.1093/aje/kwu101
27. Mårild K, Kahrs CR, Tapia G, Stene LC, Størdal K. Infections and risk of celiac disease in childhood: a prospective nationwide cohort study. Am J Gastroenterol. 2015;110(10):1475–1484. doi:10.1038/ajg.2015.287
28. Myléus A, Hernell O, Gothefors L, et al. Early infections are associated with increased risk for celiac disease: an incident case-referent study. BMC Pediatr. 2012;12:194. doi:10.1186/1471-2431-12-194
29. Hendley JO. Clinical practice. Otitis media. N Engl J Med. 2002;347(15):1169–1174. doi:10.1056/NEJMcp010944
30. Mårild K, Ye W, Lebwohl B, et al. Antibiotic exposure and the development of coeliac disease: a nationwide case-control study. BMC Gastroenterol. 2013;13:109. doi:10.1186/1471-230X-13-109
31. Sander SD, Nybo Andersen AM, Murray JA, Karlstad Ø, Husby S, Størdal K. Association between antibiotics in the first year of life and celiac disease. Gastroenterology. 2019;pii: S0016-5085(19):32507. doi:10.1053/j.gastro.2019.02.039
32. Kemppainen KM, Vehik K, Lynch KF, et al. Association between early-life antibiotic use and the risk of islet or celiac disease autoimmunity. JAMA Pediatr. 2017;171(12):1217–1225. doi:10.1001/jamapediatrics.2017.2905
33. Bittker SS, Bell KR. Acetaminophen, antibiotics, ear infection, breastfeeding, vitamin D drops, and autism: an epidemiological study. Neuropsychiatr Dis Treat. 2018;14:1399–1414. doi:10.2147/NDT.S158811
34. American Academy of Pediatrics. Caring for Your Baby and Young Child – Birth to Age 5.
35. Gartner LM, Morton J, Lawrence RA, et al. Breastfeeding and the use of human milk. Pediatrics. 2005;115(2):496–506. doi:10.1542/peds.2004-2491
36. Wagner CL, Greer FR. Prevention of rickets and vitamin D deficiency in infants, children, and adolescents. Pediatrics. 2008;122(5):1142–1152. doi:10.1542/peds.2008-1862
37. National Institute of Health, Office of Dietary Supplements. Vitamin D fact sheet for consumers. Available from: https://ods.od.nih.gov/factsheets/VitaminD-Consumer/.
38. Roy A, Pallai M, Lebwohl B, Taylor AK, Green PH. Attitudes toward genetic testing for celiac disease. J Genet Couns. 2015;25(2):270–278. doi:10.1007/s10897-015-9867-z
39. Elli L, Branchi F, Tomba C, et al. Diagnosis of gluten related disorders: celiac disease, wheat allergy and non-celiac gluten sensitivity. World J Gastroenterol. 2015;21(23):7110–7119. doi:10.3748/wjg.v21.i23.7110
40. Fasano A, Sapone A, Zevallos V, Schuppan D. Nonceliac gluten sensitivity. Gastroenterology. 2015;148(6):1195–1204. doi:10.1053/j.gastro.2014.12.049
41. Bozdogan H. Model selection and Akaike’s Information Criterion (AIC): the general theory and its analytical extensions. Psychometrika. 1987;52(3):345–370. doi:10.1007/BF02294361
42. Singh P, Arora S, Lal S, Strand TA, Makharia GK. Risk of celiac disease in the first- and second-degree relatives of patients with celiac disease: a systematic review and meta-analysis. Am J Gastroenterol. 2015;110(11):1539–1548. doi:10.1038/ajg.2015.296
43. Rubio-Tapia A, Ludvigsson JF, Brantner TL, Murray JA, Everhart JE. The prevalence of celiac disease in the United States. Am J Gastroenterol. 2012;107(10):1538–1544. doi:10.1038/ajg.2012.219
44. Infante-Rivard C, Jacques L. Empirical study of parental recall bias. Am J Epidemiol. 2000;152(5):480–486. doi:10.1093/aje/152.5.480
45. Vrijheid M, Armstrong BK, Bédard D, et al. Recall bias in the assessment of exposure to mobile phones. J Expo Sci Environ Epidemiol. 2009;19(4):369–381. doi:10.1038/jes.2008.27
46. Mackenzie SG, Lippman A. An investigation of report bias in a case-control study of pregnancy outcome. Am J Epidemiol. 1989;129(1):65–75. doi:10.1093/oxfordjournals.aje.a115125
47. Ercolini AM, Miller SD. The role of infections in autoimmune disease. Clin Exp Immunol. 2009;155(1):1–15. doi:10.1111/j.1365-2249.2008.03834.x
48. Yassour M, Vatanen T, Siljander H, et al. Natural history of the infant gut microbiome and impact of antibiotic treatment on bacterial strain diversity and stability. Sci Transl Med. 2016;8(343):343ra81. doi:10.1126/scitranslmed.aad0917
49. Skripak JM, Matsui EC, Mudd K, Wood RA. The natural history of IgE-mediated cow’s milk allergy. J Allergy Clin Immunol. 2007;120(5):1172–1177. doi:10.1016/j.jaci.2007.08.023
50. Ziegler EE. Consumption of cow’s milk as a cause of iron deficiency in infants and toddlers. Nutr Rev. 2011;69(Suppl 1):S37–42. doi:10.1111/j.1753-4887.2011.00431.x
51. Centers for Disease Control and Prevention. Breastfeeding: why it matters. Available from: https://www.cdc.gov/breastfeeding/about-breastfeeding/why-it-matters.html.
52. Surgeon General of the United States. The surgeon general’s call to action to support breastfeeding. Available from: https://www.surgeongeneral.gov/library/calls/breastfeeding/factsheet.html.
53. Vitamin D Council. Vitamin D during pregnancy and breastfeeding. Available from: https://www.vitamindcouncil.org/vitamin-d-during-pregnancy-and-breastfeeding/.
54. Morgan DL. The SAGE Encyclopedia of Qualitative Research Methods. Thousand Oaks, CA: SAGE Publications, Inc; 2008:816–817.
55. Epifanio MS, Genna V, Vitello MG, Roccella M, La Grutta S. Parenting stress and impact of illness in parents of children with coeliac disease. Pediatr Rep. 2013;5(4):e19. doi:10.4081/pr.2013.e19
56. Crocker H, Jenkinson C, Peters M. Quality of life in coeliac disease: qualitative interviews to develop candidate items for the Coeliac Disease Assessment Questionnaire. Patient Relat Outcome Meas. 2018;9:211–220. doi:10.2147/PROM.S149238
57. Paarlahti P, Kurppa K, Ukkola A, et al. Predictors of persistent symptoms and reduced quality of life in treated coeliac disease patients: a large cross-sectional study. BMC Gastroenterol. 2013;13:75. doi:10.1186/1471-230X-13-75
58. Atkinson R, Flint J. Encyclopedia of Social Science Research Methods. Thousand Oaks, CA: SAGE Publications, Inc; 2004:1044–1045.
59. Etter JF, Perneger TV. Snowball sampling by mail: application to a survey of smokers in the general population. Int J Epidemiol. 2000;29(1):43–48. doi:10.1093/ije/29.1.43
60. Gyarmathy VA, Johnston LG, Caplinskiene I, Caplinskas S, Latkin CA. A simulative comparison of respondent driven sampling with incentivized snowball sampling–the “strudel effect”. Drug Alcohol Depend. 2014;135:71–77. doi:10.1016/j.drugalcdep.2013.11.020
61. Lopes CS, Rodrigues LC, Sichieri R. The lack of selection bias in a snowball sampled case-control study on drug abuse. Int J Epidemiol. 1996;25(6):1267–1270. doi:10.1093/ije/25.6.1267
62. Murray JA, Van Dyke C, Plevak MF, Dierkhising RA, Zinsmeister AR, Melton LJ
63. Jansson-Knodell CL, King KS, Larson JJ, Van Dyke CT, Murray JA, Rubio-Tapia A. Gender-based differences in a population-based cohort with celiac disease: more alike than unalike. Dig Dis Sci. 2018;63(1):184–192. doi:10.1007/s10620-017-4835-0
64. US Census Bureau. Educational Attainment in the United States: 2017. Available from: https://www.census.gov/data/tables/2017/demo/education-attainment/cps-detailed-tables.html.
65. Fisher BD, Strogatz DS. Community measures of low-fat milk consumption: comparing store shelves with households. Am J Public Health. 1999;89(2):235–237.
66. Sandrou DK, Arvanitoyannis IS. Low-fat/calorie foods: current state and perspectives. Crit Rev Food Sci Nutr. 2000;40(5):427–447. doi:10.1080/10408690091189211
67. Namatovu F, Olsson C, Lindkvist M, et al. Maternal and perinatal conditions and the risk of developing celiac disease during childhood. BMC Pediatr. 2016;16:77. doi:10.1186/s12887-016-0613-y
68. Reilly NR, Aguilar K, Hassid BG, et al. Celiac disease in normal-weight and overweight children: clinical features and growth outcomes following a gluten-free diet. J Pediatr Gastroenterol Nutr. 2011;53(5):528–531. doi:10.1097/MPG.0b013e3182276d5e
69. Gould BW. Factors affecting U.S. demand for reduced-fat fluid milk. Jstor. 1996;21(1):68–81.
70. Cohen SA, Hendricks KM, Eastham EJ, Mathis RK, Walker WA. Chronic nonspecific diarrhea A complication of dietary fat restriction. Am J Dis Child. 1979;133(5):490–492.
71. Koopman JS, Turkisk VJ, Monto AS, Thompson FE, Isaacson RE. Milk fat and gastrointestinal illness. Am Journal Public Health. 1984;74(12):1371–1373. doi:10.2105/AJPH.74.12.1371
72. Enns CW, Mickle SJ, Goldman JD. Trends in food and nutrient intakes by children in the United States. Fam Econ Rev. 2002;14(2):56.
73. Rewers M. Epidemiology of celiac disease: what are the prevalence, incidence, and progression of celiac disease? Gastroenterology. 2005;128(4Suppl 1):S47–51. https://doi.org/10.1053/j.gastro.2005.02.030
74. Størdal K, Haugen M, Brantsæter AL, Lundin KE, Stene LC. Association between maternal iron supplementation during pregnancy and risk of celiac disease in children. Clin Gastroenterol Hepatol. 2014;12(4):
75. Jang J, Tamura RN, Aronsson CA, et al. Maternal use of dietary supplements during pregnancy is not associated with coeliac disease in the offspring: the Environmental Determinants of Diabetes in the Young (TEDDY) study. Br J Nutr. 2017;117(3):466–472. doi:10.1017/S0007114517000332
76. Yu SM, Kogan MD, Gergen P. Vitamin-mineral supplement use among preschool children in the United States. Pediatrics. 1997;100(5):E4. doi:10.1542/peds.100.5.e4
77. Deora V, Aylward N, Sokoro A, El-Matary W. Serum vitamins and minerals at diagnosis and follow-up in children with celiac disease. J Pediatr Gastroenterol Nutr. 2017;65(2):185–189. doi:10.1097/MPG.0000000000001475
78. Sategna-Guidetti C, Grosso SB, Grosso S, et al. The effects of 1-year gluten withdrawal on bone mass, bone metabolism and nutritional status in newly-diagnosed adult coeliac disease patients. Aliment Pharmacol Ther. 2000;14(1):35–43. doi:10.1046/j.1365-2036.2000.00671.x
79. Valdimarsson T, Toss G, Löfman O, Ström M. Three years’ follow-up of bone density in adult coeliac disease: significance of secondary hyperparathyroidism. Scand J Gastroenterol. 2000;35(3):274–280.
80. Kochhar GS, Singh T, Gill A, Kirby DF. Celiac disease: managing a multisystem disorder. Cleve Clin J Med. 2016;83(3):217–227. doi:10.3949/ccjm.83a.14158
81. Mooney PD, Hadjivassiliou M, Sanders DS. Coeliac disease. Bmj. 2014;348:g1561. doi:10.1136/bmj.g1561
82. Matheu V, Bäck O, Mondoc E, Issazadeh-Navikas S. Dual effects of vitamin D-induced alteration of TH1/TH2 cytokine expression: enhancing IgE production and decreasing airway eosinophilia in murine allergic airway disease. J Allergy Clin Immunol. 2003;112(3):585–592. doi:10.1016/S0091-6749(03)01855-4
83. Ghaly S, Kaakoush NO, Lloyd F, et al. High Dose Vitamin D supplementation alters faecal microbiome and predisposes mice to more severe colitis. Sci Rep. 2018;8(1):11511. doi:10.1038/s41598-018-29759-y
84. Chavhan SG, Brar RS, Banga HS, et al. Clinicopathological studies on vitamin D(3) toxicity and therapeutic evaluation of aloe vera in rats. Toxicol Int. 2011;18(1):35–43. doi:10.4103/0971-6580.75851
85. Jacobus CH, Holick MF, Shao Q, Chen TC, Holm IA, Kolodny JM, Fuleihan GE, Seely EW.Hypervitaminosis D associated with drinking milk. N Engl J Med. 1992;326:1173–1177. doi:10.1056/NEJM199204303261801
86. Crew KD, Xiao T
87. Corazza GR, Di Sario A, Cecchetti L, et al. Bone mass and metabolism in patients with celiac disease. Gastroenterology. 1995;109(1):122–128. doi:10.1016/0016-5085(95)90276-7
88. Corazza GR, Di Sario A, Cecchetti L, et al. Influence of pattern of clinical presentation and of gluten-free diet on bone mass and metabolism in adult coeliac disease. Bone. 1996;18(6):525–530. doi:10.1016/8756-3282(96)00071-3
89. Selby PL, Davies M, Adams JE, Mawer EB. Bone loss in celiac disease is related to secondary hyperparathyroidism. J Bone Miner Res. 1999;14(4):652–657. doi:10.1359/jbmr.1999.14.4.652
90. Kalayci AG, Kansu A, Girgin N, Kucuk O, Aras G. Bone mineral density and importance of a gluten-free diet in patients with celiac disease in childhood. Pediatrics. 2001;108(5):E89. doi:10.1542/peds.108.5.e89
91. Puri AS, Garg S, Monga R, Tyagi P, Saraswat MK. Spectrum of atypical celiac disease in North Indian children. Indian Pediatr. 2004;41(8):822–827.
92. Krupa-Kozak U. Pathologic bone alterations in celiac disease: etiology, epidemiology, and treatment. Nutrition. 2014;30(1):16–24. doi:10.1016/j.nut.2013.05.027
93. Brenza HL, Kimmel-Jehan C, Jehan F, et al. Parathyroid hormone activation of the 25-hydroxyvitamin D3-1alpha-hydroxylase gene promoter. Proc Natl Acad Sci USA. 1998;95(4):1387–1391. doi:10.1073/pnas.95.4.1387
94. Zingone F, Ciacci C. The value and significance of 25(OH) and 1,25(OH) vitamin D serum levels in adult coeliac patients: A review of the literature. Dig Liver Dis. 2018;50(8):757–760. doi:10.1016/j.dld.2018.04.005
95. Mautalen C, González D, Mazure R, et al. Effect of treatment on bone mass, mineral metabolism, and body composition in untreated celiac disease patients. Am J Gastroenterol. 1997;92(2):313–318.
96. Moosgaard B, Vestergaard P, Heickendorff L, Mosekilde L. Plasma 1,25-dihydroxyvitamin D levels in primary hyperparathyroidism depend on sex, body mass index, plasma phosphate and renal function. Clin Endocrinol (Oxf). 2007;66(1):35–42. doi:10.1111/j.1365-2265.2006.02680.x
97. Ludvigsson JF, Kämpe O, Lebwohl B, Green PH, Silverberg SJ, Ekbom A. Primary hyperparathyroidism and celiac disease: a population-based cohort study. J Clin Endocrinol Metab. 2012;97(3):897–904. doi:10.1210/jc.2011-2639
98. Maida MJ, Praveen E, Crimmins SR, Swift GL. Coeliac disease and primary hyperparathyroidism: an association? Postgrad Med J. 2006;82(974):833–835. https://doi.org/10.1136/pgmj.2006.045500
99. Garabédian M, Jacqz E, Guillozo H, et al. Elevated plasma 1,25-dihydroxyvitamin D concentrations in infants with hypercalcemia and an elfin facies. N Engl J Med. 1985;312(15):948–952. doi:10.1056/NEJM198504113121503
100. Barnett C, Krebs JE. WSTF does it all: a multifunctional protein in transcription, repair, and replication. Biochem Cell Biol. 2011;89(1):12–23. doi:10.1139/O10-114
101. Giannotti A, Tiberio G, Castro M, et al. Coeliac disease in Williams syndrome. J Med Genet. 2001;38(11):767–768. https://dx.doi.org/10.1136%2Fjmg.38.11.767
102. Ralph AP, Rashid Ali MRS, William T, et al. Vitamin D and activated vitamin D in tuberculosis in equatorial Malaysia: a prospective clinical study. BMC Infect Dis. 2017;17(1):312. https://doi.org/10.1186/s12879-017-2314-z
103. Ludvigsson JF, Wahlstrom J, Grunewald J, Ekbom A, Montgomery SM. Coeliac disease and risk of tuberculosis: a population based cohort study. Thorax. 2007;62(1):23–28. doi:10.1136/thx.2006.059451
104. Zittermann A, Ernst JB, Birschmann I, Dittrich M. Effect of vitamin D or activated vitamin d on circulating 1,25-dihydroxyvitamin d concentrations: a systematic review and metaanalysis of randomized controlled trials. Clin Chem. 2015;61(12):1484–1494. doi:10.1373/clinchem.2015.244913
105. Simon AK, Hollander GA, McMichael A. Evolution of the immune system in humans from infancy to old age. Proc Biol Sci. 2015;282(1821):20143085. doi:10.1098/rspb.2014.3085
106. Hypponen E, Sovio U, Wjst M, Patel S, Pekkanen J. Hartikainen AL and Jarvelinb MR. Infant vitamin d supplementation and allergic conditions in adulthood: northern Finland birth cohort 1966. Ann N Y Acad Sci. 2004;1037:84–95. doi:10.1196/annals.1337.013
107. Milner JD, Stein DM, McCarter R, Moon RY. Early infant multivitamin supplementation is associated with increased risk for food allergy and asthma. Pediatrics. 2004;114(1):27–32. doi:10.1542/peds.114.1.27
108. Back O, Blomquist HK, Hernell O, Stenberg B. Does vitamin D intake during infancy promote the development of atopic allergy? Acta Derm Venereol. 2009;89(1):28–32. doi:10.2340/00015555-0541
109. Nja F, Nystad W, Lodrup Carlsen KC, Hetlevik O, Carlsen KH. Effects of early intake of fruit or vegetables in relation to later asthma and allergic sensitization in school-age children. Acta Paediatr. 2005;94(2):147–154. doi:10.1111/j.1651-2227.2005.tb01882.x
110. Ress K, Annus T, Putnik U, Luts K, Uibo R, Uibo O. Celiac disease in children with atopic dermatitis. Pediatr Dermatol. 2014;31(4):483–488. doi:10.1111/pde.12372
111. Ludvigsson JF, Hemminki K, Wahlstrom J, Almqvist C. Celiac disease confers a 1.6-fold increased risk of asthma: a nationwide population-based cohort study. J Allergy Clin Immunol. 2011;127(4):1071–1073. doi:10.1016/j.jaci.2010.12.1076
112. Sollid LM, Jabri B. Triggers and drivers of autoimmunity: lessons from coeliac disease. Nat Rev Immunol. 2013;13(4):294–302. doi:10.1038/nri3407
113. Korpela K, Salonen A, Virta LJ, et al. Intestinal microbiome is related to lifetime antibiotic use in Finnish pre-school children. Nat Commun. 2016;7:10410. doi:10.1038/ncomms10410
114. Schippa S, Iebba V, Barbato M, et al. A distinctive ‘microbial signature’ in celiac pediatric patients. BMC Microbiol. 2010;10:175. doi:10.1186/1471-2180-10-175
115. De Palma G, Nadal I, Medina M, et al. Intestinal dysbiosis and reduced immunoglobulin-coated bacteria associated with coeliac disease in children. BMC Microbiol. 2010;10:63. doi:10.1186/1471-2180-10-63
116. Hård Af Segerstad EM, Hs L, Andrén AC, et al. Daily intake of milk powder and risk of celiac disease in early childhood: a nested case-control study. Nutrients. 2018;10(5):
 © 2019 The Author(s). This work is published and licensed by Dove Medical Press Limited. The
full terms of this license are available at https://www.dovepress.com/terms
and incorporate the Creative Commons Attribution
- Non Commercial (unported, 3.0) License.
By accessing the work you hereby accept the Terms. Non-commercial uses of the work are permitted
without any further permission from Dove Medical Press Limited, provided the work is properly
attributed. For permission for commercial use of this work, please see paragraphs 4.2 and 5 of our Terms.
© 2019 The Author(s). This work is published and licensed by Dove Medical Press Limited. The
full terms of this license are available at https://www.dovepress.com/terms
and incorporate the Creative Commons Attribution
- Non Commercial (unported, 3.0) License.
By accessing the work you hereby accept the Terms. Non-commercial uses of the work are permitted
without any further permission from Dove Medical Press Limited, provided the work is properly
attributed. For permission for commercial use of this work, please see paragraphs 4.2 and 5 of our Terms.