Back to Journals » Clinical and Experimental Gastroenterology » Volume 13
Poor Quality of Small Bowel Capsule Endoscopy Images Has a Significant Negative Effect in the Diagnosis of Small Bowel Malignancy
Authors Yung DE, Plevris JN ![]() , Leenhardt R, Dray X
, Leenhardt R, Dray X ![]() , Koulaouzidis A
, Koulaouzidis A ![]()
Received 19 May 2020
Accepted for publication 14 September 2020
Published 21 October 2020 Volume 2020:13 Pages 475—484
DOI https://doi.org/10.2147/CEG.S260906
Checked for plagiarism Yes
Review by Single anonymous peer review
Peer reviewer comments 3
Editor who approved publication: Professor Andreas M. Kaiser
Diana E Yung,1 John N Plevris,1 Romain Leenhardt,2 Xavier Dray,2 Anastasios Koulaouzidis1 On behalf of the ESGE Small Bowel Research Working Group
1Centre for Liver and Digestive Disorders, The Royal Infirmary of Edinburgh, Edinburgh, UK; 2Sorbonne University, Endoscopy Unit, APHP Saint-Antoine Hospital, Paris, France
Correspondence: Anastasios Koulaouzidis
Endoscopy Unit, The Royal Infirmary of Edinburgh, 51 Little France Crescent, Edinburgh EH16 4SA, UK
Email [email protected]
Background and Aims: Capsule endoscopy (CE) is a visual modality; hence, diagnosis relies on image quality. We studied the contribution of image parameters to visualization quality and their effect on diagnostic certainty of small bowel (SB) lesions.
Methods: Five clear CE images of common SB pathology – two vascular lesions, two inflammatory, one polyp – were processed for three image parameters to simulate poor SB conditions: opacity (color-matched to luminal content; 10– 90%, 10% increments); blurriness (radius 1– 10 pixels; one pixel increments); and contrast (− 50-50%; 10% increments). Nine expert readers evaluated whether images were adequate for diagnosis. Points where perception of image quality changed significantly were determined for each parameter. Three further sets of SBCE images (vascular, inflammatory, and neoplastic lesions; nine images/set) were processed for four points/parameters. Twenty experienced/expert CE readers reviewed these images.
Results: The negative effects of opacity in diagnostic certainty were mostly evident in images of neoplasia; images of vascular and inflammatory lesions were less affected. Similar results were observed with increasing blur radius, simulating movement, and poor focus. The proportions of readers finding vascular and inflammatory images adequate for diagnosis did not drop significantly at wider blur radii, while images of neoplasia were quickly deemed inadequate. Low contrast had a greater negative effect than high, most consistently in neoplastic lesions.
Conclusion: Poor visualization quality in all parameters affected mostly neoplastic lesions. Software to increase contrast and sharpen images can improve visualization quality; smart frame rate adaptation could improve the number of high-quality frames obtained. Thoroughness in SB cleansing is most important when there is a suspicion of neoplasia.
Keywords: capsule endoscopy, small bowel, image quality, diagnosis, neoplasia, software
Introduction
Capsule endoscopy (CE) is at present an entirely visual diagnostic tool which is therefore highly reliant on image quality. However, image quality depends on several factors ranging from hardware (camera ability), software (image processing ability), and patient factors including bowel preparation and gut motility. Although there is a paucity of evidence by way of peer-reviewed studies, it is perhaps intuitive that optimizing visualization quality should have a positive effect on diagnostic accuracy and certainty.
At present, there is no widely-accepted method for quantifying visualization quality in CE reporting. A few studies have been carried out attempting to standardize the grading of small bowel (SB) preparation and establish a universal grading score, but none so far have been widely adopted in clinical practice.1 Efforts have also been limited by the wide variety of proprietary capsule reading/reporting software on the market, which hampers attempts at standardization.
In this study, we attempted to examine the contribution of various image parameters to visualization quality and their effect on certainty of diagnosis of small bowel lesions. The use of image parameters may aid standardization in the reporting of small bowel visualization quality as these general parameters are common across image processing, transcending the range of proprietary software.
Methods
Phase 1: Initial Pilot Study
Five (n=5) clear CE images of common SB pathology were selected: a P1 angioectasia; P2 angioectasia ulcer; aphtha; and, malignant polyp.2 These images were deemed “clear” and unambiguous by two expert CE reviewers at our center (The Royal Infirmary of Edinburgh, Scotland, UK), and standardized to a resolution of 320x320 pixels (px). Each image was processed for three parameters using the GNU Image Manipulation Program (GIMP) v2.10.8 (www.gimp.org) image processing software:
- Opacity: The color of the mask filter was color-matched to that of luminal content from a clearly poorly-prepared CE video, to simulate the effects of large amounts of luminal debris. For each image, nine processed images were obtained using color masks overlying the original “clear” image, set at opacities of 10–90% in 10% increments; this yielded a set of 45 processed images.
- Blurriness: A Gaussian blur was chosen to simulate the effects of movement, therefore approximating both poor focus and the effects of rapid movement of the capsule through the bowel. For each image, 10 processed images were obtained using blur radius 1–10px in 1px increments; this set therefore consisted of 50 processed images.
- Contrast: Contrast was chosen as a parameter as this adjustment is common across most commercial capsule reporting software. For each image, 10 processed images –from −50% contrast to +50% in 10% increments – were obtained, obtaining a set of 50 processed images.
The images obtained are shown in Figure 1.
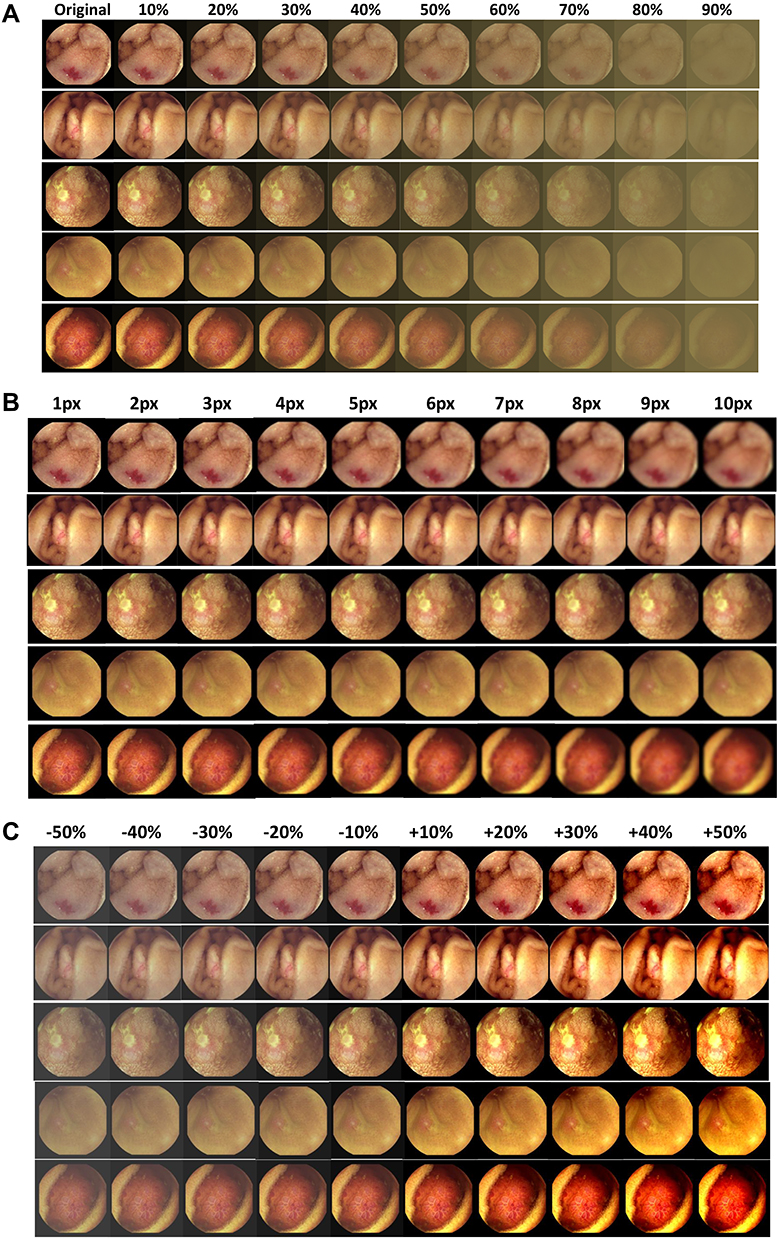 |
Figure 1 Image set used for the pilot study (Phase 1). (A) Image set used for pilot study – edited for opacity; original images also shown. (B) Image set for pilot study – edited for blur radius. (C) Image set for pilot study – edited for contrast. |
A group of nine expert readers from several centers were asked to review the resulting set of five original and 145 processed images, which were presented to them in random order using an online survey platform. For each image, reviewers were asked to evaluate whether it was adequate (or not) for diagnostic purposes, ie, from the image, could they be sure of the diagnosis. Based on the percentage of reviewers deeming each image adequate or otherwise, four points where perception of image quality changed significantly were determined for each parameter.
Phase 2: Validation
Common SB lesions were classified into three main types: vascular, inflammatory, and neoplastic/possibly malignant. Therefore, three further sets of nine clear images each were obtained; all these images were deemed “acceptable” by the same two expert CE readers as above. The images of vascular lesions were obtained from the same set as used in a recent study by Leenhardt et al,3 who have established a consensus on the nomenclature of vascular lesions seen on SBCE;this was an additional step to ensure that the starting images for this phase of the study had already been deemed “clear” by a group of expert CE readers based across multiple centers.
Based on the findings of the pilot study, each of the images in this new set was processed for four points per parameter as above. This resulted in a second set of 27 original and 108 adjusted images, detailed in Figure 2. Twenty experienced-expert CE readers reviewed the resulting images using an identical setup to the first phase. Results from each group of images (ie, each type of pathology) were pooled and the mean percentages of readers finding each image adequate, with standard deviation (SD), were used to examine results. Following discussion with the local ethics committee the study was exempt from further review as it did not include patients, intervention, or any identifiable data.
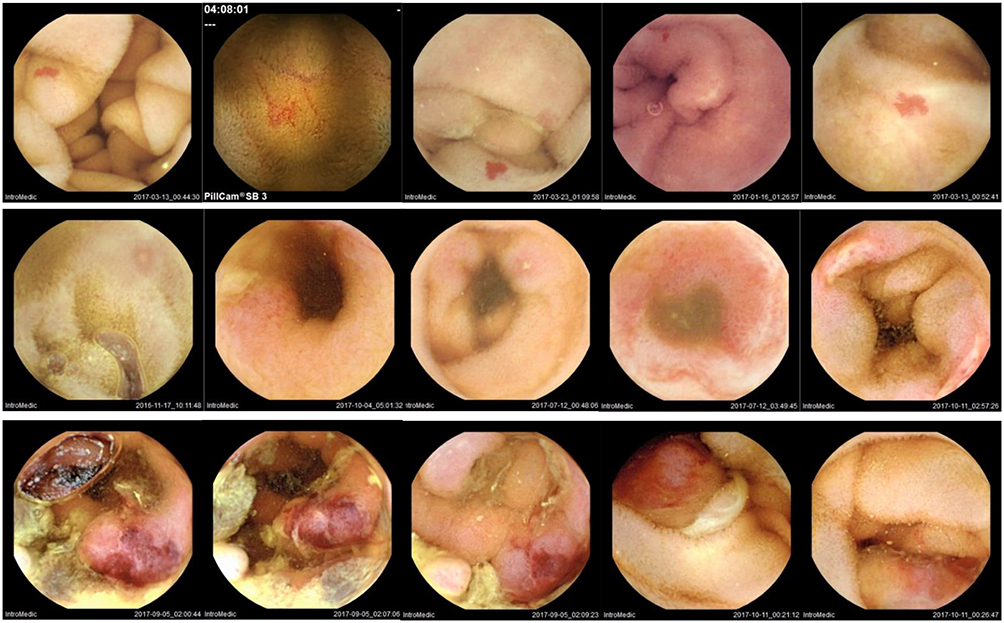 |
Figure 2 Some of the original images used in Phase 2. Top row: vascular lesions; middle row: inflammatory lesions; bottom row: neoplastic lesions. |
Results
Phase 1: Pilot Study
For image opacity, both angioectasias and the polypoid lesion were considered adequately visualized below 40% opacity, whereas the threshold was lower for both the ulcer and aphtha (10% opacity). Increasing blur radius significantly impacted the acceptability of images for reaching a diagnosis with confidence; for most images, blur radius 3px was the threshold for adequate visualization but even 1px of blur radius decreased the visualization quality of the aphtha image. The aphtha image was also affected the most by decreased contrast; conversely the ulcer was deemed more inadequately visualized with higher contrast. The other images were generally adequately visualized at ±10% contrast.
Results are summarized in Figure 3, which shows the percentage of expert CE readers who found each image adequate for diagnostic purposes, for each of the parameters examined.
 |
Figure 3 Continued. |
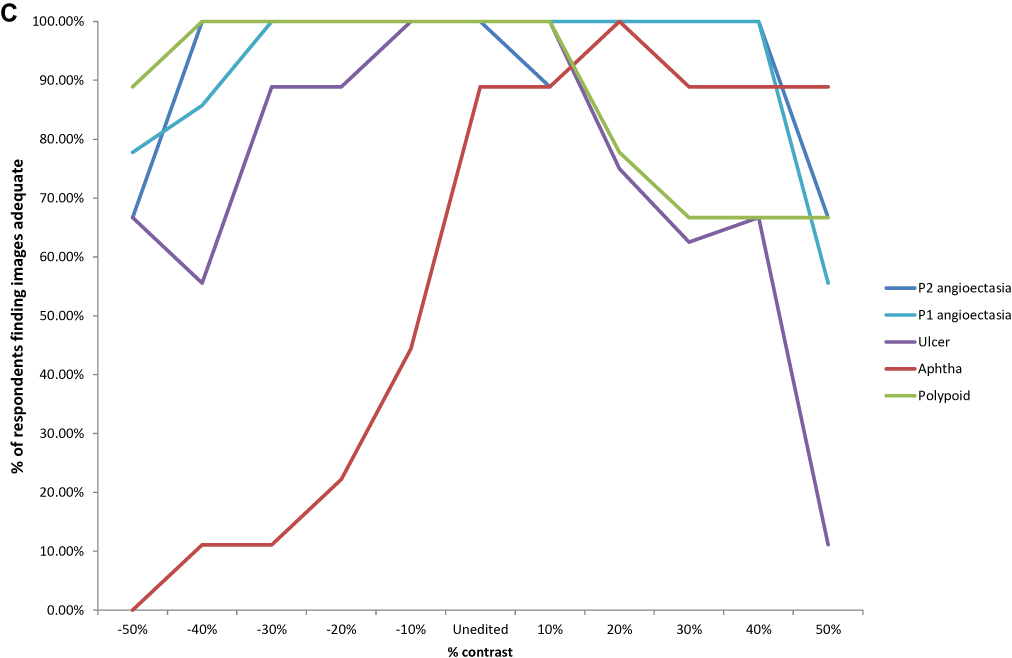 |
Figure 3 Results from pilot study. (A) Percentage of readers who found each image diagnostically adequate – opacity. (B) Percentage of readers who found each image diagnostically adequate – blur radius. (C) Percentage of readers who found each image diagnostically adequate – contrast. |
Phase 2: Validation of Results from Pilot Study
In vascular and inflammatory lesions, diagnostic certainty was least affected by increasing image opacity, requiring opacities >90% before most readers considered images inadequate for diagnosis. The greatest negative effects of image opacity were seen in neoplastic lesions where significantly fewer readers found images adequate at >50% opacity. In general, the spread of responses as demonstrated by the error bars in the images in Figure 4 as well as standard deviations in Table 1 was greater for both vascular and inflammatory lesions compared to neoplastic ones.
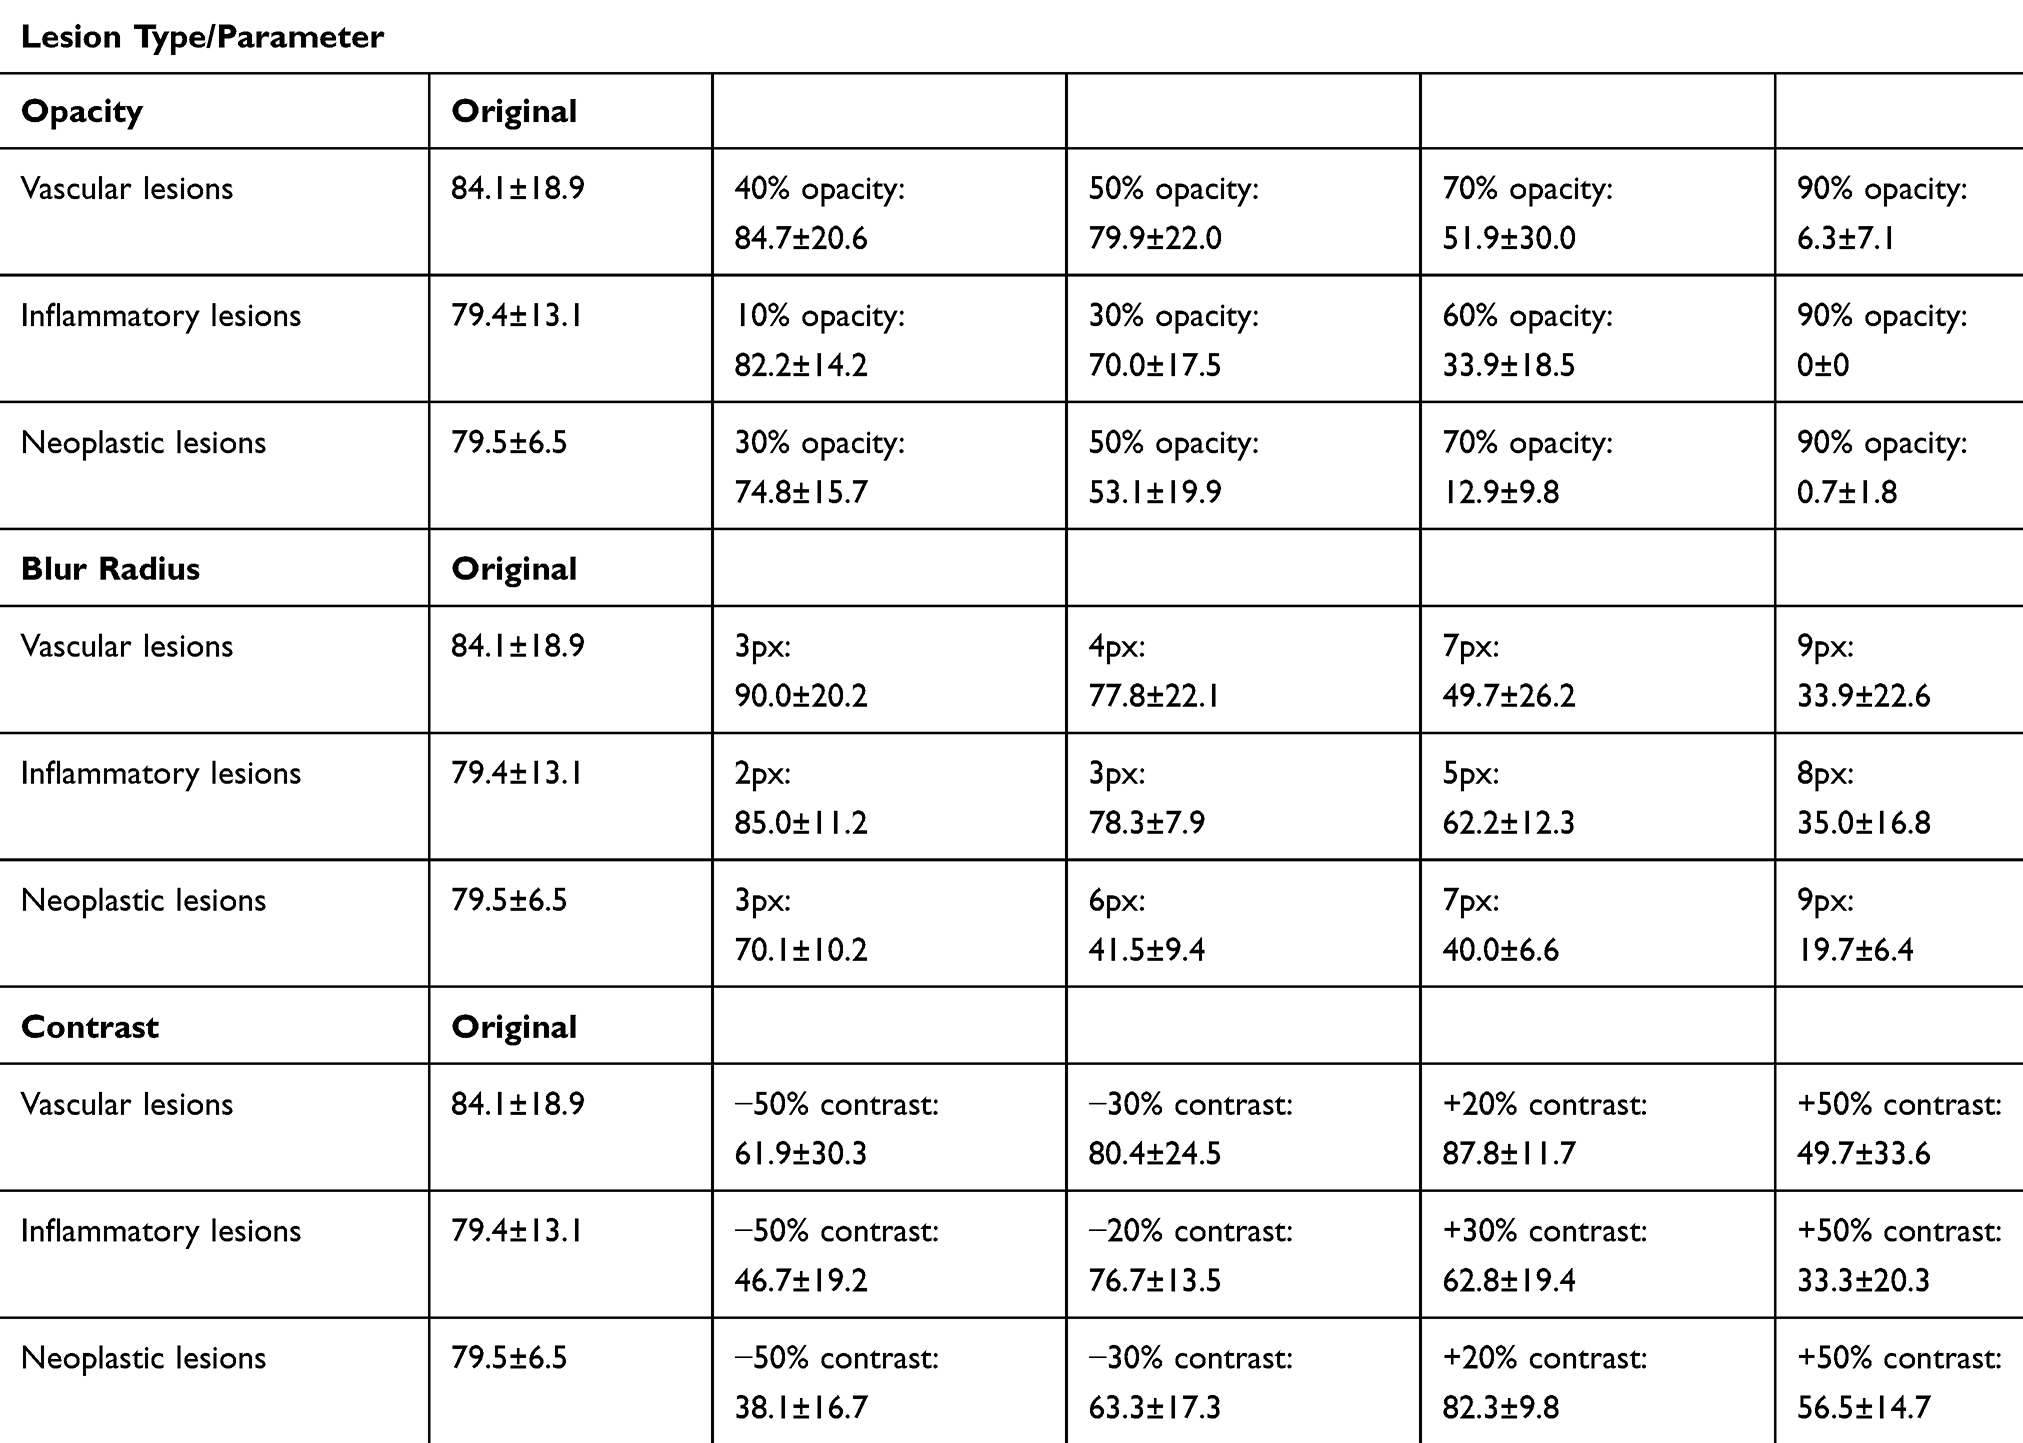 |
Table 1 Mean±SD of the Percentage of Reviewers Who Found Images in Each Type of Pathology Adequate for Diagnostic Purposes |
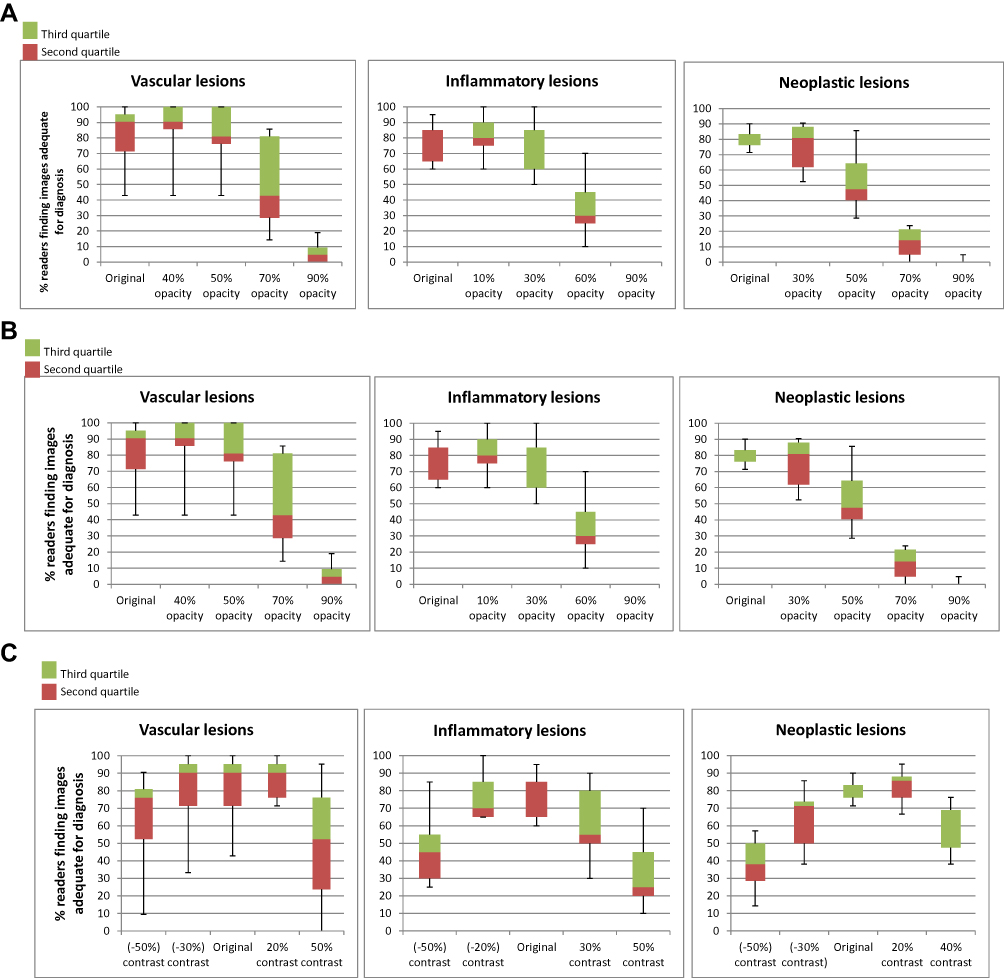 |
Figure 4 Results from Phase 2 of study. (A) Effects of increasing opacity in Phase 2, shown as median and spread of responses for each set of lesions. (B) Effects of increasing blur radius in Phase 2, shown as median and spread of responses for each set of lesions. (C) Effects of decreasing and increasing contrast in Phase 2, shown as median and spread of responses for each set of lesions. |
Similar results were obtained with increasing blur radius, simulating the effects of motion blur from segments of rapid small bowel transit and poor focus. The proportions of readers finding vascular and inflammatory images adequate for diagnosis did not drop significantly at wider blur radii, while the proportion who found images of malignancies diagnostically adequate dropped at blur radius 6px. Once again, the spread of responses was greatest in the set of vascular lesions and responses were most cohesive for neoplastic lesions.
Decreasing contrast had a greater negative effect than raised contrast, most obvious in the set of neoplastic lesions. Responses from the group of reviewers were markedly less cohesive for vascular lesions compared to inflammatory and neoplastic ones. Results are summarized in Table 1 and Figure 4.
Discussion
The diagnostic accuracy and utility of a CE examination hinges on image quality. Current CE guidelines recommend that image quality is recorded when reporting CE.4 At present, however, there are few validated scales which have been developed to quantify image quality in CE. Furthermore, these scales are not in wide use and have not been subjected to more widespread testing and adoption; they also tend to be based on subjective parameters.1,5 This creates discrepancy and a degree of uncertainty when reporting CE, for both clinical and research purposes.
Image quality is affected not only by luminal conditions but also the hardware of CE systems themselves. The majority of available literature concentrates on quality of bowel preparation,6,7 perhaps because clinicians have some control over these factors. At present, there is little which examines the effect of hardware or software on image visualization in the clinical or real-world context. Nevertheless, it is important for technology to be developed with the end-user in mind. Much of the current CE image-processing technology is developed by the manufacturers and then tested by clinicians; involving clinicians in the development process could well be more efficient and effective.
A few studies exist pitting different capsule models against each other, to assess the effects of hardware and software improvements. A 2016 study by Monteiro et al8 compared the PillCam® SB2 to SB3, finding that the improved image resolution and faster variable frame rate increased duodenal papilla detection rates from 24% to 42.7%. Kim et al9 compared the PillCam® to Mirocam. A small group of patients underwent simultaneous 2-capsule CE. Capsule reviewers achieved an agreement rate of 70%, implying that just under a third of patients had different findings between the two models of capsule. In another study by Omori et al,10 the use of the 3rd-generation PillCam® SB3 was found to reduce the time burden for both expert and inexperienced readers. The authors propose that this was due to an improved software algorithm for adaptive frame rate and improved image resolution.
Therefore, this study represents a conscious attempt to “work backwards”, starting from images deemed adequate by expert CE readers and adjusting them in a stepwise manner until a point where the majority of readers felt these images were inadequate for diagnostic purposes. Our results show that image sharpness may have more effect than opacity, especially in the diagnosis of potentially malignant small bowel lesions. A relatively high level of image opacity was “tolerated” by our group of CE readers, whereas blurriness seems to have a greater impact on visualization quality and reviewer confidence in the diagnosis. Furthermore, there was greater agreement amongst the reviewers about overall image quality in the neoplastic images compared to vascular lesions.
In combination with the aforementioned studies, this implies that software algorithms (such as adaptive frame rate) and hardware improvements (such as camera resolution) which are able to obtain more and sharper images, despite variations in bowel motility, would help to provide capsule readers with better quality images and aid diagnosis. Software which is able to adjust images already obtained, eg, by sharpening images or adjusting contrast to improve visualization, could also be of use. Increased diagnostic certainty based on higher-quality capsule images could reduce reading time and therefore burden on capsule readers; higher quality images could further improve the development of and confidence in computer-aided diagnostic software. Interestingly, at present there is no “zoom” function available in CE – this is perhaps an area for further development and study.
Currently, existing attempts to develop computer-based automated bowel preparation grading systems have been based mainly on the overall color of frames5 or on the percentage of the lumen which has been obscured by debris and bubbles.11–13 These approaches can work well for approximating bowel segments or detecting gross abnormalities such as blood in the lumen,14 but do not take into account the effect of image sharpness and motion blur. Furthermore, the results of this study suggest that the quality of bowel preparation which can be tolerated differs according to clinical indication for the CE examination. For instance, CE carried out for suspected small bowel bleeding may not require as pristine a bowel lumen as one looking for the lesions of mucosal inflammation or subtle small bowel tumors. As far as we are aware, this is the first study which specifically examines the effect of image visualization quality on different types of small bowel pathology.
Limitations of this study are mostly related to the lack of existing data or previous work for comparison. Furthermore, our data set comprises only still frames, with a relatively limited sample size owing to the need to recruit expert CE readers and for them to critically scrutinize a large set of images. Interestingly there was still a large standard deviation indicating a wide variation in perception amongst these expert reviewers, even though they seemed to agree more for images of neoplastic lesions. Perhaps because the images selected for this study were not selected for subtlety, overall agreement was better amongst the neoplastic images, which were selected to be obvious and unambiguous, whereas in the second phase, a wider range of images of vascular and inflammatory lesions were used. Fewer data points for each parameter were included in the second phase, using four points for each image rather than the more detailed stepwise adjustments made in the first, pilot phase, in order to allow for a wider range of images to be examined.
In this study, poor visualization quality in all parameters examined – luminal opacity, blurriness, and contrast – had the greatest effect on diagnostic certainty of malignant lesions. Therefore, this implies that software to increase contrast and sharpen images or correct for poor focus can be used and developed to improve visualization quality; smart frame rate adaptation could also improve the number of high-quality frames obtained even with variations in bowel motility and transit times. Furthermore, the thoroughness of SB preparation is most important when CE is being carried out for suspected SB malignancy – greater care should be taken to obtain high-quality images for this indication.
Future applications of this data include the potential integration of the parameters investigated here with computer-assisted CE diagnostic or bowel preparation grading software. Further studies could also examine the effects of bowel visualization quality in colon CE; the contribution of image quality to diagnostic accuracy and certainty may be even greater in colon CE due to the increasing amounts of debris in the distal gastrointestinal tract, where one of the main indications of colon CE is to detect colonic malignancies.
Acknowledgments
On behalf of the ESGE Small Bowel Research Working Group (in alphabetical order): Hanneke Beaumont, Rami Eliakim, Pierre Ellul, Ignacio Fernandez-Urien, Gabriele Wurm Johanssen, Martin Keuchel, Uri Kopylov, Richard Makins, Bruno Mauro, Mark McAlindon, Diedre McNamara, Artur Nemeth, Simon Panter, Marco Pennazio, Enrique Perez Cuadrado R, Emanuele Rondonotti, Bruno Rosa, Jean-Christophe Saurin, Reena Sidhu, Christiano Spada, Ervin Toth, Konstatinos Triantafyllou, and Stefania Zammit. Work completed prior to August 2019.
Author Contributions
This study was designed, carried out and written up by DY with guidance from JP and AK. XD and RL contributed images from their separate study which has been alluded to in this one; and contributed to the discussion of this study. JP and AK supervised the process overall. All main (co)authors made a significant contribution to the work reported; have drafted or written, or substantially revised or critically reviewed the article; have agreed on the journal to which the article will be submitted; reviewed & agreed on all versions of the article before submission, during revision, the final version accepted for publication, and any significant changes introduced at the proofing stage and agreed to take responsibility and be accountable for the contents of the article.
The members of the ESGE Small Bowel Working Group have participated in the review and assessment of images.
Disclosure
The abstract of this paper was presented at the ESGE Days 2019 as an oral presentation. The abstract was published in Endoscopy Journal as supplement/ESGE Days2019 – abstract issue. Endoscopy 2019; 51: S1–S273. Dr Romain Leenhardt reports personal fees from Abbvie, Co founder and share Holder of Augmented Endoscopy, outside the submitted work.
Prof. Dr. Xavier Dray reports personal fees from Boston Scientific, personal fees from Fujifilm, personal fees from Alfasigma, personal fees from Norgine, personal fees from Pentax, personal fees from Medtronic, Founder and share-holder for Augmented Endoscopy, outside the submitted work. In addition, Prof. Dr. Xavier Dray has a patent Automatic Quality Classification of WCE images from Small Bowel according a computer-based score pending to EP18305275.2.
Dr Anastasios Koulaouzidis reports travel support from Jinshan and Aquilant, non-financial support from IntroMedic, outside the submitted work. The authors report no other potential conflicts of interest for this work.
References
1. Ponte A, Pinho R, Rodrigues A, et al. Review of small-bowel cleansing scales in capsule endoscopy: a panoply of choices. World J Gastrointest Endosc. 2016;8:600–609. doi:10.4253/wjge.v8.i17.600
2. Saurin JC, Delvaux M, Gaudin JL, et al. Diagnostic value of endoscopic capsule in patients with obscure digestive bleeding: blinded comparison with video push-enteroscopy. Endoscopy. 2003;35:576–584.
3. Leenhardt R, Li C, Koulaouzidis A, et al. Nomenclature and semantic description of vascular lesions in small bowel capsule endoscopy: an international Delphi consensus statement. Endosc Int Open. 2019;07:E372–9. doi:10.1055/a-0761-9742
4. Pennazio M, Spada C, Eliakim R, et al. Small-bowel capsule endoscopy and device-assisted enteroscopy for diagnosis and treatment of small-bowel disorders: European society of gastrointestinal endoscopy (ESGE) clinical guideline. Endoscopy. 2015;47:352–376. doi:10.1055/s-0034-1391855
5. Van Weyenberg S, De Leest H, Mulder C. Description of a novel grading system to assess the quality of bowel preparation in video capsule endoscopy. Endoscopy. 2011;43:406–411. doi:10.1055/s-0030-1256228
6. Koulaouzidis A, Giannakou A, Yung DE, et al. Do prokinetics influence the completion rate in small-bowel capsule endoscopy? A systematic review and meta-analysis. Curr Med Res Opin. 2013;29(9):1171–1185. doi:10.1185/03007995.2013.818532
7. Yung DE, Rondonotti E, Sykes C, et al. Systematic review and meta-analysis: is bowel preparation still necessary in small bowel capsule endoscopy? Expert Rev Gastroenterol Hepatol. 2017;11:979–993. doi:10.1080/17474124.2017.1359540
8. Monteiro S, de Castro FD, Carvalho PB, et al. PillCam®SB3 capsule: does the increased frame rate eliminate the risk of missing lesions? World J Gastroenterol. 2016;22:3066–3068. doi:10.3748/wjg.v22.i10.3066
9. Kim SH, Choi HS, Chun HJ, et al. Diagnostic benefit of simultaneous capsule endoscopy using two different systems. Gastroenterol Res Pract. 2018;2018:9798546. doi:10.1155/2018/9798546
10. Omori T, Hara T, Sakasai S, et al. Does the PillCam SB3 capsule endoscopy system improve image reading efficiency irrespective of experience? A pilot study. Endosc Int Open. 2018;6:E669–75. doi:10.1055/a-0599-5852
11. Ponte A, Pinho R, Rodrigues A, et al. Validation of the computed assessment of cleansing score with the Mirocam® system. Rev Española Enfermedades Dig. 2016;108:709–715.
12. Klein A, Gizbar M, Bourke MJ, et al. Validated computed cleansing score for video capsule endoscopy. Dig Endosc. 2016;28:564–569. doi:10.1111/den.12599
13. Pietri O, Rezgui G, Histace A, et al. Development and validation of an automated algorithm to evaluate the abundance of bubbles in small bowel capsule endoscopy. Endosc Int Open. 2018;6:E462–9. doi:10.1055/a-0573-1044
14. Yung DE, Sykes C, Koulaouzidis A. The validity of suspected blood indicator software in capsule endoscopy: a systematic review and meta-analysis. Expert Rev Gastroenterol Hepatol. 2017;11:43–51.
 © 2020 The Author(s). This work is published and licensed by Dove Medical Press Limited. The
full terms of this license are available at https://www.dovepress.com/terms
and incorporate the Creative Commons Attribution
- Non Commercial (unported, 3.0) License.
By accessing the work you hereby accept the Terms. Non-commercial uses of the work are permitted
without any further permission from Dove Medical Press Limited, provided the work is properly
attributed. For permission for commercial use of this work, please see paragraphs 4.2 and 5 of our Terms.
© 2020 The Author(s). This work is published and licensed by Dove Medical Press Limited. The
full terms of this license are available at https://www.dovepress.com/terms
and incorporate the Creative Commons Attribution
- Non Commercial (unported, 3.0) License.
By accessing the work you hereby accept the Terms. Non-commercial uses of the work are permitted
without any further permission from Dove Medical Press Limited, provided the work is properly
attributed. For permission for commercial use of this work, please see paragraphs 4.2 and 5 of our Terms.