Back to Journals » International Journal of Nanomedicine » Volume 12
Physicochemical characterization of drug nanocarriers
Authors Manaia EB ![]() , Abuçafy MP
, Abuçafy MP ![]() , Chiari-Andréo BG
, Chiari-Andréo BG ![]() , Silva BL, Oshiro Junior JA
, Silva BL, Oshiro Junior JA ![]() , Chiavacci LA
, Chiavacci LA ![]()
Received 7 February 2017
Accepted for publication 23 March 2017
Published 13 July 2017 Volume 2017:12 Pages 4991—5011
DOI https://doi.org/10.2147/IJN.S133832
Checked for plagiarism Yes
Review by Single anonymous peer review
Peer reviewer comments 3
Editor who approved publication: Dr Thomas Webster
Eloísa Berbel Manaia,1 Marina Paiva Abuçafy,1 Bruna Galdorfini Chiari-Andréo,1,2 Bruna Lallo Silva,1 João Augusto Oshiro Junior,1 Leila Aparecida Chiavacci1
1Department of Drugs and Medicines, School of Pharmaceutical Sciences, São Paulo State University (UNESP), Araraquara, SP, Brazil, 2Department of Biological and Health Sciences, Centro Universitário de Araraquara, UNIARA, Araraquara, SP, Brazil
Abstract: Pharmaceutical design has enabled important advances in the prevention, treatment, and diagnosis of diseases. The use of nanotechnology to optimize the delivery of drugs and diagnostic molecules is increasingly receiving attention due to the enhanced efficiency provided by these systems. Understanding the structures of nanocarriers is crucial in elucidating their physical and chemical properties, which greatly influence their behavior in the body at both the molecular and systemic levels. This review was conducted to describe the principles and characteristics of techniques commonly used to elucidate the structures of nanocarriers, with consideration of their size, morphology, surface charge, porosity, crystalline arrangement, and phase. These techniques include X-ray diffraction, small-angle X-ray scattering, dynamic light scattering, zeta potential, polarized light microscopy, transmission electron microscopy, scanning electron microcopy, and porosimetry. Moreover, we describe some of the commonly used nanocarriers (liquid crystals, metal–organic frameworks, silica nanospheres, liposomes, solid lipid nanoparticles, and micelles) and the main aspects of their structures.
Keywords: nanoparticles, drug delivery, physicochemical properties, controlled drug release
Introduction
Recent years have seen increasing research interest in the development of new drug delivery systems that are based on nanoparticles with dimensions ranging from 1 to 1,000 nm.1 Compared to conventional drug delivery systems, the use of nanoparticles for drug delivery offers advantages, including high stability, specificity in relation to the target, and the capacity to deliver both hydrophilic and hydrophobic drug molecules. Materials with nanometric dimensions have distinct physicochemical properties in terms of size, surface properties, shape, composition, molecular weight, purity, stability, and solubility, which are crucial determinants of their physiological behavior. A rigorous approach to the characterization of nanomaterials is essential to ensure quality and safety, and to enable the rational development of nanomedicines. Some examples of nanomaterials include liquid crystals, metal–organic frameworks (MOFs), silica nanospheres, liposomes, solid lipid nanoparticles, and micelles.2 Structures of liposomes, micelles, silica nanoparticles, and MOFs are shown in Figure 1A–D, respectively.
 | Figure 1 Schematic nanocarrier structures: (A) liposome, (B) micelle, (C) silica nanoparticles, and (D) metal–organic framework. |
Due to the physicochemical peculiarities of nanometric drug carriers, it is very important to understand how their characteristics affect their in vivo distribution and behavior. Therefore, it is necessary to identify suitable reliable and robust techniques that can be used for this purpose.2 Methods most commonly used to evaluate the structural aspects of nanocarriers are X-ray diffraction (XRD), small-angle X-ray scattering (SAXS), dynamic light scattering, zeta potential, polarized light microscopy, transmission electron microscopy, scanning electron microscopy, and porosimetry. These techniques can be used to determine the size, surface properties, shape, composition, purity, stability, and dispersion state of nanometric systems.
Table 13–13 summarizes some of the main characterization techniques, specific parameters detected by each one, and nanocarriers that can be characterized by them. In this review, we briefly describe the principles of some of these characterization techniques applied to nanocarriers, examining some of the advantages of different methods.
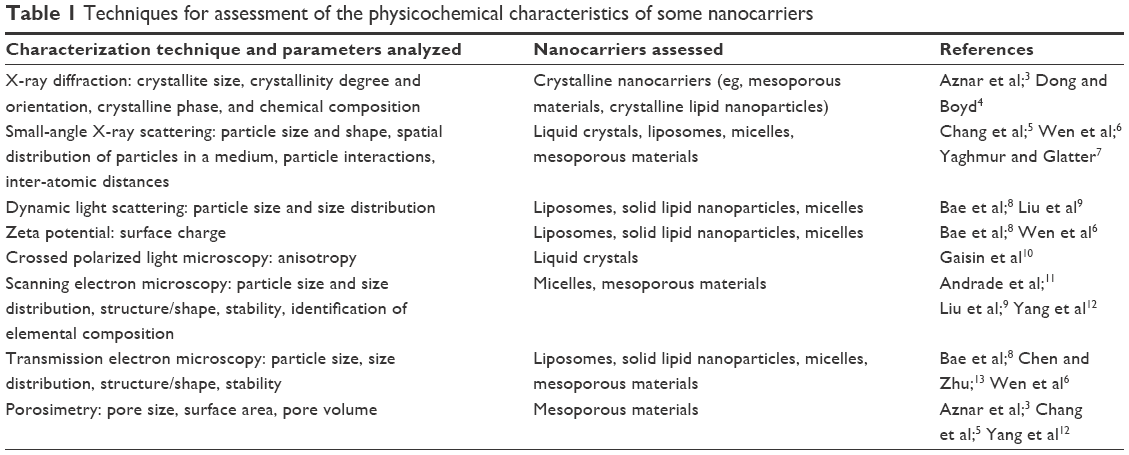 | Table 1 Techniques for assessment of the physicochemical characteristics of some nanocarriers |
Physical and chemical techniques for characterization of drug nanocarriers
X-ray scattering
X-ray scattering is a powerful technique where by different structural information can be obtained according to the length scale used: 1) wide-angle X-ray scattering (WAXS) explores angles greater than 10° and provides information about the structure at an atomic scale (from ~1 to 10 Å); 2) SAXS detects radiation at angles between 0.1° and 10° and describes the organization of the sample in a range from ~10 to 1,000 Å; 3) ultra-small-angle X-ray scattering (USAXS) employs ultra-small angles between 0.001° and 0.1° and probes structures >1,000 Å.14 XRD is a type of WAXS, also called wide X-ray diffraction (WXRD), where Bragg peaks (diffraction peaks) are produced as a function of the scattering angle (discussed further in the “X-ray diffraction” section). Figure 2 presents a schematic illustration of the mechanism of X-ray penetration into the sample and the scattering regimes (WAXS, SAXS, and USAXS), indicating the scattering angles employed by each method.
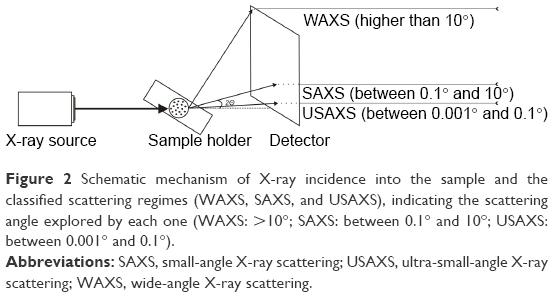 | Figure 2 Schematic mechanism of X-ray incidence into the sample and the classified scattering regimes (WAXS, SAXS, and USAXS), indicating the scattering angle explored by each one (WAXS: >10°; SAXS: between 0.1° and 10°; USAXS: between 0.001° and 0.1°). |
X-ray diffraction
XRD can be used to analyze crystal or polycrystalline materials. In this technique, the sample is exposed to a collimated X-ray beam, with detection of the type and intensity of scattering by stacked parallel atomic planes of the sample, at specific angles. Characteristics of the scattered X-rays indicate the arrangement of the crystalline material, using Bragg’s Law: 2d sinθ = nλ, where n is an integer, λ is the wavelength, θ is the scattering angle, and d is the interplanar distance. According to Bragg’s law, at a determined wavelength, the scattering angle is inversely proportional to the interplanar distance.4,14
XRD can be used to identify the type of crystalline phase, crystallinity degree and orientation, chemical nature of the compound (in comparison to a known standard), and size of the crystallites. Sharp and broad diffraction peaks are observed for crystalline and amorphous materials, respectively, with smaller crystallites producing broader diffraction peaks.14 If it is assumed that peak broadening is essentially due to size effects, the average nanocrystallite size can be evaluated using the Debye–Scherrer relation: D = κλ/βcosθ, where D is the crystallite size, κ is a constant (shape factor), λ is the X-ray wavelength, β is the full-width-at-half-maximum of a characteristic diffraction peak, and θ is the diffraction angle.15
In the pharmaceutical field, XRD is the principal technique used to evaluate the crystallinity of drugs, drug carriers, and excipients, as well as to identify the crystalline phases of contaminants in drug synthesis processes.14
Small-angle X-ray scattering
Small angle scattering (SAS) has been widely exploited as a potent technique to investigate the structures of materials on length scales ranging from 1 to 100 nm. Different methods are available, depending on the nature of the radiation employed in this technique: SAXS, small-angle neutron scattering (SANS), and small-angle light scattering (SALS). The choice of method depends on the nature of the sample, sample environment, length scale required, and type of information sought.16
SANS has an advantage that the use of deuterium-labeled components in the sample increases the contrast between the sample and the medium. In addition, SANS is sensitive to fluctuations in the nuclei density of the sample. However, the flux of neutron sources is intrinsically lower, compared to X-ray sources. Considering the other methods, SAXS is sensitive to differences in electron density, and SALS is sensitive to polarizability.16
SAXS is based on the elastic scattering of X-rays by the electron clouds of the atoms present in the sample as well as on differences in electronic density of the scattering object and the medium. This technique can provide information about the shapes and sizes of 1) dispersed particles, which could be macromolecules (eg, biological molecules, polymers, or micelles) or nanoparticles (eg, quantum dots), in a homogeneous medium; 2) a precipitate present in a matrix; and 3) a magnetic inhomogeneity present in a non-magnetic matrix.16
Besides the assessment of shape and size, SAXS can be used to explore the spatial distribution of particles in a medium, giving details about their interactions and average correlation distance. Both structure and interaction within the system can be investigated by analyzing SAXS patterns using either model-independent or model-dependent procedures.15 A laboratory-based SAXS approach is currently used for concentrated and stable samples with large differences in electron densities, which provides slow data acquisition. For samples that are highly dilute and dispersed, and are composed of atoms with low scattering density (eg, C, N, O, H, and P) a synchrotron radiation source is needed to provide orders of magnitude higher than X-ray flux.17 Benefits provided by the use of synchrotron radiation include improvement of the data quality (with well-resolved peaks and low backgrounds),18 dramatic reduction of the acquisition time (from hours to milliseconds) and provision of temporally resolved data,19 the capacity to perform measurements under physiological conditions and in situ,20 and the ability to monitor the structure while varying the temperature.21
In general, the SAXS sample is irradiated by a monochromatic and collimated X-ray beam, and the X-ray detector records its scattering pattern. This is usually expressed as a function of the momentum transfer: q =4πsinθ/λ, where λ is the wavelength of the incident beam and 2θ is the scattering angle. The scattering intensity (I) can be 1) isotropic, a classical behavior of dilute solutions and dependent only on the scattering angle or 2) anisotropic, a behavior observed for structures that are more concentrated and ordered. Figure 3 shows some examples of isotropic and anisotropic SAXS curves. Data correction is needed in the case of dispersed or diluted samples, with the scattering intensity of the solvent being subtracted from that of the sample. The corrected scattering profile then provides information about the concentration of the sample and the orientation of its components.22
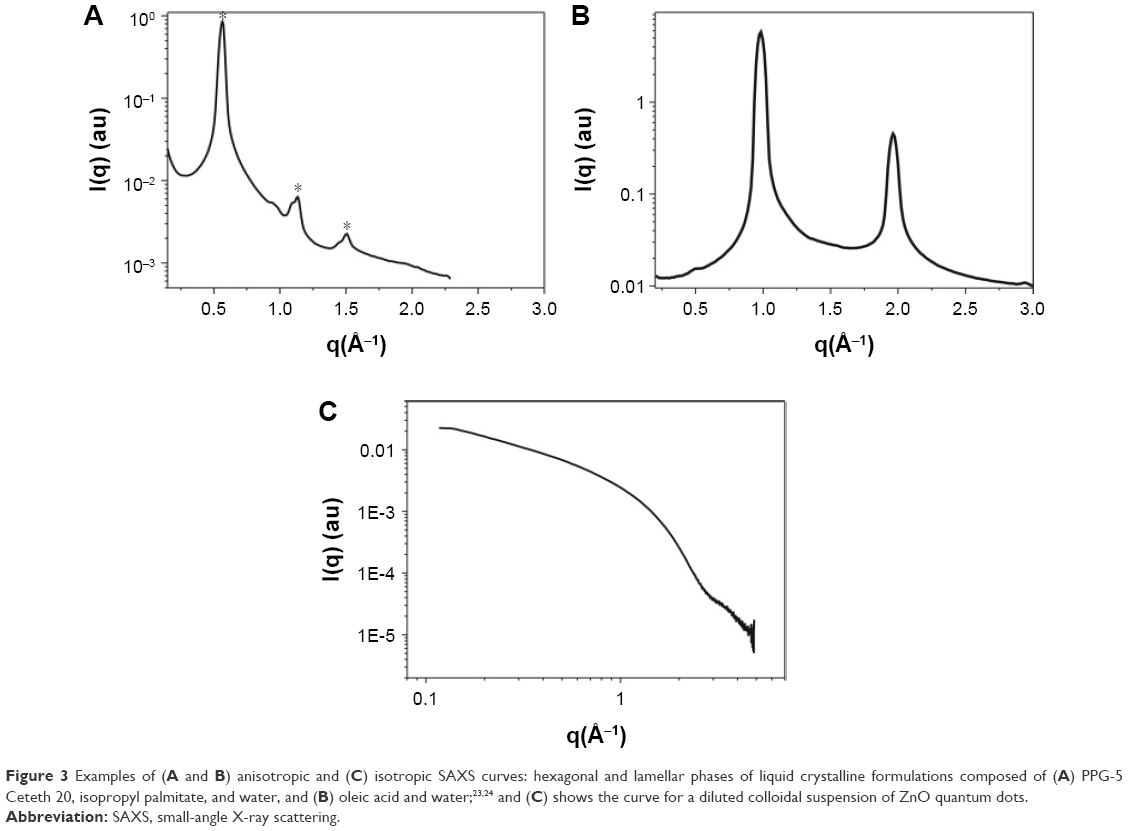 | Figure 3 Examples of (A and B) anisotropic and (C) isotropic SAXS curves: hexagonal and lamellar phases of liquid crystalline formulations composed of (A) PPG-5 Ceteth 20, isopropyl palmitate, and water, and (B) oleic acid and water;23,24 and (C) shows the curve for a diluted colloidal suspension of ZnO quantum dots. |
Dynamic light scattering
The size of particles such as polymers and colloids is a crucial factor determining their properties and safety in biological systems, especially when the suggested use is by parenteral administration. Dynamic light scattering (DLS), also known as quasi-elastic light scattering or photon correlation spectroscopy (PCS), is one of the techniques most widely used to measure particle size in solutions and to perform size-distribution studies. DLS is based on fluctuations caused by the Brownian diffusion of spherical particles, where the Brownian movement of the particles is related to an equivalent hydrodynamic diameter. The equipment focuses a beam of laser light into the nanoparticle solution, and a photon detector measures the intensity of the Doppler shift of the incident radiation, which is time-dependent on the fluctuations. The Stokes–Einstein equation – which relates the timescale of particle diffusion to the equivalent sphere hydrodynamic diameter of the particle – is used to calculate the particle size. This relation depends on both the viscosity of the solution and the temperature at which the scattered light is collected.2,9,25,26
There are several specific aspects of the DLS technique related to the equipment, data collection, and treatment. It is not possible to determine the particle size of samples that absorb at the same wavelength as that of the laser used in the equipment. DLS measures the equivalent sphere hydrodynamic diameter; therefore, 1) unlike SAXS, DLS provides no information concerning nanoparticle shape and 2) the actual size of particles in the suspension can be underestimated. Furthermore, larger particles scatter laser radiation more efficiently than smaller ones, because the intensity of light scattered from small spherical particles is proportional to the sixth power of the particle diameter; thus, the presence of a dust particle or traces of agglomerates can interfere in the DLS results. DLS cannot distinguish between similarly sized populations without coupling to a separation/fractionation procedure; therefore, it is often necessary to use complementary size-characterization techniques.25,26
A drawback of DLS is that nanomaterials tend to aggregate in water, changing their size and surface properties, thereby leading to different interactions with the water molecules that surround the nanoparticles. As a result, the size obtained from DLS may be overestimated and size distribution may be altered due to environmental dependence. On the other hand, DLS allows measurements under physiological conditions, mimicking the in vivo behavior. The size of dried nanoparticles is likely to differ from that in water, the stomach, and the intestine, where there may be effects of pH, and may also differ from their sizes in the presence of plasma proteins and in ionic media. Therefore, DLS is a valuable method for determining the hydrodynamic sizes of nanoparticles in biological fluids.25,26
DLS is typically used 1) to study the stability of formulations according to time and/or variations of temperature, 2) to identify the presence of aggregates in formulations prepared by different procedures, and 3) for rapid determination of the particle size of monodisperse samples.2,25
Zeta potential
Zeta potential is a fundamental particle characteristic that can also be rapidly measured using light-scattering techniques.25 In an ionic solution, an electrical double layer surrounds the surface of a charged particle. Figure 4 shows a schematic illustration of the electrical double layer at the surface of nanoparticles in a solution, together with a graph showing a typical analytical response. The particle surface is strongly bound to oppositely charged ions, generating the Stern layer (a thin liquid layer), where non-hydrated co-ions and counterions are adsorbed at the surface. The second layer consists of bound, hydrated, and partially hydrated counterions located between the Stern layer and the slip plane, as shown in Figure 4. The last layer, known as the diffuse layer, consists of mobile co-ions and counterions. This layer is associated with the slip plane, which is an imaginary plane that separates immobile ions at the surface from mobile ions in solution. In most cases, the Stern layer and the slip plane are close to each other; thus, for practical purposes, Ψδ can be approximated with the zeta potential.27 Thereby, the zeta potential is the difference between the electric potential on the shear surface of the particle and the electric potential of the solution, which can be determined by evaluation of the velocity of the charged species moving toward the electrode, in the presence of an external electric field across the sample solution.2 According to the three-layer model, the variation of the potential as a function of the distance firstly shows a linear decrease across the Stern layer and, then, a second linear decrease until the slip plane; finally, it shows an exponential decay related to the zeta potential.27
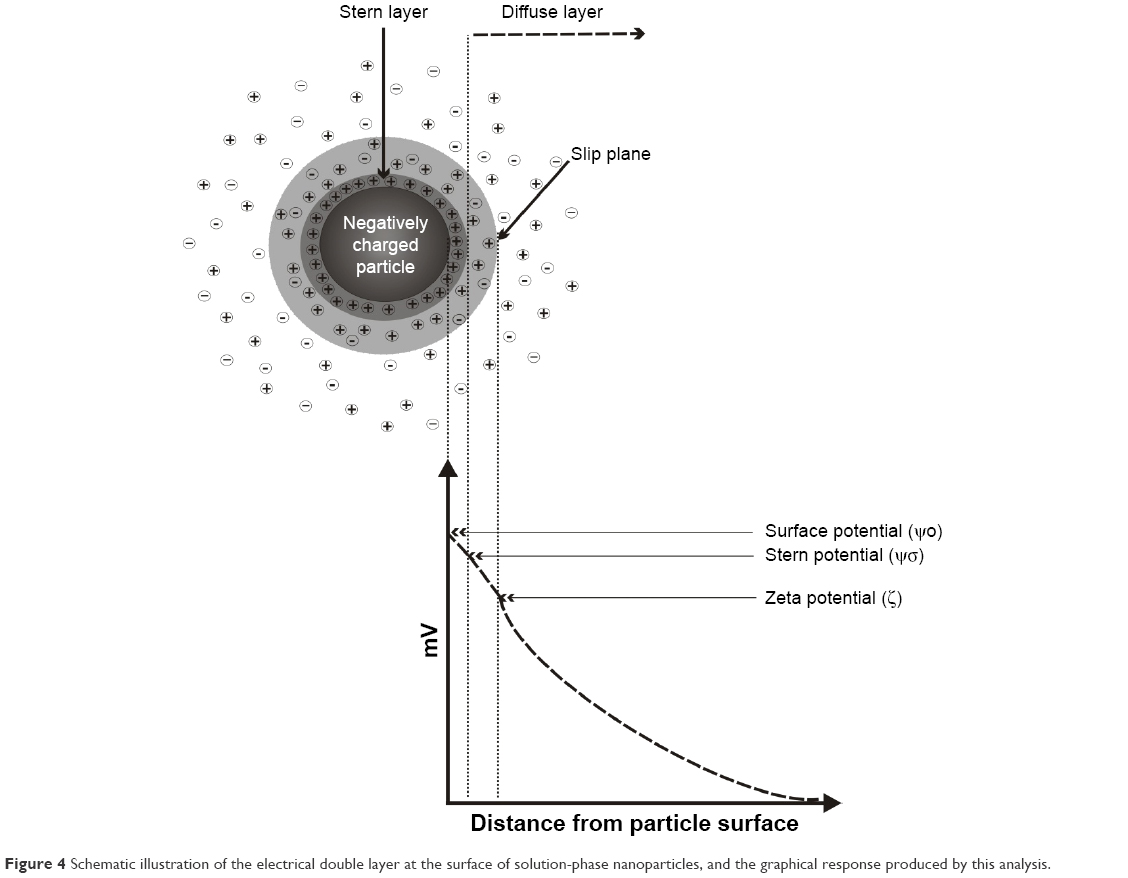 | Figure 4 Schematic illustration of the electrical double layer at the surface of solution-phase nanoparticles, and the graphical response produced by this analysis. |
Zeta-potential measurements provide precise analysis of the electronic state of the nanoparticle surface, and the data obtained can be used to predict the stability of formulations containing these nanoparticles.28 Instability can result from interaction between poorly charged or uncharged nanoparticles, leading to the formation of aggregates.25 The value of ±30 mV is normally used to deduce the stability of nanoparticles; zeta-potential values greater than +30 mV and lower than −30 mV are indicative of stable conditions, whereas values between −30 mV and +30 mV indicate unstable conditions that favor aggregation, coagulation, and flocculation.2
Light-scattering techniques such as laser Doppler micro-electrophoresis, also known as electrophoresis light scattering (ELS), are currently used for zeta-potential determination, despite suffering from electroosmotic effects that decrease precision and reproducibility. Measurements made using diluted suspended particles favor the penetration of light into the sample solution. However, zeta potential is highly sensitive to environmental changes such as alteration of pH or ionic strength. For this reason, repeatable and precise measurements of a diluted solution are not able to provide a true value for a concentrated suspension.2
Microscopy
Scanning electron microscopy
Scanning electron microscopy (SEM) uses electrons for imaging, in much the same way that a light microscope uses visible light, with the main improvements including greater depth of field and higher magnification (>100,000×). SEM uses a focused beam of high-energy electrons to generate a variety of signals at the surface of solid samples. The incident electron beam is scanned in a raster pattern across the surface of the sample, and the electrons emitted are detected by an electron detector for each position in the scanned area. The intensity of the emitted electron signal is displayed as brightness on a display monitor and is stored in a digital image file that represents the morphology of the sample surface.29
The sample electron emission can include elastic and inelastic scattering events. Electron backscattering occurs when high-energy electrons are ejected following elastic collision of incident electrons with sample atom nuclei. Lower energy electrons emitted as a result of inelastic scattering are called secondary electrons. These are produced following collisions with the sample nuclei in which substantial energy loss occurs by the ejection of loosely bound electrons from the sample atoms. Consideration of the type of electron emitted is important for adjusting SEM measurements and optimizing the analysis.30
SEM analyses require simple sample preparation and can only be used for certain biological materials, due to degradation caused by the electron beam. However, the topography of nanomaterials can be preserved using new microscopy techniques that do not require drying of the sample (environmental or wet SEM), or by careful freezing of the sample (cryo-SEM). The environmental SEM technique allows analyses of hydrated materials to be performed without fixing, drying, freezing, or coating the specimen.30 The use of wet SEM is, as yet, mainly restricted to the characterization of microspheres and microcapsules,31 while cryo-SEM has been used for the characterization of microspheres32 and nanoemulsions.33 The main limitation of SEM is the resolution of the images, which restricts its application to samples ~200 nm in size.29 Figure 5 shows an SEM micrograph of an MOF.
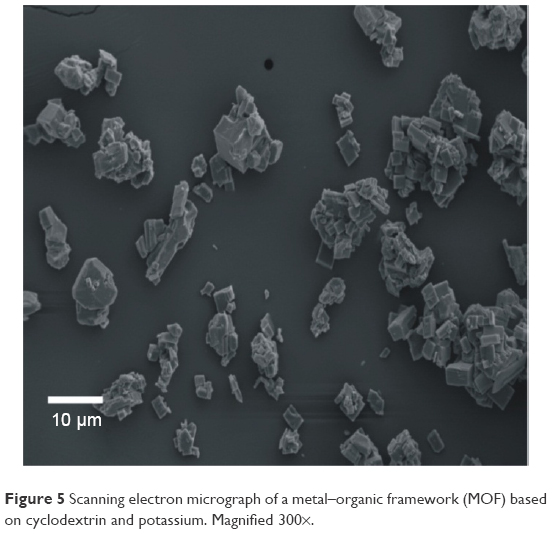 | Figure 5 Scanning electron micrograph of a metal–organic framework (MOF) based on cyclodextrin and potassium. Magnified 300×. |
Transmission electron microscopy
Transmission electron microscopy (TEM) is one of the most effective tools for the characterization of nanomaterials at spatial scales ranging from the atomic level (from <1 to 100 nm) up to the micrometer level, which enables novel applications. TEM uses more powerful electron beams than SEM, thereby providing higher resolution and greater detail, such as information about the crystalline structure and granularity of a particle.34 An image is formed from electrons transmitted through the sample and focused by an objective lens, which is detected by a camera and displayed on a screen.
TEM is an indispensable tool for use in many fields of nanotechnology research and development, including the investigation of drug nanocarriers. Furthermore, the use of TEM enables the detection of alterations in nanoparticle morphology after the incorporation of drugs at different concentrations.35
In order to be viewed using TEM, biological samples that contain large quantities of water need to be dehydrated and then collected on a metal mesh and treated with electron stains. Each sample type has specific requirements, according to its composition. As in the case of SEM, it is possible to prepare the sample by careful freezing (cryo-TEM), which preserves its morphology.34
All of the above advantages of TEM are accompanied by a number of limitations. First, the price one pays in any high-resolution imaging technique is that it is only possible to view a small section of the sample. Another drawback of TEM is that it provides 2D images of 3D specimens (known as projection-limitation), which has led to the invention of the electron tomography technique, which uses a sequence of images taken at different angles in order to create a 3D image. This is identical, in principle, to the more familiar medical computerized axial tomography (CAT) scans using X-rays.34
Polarized light microscopy
Polarized light microscopy (PLM) can be used for the preliminary identification of lyotropic liquid crystalline structures (except cubic mesophases).10 Anisotropic systems cause a deviation in the plane of polarized light (birefringence, similar to real crystals), resulting in typical black and white images, or colored textures when using an additional λ-plate. They can be classified according to their texture as: 1) lamellar liquid crystalline phase, with the micrograph showing oily streaks with “Maltese crosses” and 2) hexagonal liquid crystalline structure, indicated by a fan-like texture.36 Figure 6 presents a photomicrograph of a hexagonal liquid crystal in which fan-like textures can be clearly observed.
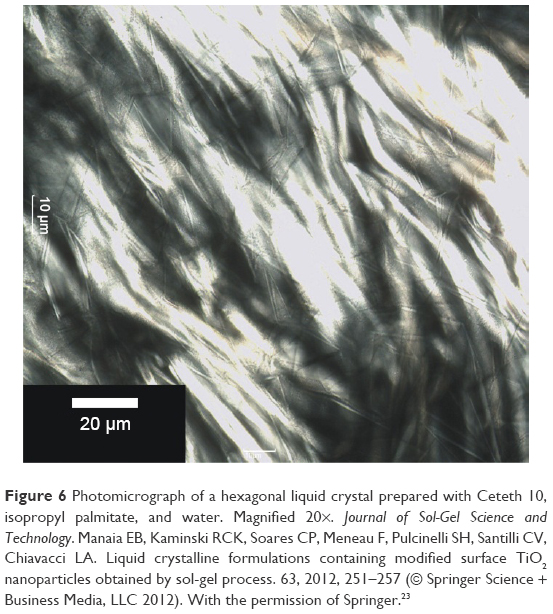 | Figure 6 Photomicrograph of a hexagonal liquid crystal prepared with Ceteth 10, isopropyl palmitate, and water. Magnified 20×. Journal of Sol-Gel Science and Technology. Manaia EB, Kaminski RCK, Soares CP, Meneau F, Pulcinelli SH, Santilli CV, Chiavacci LA. Liquid crystalline formulations containing modified surface TiO2 nanoparticles obtained by sol-gel process. 63, 2012, 251–257 (© Springer Science + Business Media, LLC 2012). With the permission of Springer.23 |
In the case of the lamellar phase, the Maltese crosses result from concentric rearrangement of plane layers and are the dominant texture. Figure 7 shows a photomicrograph of a lamellar liquid crystal, where numerous Maltese crosses can be seen (white color). In the case of isotropic systems, a dark field is observed because there is no deviation of the light.24,37,38
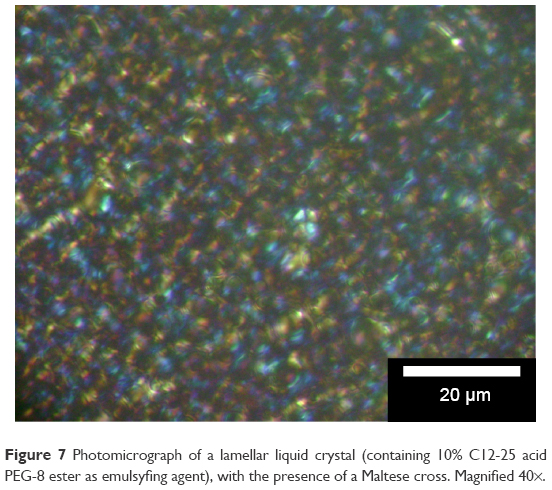 | Figure 7 Photomicrograph of a lamellar liquid crystal (containing 10% C12-25 acid PEG-8 ester as emulsyfing agent), with the presence of a Maltese cross. Magnified 40×. |
PLM can be used in the micron or submicron ranges. For liquid crystal particles with smaller dimensions, TEM can be used to provide adequate resolution.37
Porosimetry
Porosimetry is a useful technique for the characterization of porous materials, providing a wide range of information including the pore size, pore volume, and surface area of a sample.39 The experimental methodology is based on determination of the mass of a specific substance adsorbed at a given pressure. A microbalance is used for this purpose, weighing the sample before and after the adsorption of an adsorbate such as N2 or Hg.
Application of the Brunauer, Emmett and Teller (BET) equation and construction of isotherm curves are used to classify pores as micropores (pore size <2 nm), mesopores (pore size >5 nm to <50 nm), and macropores (pore size >50 nm). The adsorption isotherms can be classified according to their forms, as types I–VI (Figure 8). Type I isotherms are usually observed for microporous materials. Types II and III are found for macroporous materials with high and low affinity for the adsorbate, respectively. Types IV and V isotherms characterize mesoporous materials with high and low interaction with the adsorbate, respectively. Type VI isotherms are observed for non-porous materials with almost uniform surfaces. An optimal porous material is one that adsorbs the largest amount of adsorbate gas at the lowest possible gas pressure, and the type I isotherm is the one that best describes this substrate, with its higher adsorption curve indicating adsorption at a lower pressure.39,40
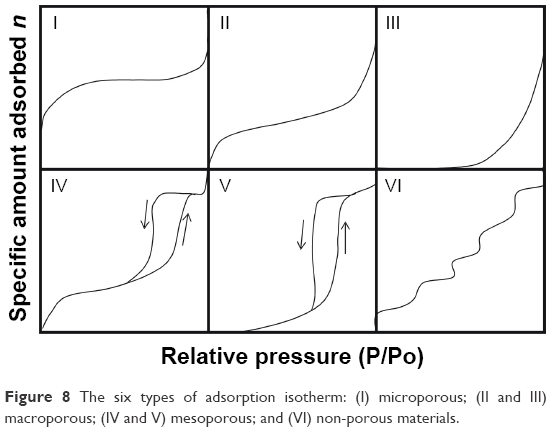 | Figure 8 The six types of adsorption isotherm: (I) microporous; (II and III) macroporous; (IV and V) mesoporous; and (VI) non-porous materials. |
One of the most important limitations of porosimetry is that it measures the entrance toward a pore, but not the actual inner size of a pore. In addition, porosimetry is unable to analyze closed pores, because the gas has no way of entering the pores.39
Determination of the surface area and porosity of porous drug carriers is very important for drug-loading and -release processes. The information obtained by porosimetry is used to establish the drug-storage capacity, which is associated with the pore size and volume.41
Trends in the use of pharmaceutical nanocarriers
Liquid crystals
Liquid crystalline formulations can be found as lamellar, hexagonal, and cubic phases, according to the arrangement of the surfactant molecules. The phase formed can be determined from the geometric packing of the lipid/surfactant, defined by the critical packing parameter (CPP), which is the ratio of the hydrophobic chain volume to the surface area of the hydrophilic head group and the hydrocarbon chain. Factors such as the presence of additives, pH, temperature, and pressure can influence the CPP.42
There are two general classes of liquid crystals: 1) thermotropic materials whose formation is temperature dependent and 2) lyotropic materials, which are influenced by the type and concentration of a solvent – usually water.43,44
These nanostructured systems offer advantages such as low cost, simple preparation, and the possibility of incorporation of hydrophilic/hydrophobic components due to the amphiphilic character of the surfactant molecules.45 Lipid-based liquid crystalline systems are attracting attention because they can improve the bioavailability of drugs that have low solubility in water, and can also control the release of macromolecular drugs.46,47
The liquid crystalline phases that are usually employed in drug delivery systems are the reverse bicontinuous cubic phase (V2) and the reverse hexagonal phase (H2).7,48 The hexagonal phase consists of long cylinders, with rod-shaped micelles being surrounded by a continuous water region. Thus, hydrophilic molecules can be embedded within the aqueous domains, and hydrophobic molecules can be embedded by direct interaction within the hydrophobic compartments.49 The reverse bicontinuous cubic phase consists of a lipid bilayer separating two continuous water channels,7 with three main variants: gyroid (Ia3d), diamond (Pn3m), and primitive (Im3m).17
Investigations of the behavior of liquid crystal phases have been performed by combining PLM, for preliminary identification of the nanostructure, and SAXS measurements, to confirm the liquid crystalline phase and obtain a better understanding of the spacing ratio.7,10,46 SAXS is considered the “gold standard” technique for determination of the internal symmetry (or mesophase) of liquid crystal systems.17
The mesophase of liquid crystalline structures can be determined according to relationships among the distances of the Bragg peaks on the scattering vector (q).50 Moreover, it is possible to calculate structural parameters (eg, crystal lattice size) related to the peak positions.17 The equation d =2π/qmax, where qmax is the q value at peak intensity I(q), can be used to calculate the correlation distance between the scattering objects.19 The relation among the distances d calculated for each peak must be in accordance with the specific relations described in Table 2, enabling identification of the type of phase.
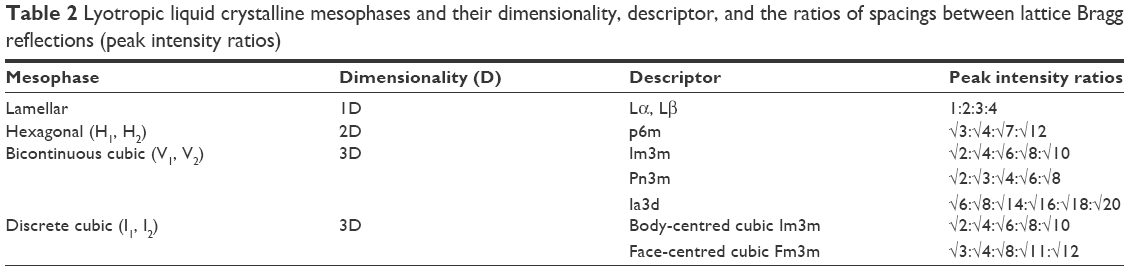 | Table 2 Lyotropic liquid crystalline mesophases and their dimensionality, descriptor, and the ratios of spacings between lattice Bragg reflections (peak intensity ratios) |
Table 3 provides some examples of liquid crystalline formulations, their compositions, the drug or active ingredient used, and the information obtained from the SAXS and PLM analyses used in the studies.
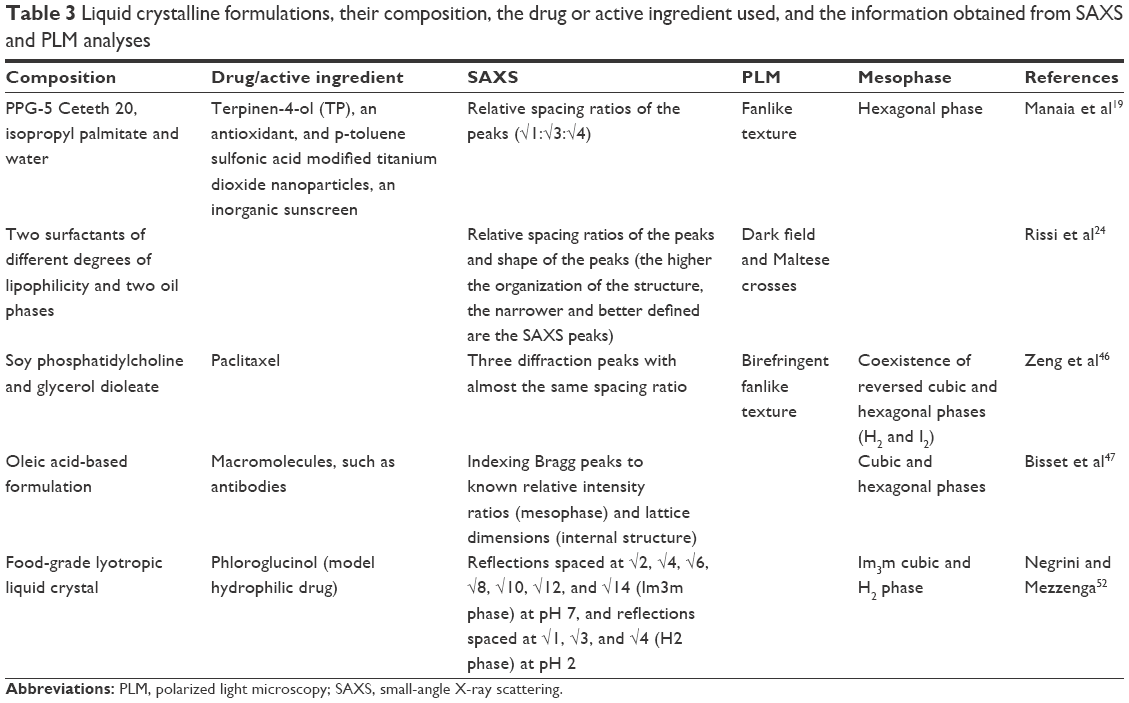 | Table 3 Liquid crystalline formulations, their composition, the drug or active ingredient used, and the information obtained from SAXS and PLM analyses |
Zeng et al46 prepared self-assembled liquid crystalline nanoparticles for the oral delivery of paclitaxel – a drug that has low solubility in water. According to the SAXS and PLM results, there was no phase conversion after loading of the drug. The SAXS data were not sufficiently clear to distinguish the spatial pattern of the coexisting H2 and I2 phases, although they showed crystallization of the liquid crystalline matrix phase.
Lipid-based liquid crystalline formulations were developed by Bisset et al,47 enabling pH-triggered control of matrix swelling and shrinking. It was proposed that this could allow the incorporation of macromolecules, which is usually hindered by the small size of the water channels, limiting control over diffusion behavior. Calculations were made of the radii of the water channels of the systems, using the lattice parameter, as well as the dimensions of the repeating cell units, which were obtained from scattering data. The channel radius was calculated using the following equations based on geometric considerations:
| (1) |
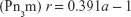
| (2) |
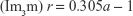
| (3) |
where r is the radius of the water channel (in nm), a is the lattice parameter (in nm) determined by SAXS, and l is the lipid chain length (in nm).51
Negrini and Mezzenga52 developed an efficient controlled-release vehicle that was pH-responsive. SAXS analyses identified different mesophases of the system, according to the pH. Figure 9 shows SAXS curves for the system, where the red and green curves correspond to pH 2 and 7, respectively. These curves confirmed the existence of reversible changes in the mesophase symmetry when the pH was changed from 7 to 2 or from 2 to 7.
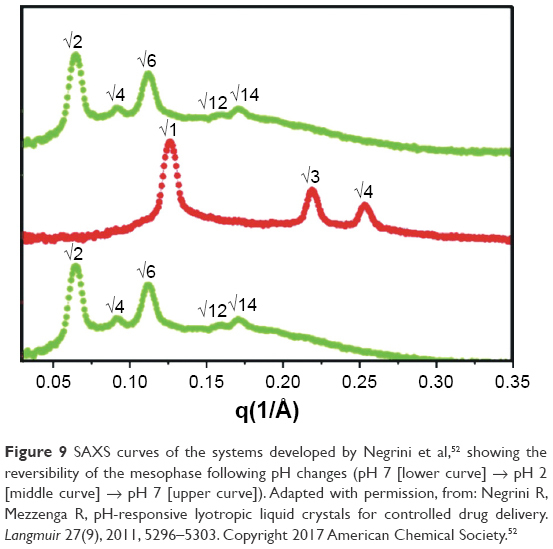 | Figure 9 SAXS curves of the systems developed by Negrini et al,52 showing the reversibility of the mesophase following pH changes (pH 7 [lower curve] → pH 2 [middle curve] → pH 7 [upper curve]). Adapted with permission, from: Negrini R, Mezzenga R, pH-responsive lyotropic liquid crystals for controlled drug delivery. Langmuir 27(9), 2011, 5296–5303. Copyright 2017 American Chemical Society.52 |
Liposomes
Liposomes are spherical lipid vesicles composed of one or more phospholipid bilayers and an aqueous internal cavity (Figure 1A). They can be classified as uni-, oligo-, or multilamellar vesicles, depending on the number of membrane bilayers, and are formed by the self-assembling of phospholipids in contact with a hydrophilic medium. This behavior increases their solubility in the medium and decreases their surface-to-volume ratio.53,54
There are several methods that can be used to prepare liposomes, including the reverse-phase evaporation technique, injection of phospholipids dissolved in an organic phase into a drug-containing aqueous phase, detergent dialysis, microfluidic hydrodynamic focusing (MHF), supercritical reverse-phase evaporation (SRPE), electroformation,55 microfluid liposome formation,56 and thin lipid film hydration (the Bangham method). The last was the first conventional method described for the preparation of liposomes, based on rehydration, in an aqueous solvent, of a thin lipid film formed by evaporating the organic solvent used to solubilize the lipid. The rehydration step can be performed by 1) vigorous shaking to generate multilamellar vesicles (MLVs) measuring >500 nm; 2) gentle hydration to generate giant unilamellar vesicles (GUVs) with size >1,000 nm; and 3) sonication to generate small unilamellar vesicles (SUVs) measuring ~20–100 nm.57 Therefore, the type of liposome produced is determined by the preparation process employed, in addition to the nature and concentration of the lipid.53
The lipids used to prepare liposomes should have a hydrophilic head and a hydrophobic tail, thereby enabling the resulting liposomes to be loaded with drugs that possess either characteristic.53,54 Commercially available lipids with different functional groups include cholesterol, egg phosphatidylcholine, phosphatidylethanolamine, and phosphatidylserine, enabling the properties of liposomes to be easily tuned.57
These substances are especially attractive as nanocarriers because they are nontoxic and their similarity to various cell structures favors their internalization into cells and the transport of drugs across membranes.6 Additionally, liposomes present large internal volumes and high surface areas, enabling them to efficiently convey large amounts of drugs to receptors, and they can also be loaded with targeting molecules.53 Consequently, liposomes can be employed as drug nanocarriers,58 chemiluminescence biosensors,59 and theranostic devices,6 among other uses.
Liposomes and other nanocarriers can be classified according to their surface properties. The “classical” (first-generation) liposomes have sizes up to 500 nm and disadvantageous surface properties (charge and hydrophilicity) that lead to their rapid clearance from blood circulation by the mononuclear phagocyte system (MPS), mainly in the liver and spleen, which can substantially decrease their distribution in other body tissues. This behavior is only beneficial for the treatment of MPS diseases. Therefore, alterations of the classical surface of liposomes have been used in order to avoid this premature clearance. Reduction in vesicle size, addition of cholesterol to provide membrane rigidity, and increased surface hydrophilicity using polymers such as polyethylene glycol (PEG) are strategies that have been employed to extend the circulation half-life of second-generation liposomes.60 Finally, third-generation liposomes have been developed with targeting molecules (antibodies and peptides) on their surfaces in order to provide receptor recognition and active targeting of the drug.61
The structures of liposomes can be characterized by analyzing their size, polydispersity, zeta potential, and lamellar arrangement. Size is critical for parenteral administration, and is mainly measured using DLS, TEM, cryogenic TEM (cryo-TEM), and atomic force microscopy (AFM). Moreover, cryo-TEM analysis can be used together with SAXS to study the morphology and lamellar structure of liposomes. Measurements of zeta potential, which is related to the presence of surface charge, provides information about the stability of liposomes, as repulsive charges (positive or negative) can prevent their aggregation.57
Table 4 lists liposome formulations, the drug or active ingredient used, and structural information obtained from DLS, zeta potential, TEM/cryo-TEM, and SAXS/WAXS analyses employed in the different studies.
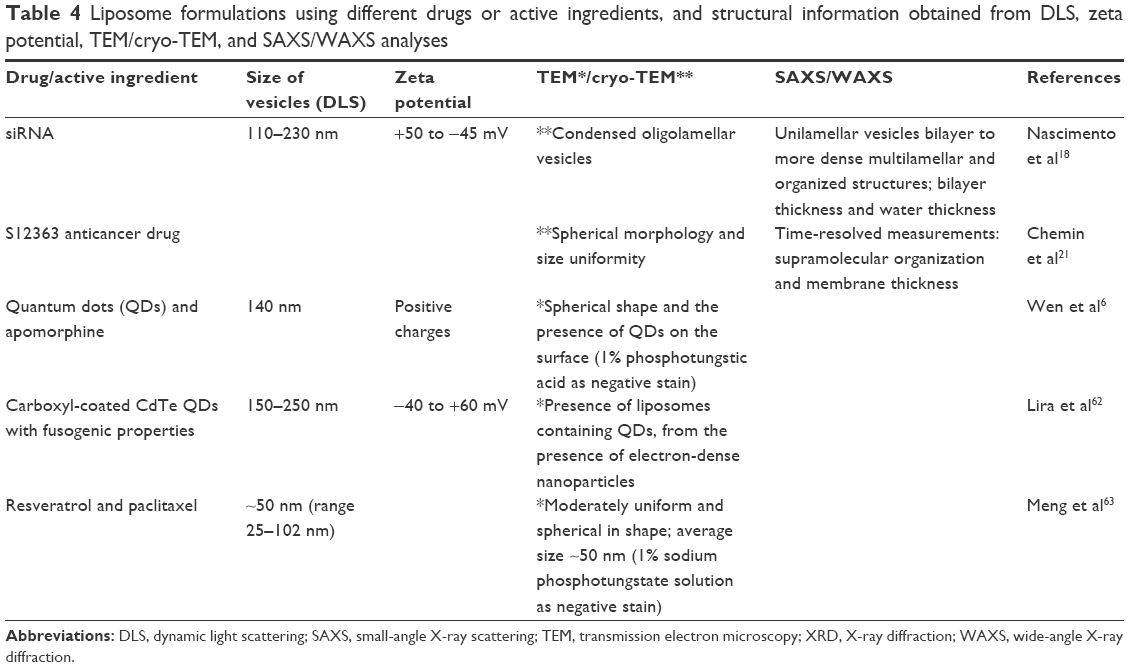 | Table 4 Liposome formulations using different drugs or active ingredients, and structural information obtained from DLS, zeta potential, TEM/cryo-TEM, and SAXS/WAXS analyses |
Wen et al6 developed liposomes to prevent premature drug uptake and enhance brain targeting. Quantum dots (QDs) were located at the bilayer membrane, with the drug in the aqueous cavity. In vivo bioimaging studies of brain endothelial cell uptake of the system revealed higher fluorescence in mouse brains treated with liposomes, compared to the use of free QDs.
Chemin et al21 studied the loading of the S12363 anticancer drug into liposomes, in an attempt to increase its therapeutic efficacy. Information was obtained about the long-range organization of the lipid assemblies at small angles (SAXS) and the packing of the phospholipid hydrocarbon chains at wide angles (WAXS). These measurements allowed the retrieval of structural information for all types of lamellar aggregation (uni-, oligo-, and multilamellar vesicles) using a single description of electron density profile of the bilayer. The membrane thickness was calculated using the equation: dB =2(ɀH+2σH), where dB is the bilayer thickness, ɀH is the position of the headgroup in the Gaussian model of the electron density profile, and σH is its width. The bilayer separation was then given by: dW = d−dB, where dW is the water layer thickness. The results showed that the drug was encapsulated into the aqueous cavity, but interacted strongly with the lipid membrane.
Nascimento et al18 studied the supramolecular organization of siRNA lipoplexes coated with hyaluronic acid (HA). Figure 10 shows cryo-TEM images of HA-liposomes (Figure 10A) and HA-liposomes containing siRNA (Figure 10B), and SAXS curves of liposomes and HA-liposomes with different HA percentages (Figure 10C). The HA-liposomes (Figure 10A) showed the coexistence of uni- and oligolamellar vesicles. The same behavior can be seen in Figure 10B, although the addition of siRNA to the liposomes caused changes in their morphology, with the particles appearing less spherical and homogeneous, compared to liposomes without siRNA. The SAXS curve for the unmodified liposomes (Figure 10C, top) was characteristic of a bilayer form factor of unilamellar vesicles. A higher HA content of the formulations resulted in diffraction peaks that were more intense, suggesting that the structure changed from unilamellar liposomes to an oligolamellar form. Besides the structural organization of the liposomes, the positioning of HA on the lipoplex surface and its ability to bind specifically to the CD44 receptors was investigated using surface plasmon resonance analysis.
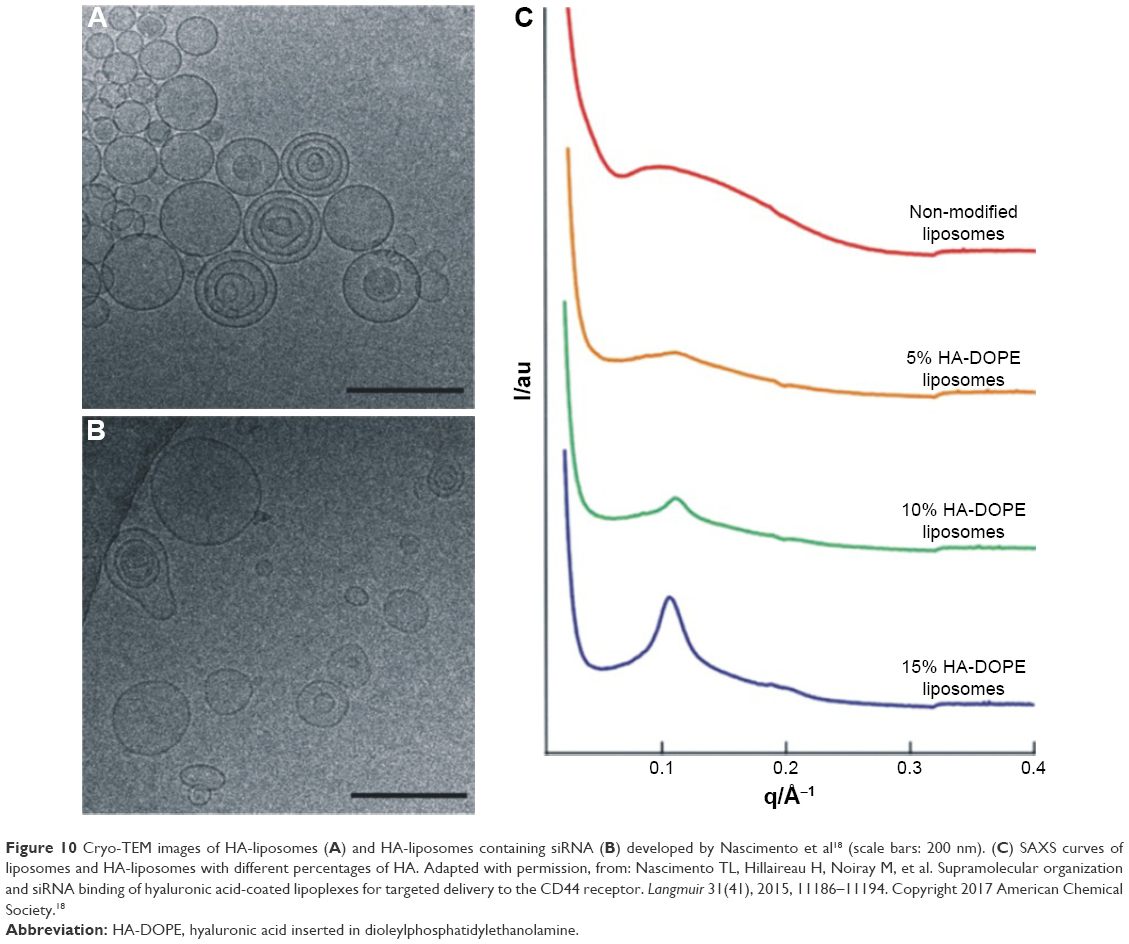 | Figure 10 Cryo-TEM images of HA-liposomes (A) and HA-liposomes containing siRNA (B) developed by Nascimento et al18 (scale bars: 200 nm). (C) SAXS curves of liposomes and HA-liposomes with different percentages of HA. Adapted with permission, from: Nascimento TL, Hillaireau H, Noiray M, et al. Supramolecular organization and siRNA binding of hyaluronic acid-coated lipoplexes for targeted delivery to the CD44 receptor. Langmuir 31(41), 2015, 11186–11194. Copyright 2017 American Chemical Society.18 |
Lira et al62 developed liposomes loaded with carboxyl-coated CdTe QDs with fusogenic properties in order to study intracellular molecules and their roles in biological functions. In terms of size, different values were found by the TEM, DLS, and conventional optical microscopy techniques. In the case of TEM, consecutive centrifugation steps led to the selection of larger liposomes, with a few of the smaller liposomes found using DLS analysis. Very small vesicles were visible on optical microscopy, although the larger ones were easier to observe due to their Brownian motion and the resolution of the technique. The use of complementary techniques to determine liposome size was crucial to avoid values that were under- or overestimated. It was possible to observe the fusion of labeled liposomes with live human stem cells and red blood cells in an endocytic-independent way. The formulation protocol was proposed as a general route for the encapsulation and delivery of any membrane-impermeable material into living cells.
Solid lipid nanoparticles
Another type of lipid-based nanocarriers that has been explored since the beginning of the 1990s are solid lipid nanoparticles (SLNs).64 Their use – instead of liquid oils – can be an attractive way of controlling drug release, because SLNs decrease drug mobility.65 Solid lipid nanoparticles with average sizes in the range 50–1,000 nm can be used as colloidal matrix nanocarriers for intravascular administration. These particles consist of a solid hydrophobic core of biocompatible lipids (eg, highly purified triglycerides, complex glyceride mixtures, or waxes) that are solid at room temperature. Drugs can be readily dissolved or dispersed into them, and they typically present high drug-loading efficiencies.
The preparation techniques used for SLNs include hot and cold homogenization, high-pressure homogenization, microemulsion, and nanoprecipitation methods. The last of these presents a number of advantages: 1) it does not use high temperatures to melt the solid lipid, thereby avoiding drug deterioration; 2) it has low energy and time requirements; 3) it does not use a large amount of surfactants; and 4) it is a simple, fast technique, with potential for scaling-up. In this method, the solid lipid is dissolved in a water-miscible organic solvent (eg, ethanol, acetone, or tetrahydrofuran), and the resulting solution is subsequently mixed with water. This results in high supersaturation of lipids in the solvent/water system, with solid lipids precipitating as nanoparticles. Smaller and more uniform nanoparticles can be obtained by diffusing the solvent into the water in an instantaneous and homogeneous manner.54,66
Advantages of SLNs for drug release and targeting include high drug loading and stability, incorporation of both hydrophilic and hydrophobic drugs, absence of toxicity of the carrier (as the lipids used are physiological compounds), minimization of organic solvent use, and the ability to be produced on a large scale.65
The characterization of this type of nanocarrier can be challenging, due to the small size and high degree of complexity of the particles. The characterization of SLNs includes analyses of size and polydispersity using AFM, DLS, TEM, and cryo-TEM (which allows visualization of the sample in its unmodified state), zeta potential, lipid crystallinity (using WAXS and differential scanning calorimetry [DSC]), and lipid structure (using infrared and Raman spectroscopy). These parameters can be used to predict the stability of formulations and the nature of drug incorporation and release. DLS provides a rapid means of measuring particle size, whereas AFM does not require complex sample preparation (although the sample must not be conductive). WAXS can be used to evaluate the length of the long and short spacings of the lipid lattice, and DSC can provide information on the dynamic melting points and melting enthalpies associated with different lipid compositions.4,65,67
Table 5 lists SLN formulations, the drugs or active ingredients used, and structural details obtained from DLS, zeta potential, and TEM/cryo-TEM analyses.
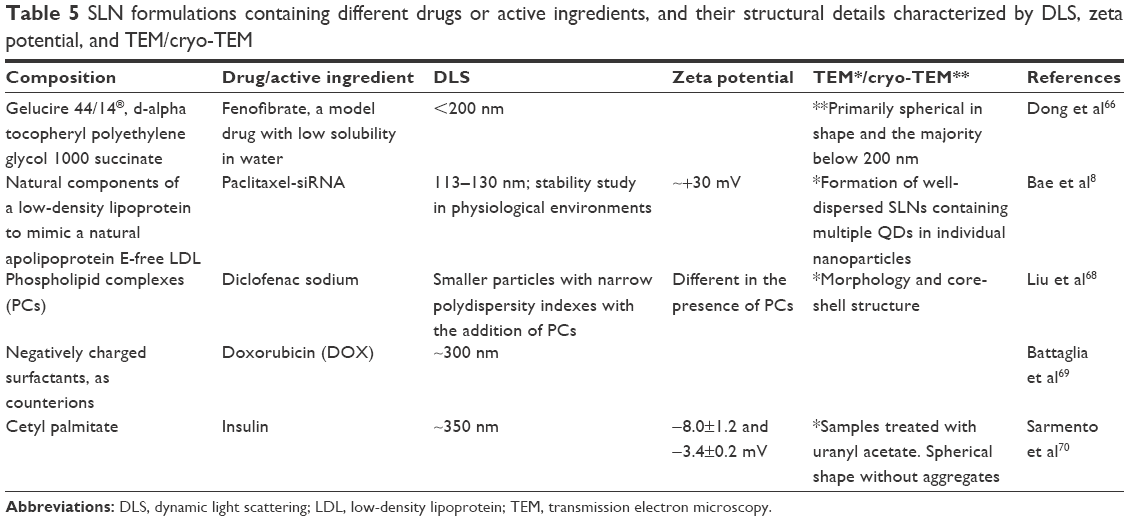 | Table 5 SLN formulations containing different drugs or active ingredients, and their structural details characterized by DLS, zeta potential, and TEM/cryo-TEM |
Bae et al8 incorporated a QDs and paclitaxel–siRNA combination in cationic SLNs for anticancer theranostic applications. Use of the TEM technique for analysis of SLNs can result in melting of the lipids or generate unclear images due to low electron density; in this study, the outer boundaries of the SLNs could not be clearly observed.
Liu et al68 developed SLNs loaded with diclofenac sodium (DS), using the phospholipid complexes (PCs) technology to improve the liposolubility of DS. Decreased drug release from the SLNs was attributed to the presence of phospholipid multilayers around the solid lipid core of the SLNs. XRD results showed the presence of DS in the PCs (either molecularly dispersed or in an amorphous form).
Dong et al66 studied the development of continuous and scalable SLNs using the nanoprecipitation method. It was possible to obtain nanoparticles <200 nm, and the lipid concentration was identified as the primary factor that influenced SLN size, with a higher lipid concentration resulting in larger particles.
Sarmento et al70 developed cetyl palmitate-based SLNs loaded with insulin for oral administration. The size of the SLNs was suitable for enabling gastrointestinal absorption by M cells of Peyer’s patches. Evaluation of the insulin association efficiency, together with the results of in vivo studies, indicated that the SLNs protected insulin against degradation and enhanced its intestinal absorption.
Micelles
Micelles are self-assembling spherical colloidal structures, <100 nm and with a narrow size distribution, which can be composed of phospholipids and polymers. They are spontaneously formed in aqueous conditions when the critical micellar concentration (CMC) is reached, obtaining a hydrophobic core and a hydrophilic shell. Figure 1B illustrates a micelle. Micelle formation results from two forces: 1) an attractive force, leading to the association of molecules; and 2) a repulsive force, preventing the unlimited growth of micelles to produce a distinct macroscopic phase. The association of polymers/phospholipids due to these forces occurs when the molecules reach a threshold concentration (CMC) in solution. Below the CMC, single chains are found in a molecular dispersion. Therefore, the CMC can be defined as the concentration of surfactant (polymers/phospholipids) at which the first micelle begins to be created, at a given temperature. Methods that have been proposed for determination of the CMC include surface tension, dye solubilization, light scattering, and fluorescence techniques.54,71–73
Besides conventional micelles, reverse micelles (RMs) have been explored due to their simplicity and a structure that allows the easy solubilization of water-soluble drugs in oily phases. RMs comprise multi-molecular surfactant components that become spontaneously associated in a nonpolar medium. Hydrophobic molecules can be incorporated in the oily core of the nano-droplets, enabling hydrophilic and hydrophobic drugs to be encapsulated and stabilized in the same core. A disadvantage of this system is that the continuous oily phase does not meet requisite specifications for targeted drug delivery.74
Characteristics of micelles that make them suitable for drug delivery include their unique nanoscopic architecture, small size, stability, and ability to be adapted for compatibility with different drugs. They are used for parenteral drug administration, especially of drugs that present low solubility (including anticancer drugs), and are generally considered a safe and biocompatible long-circulating drug delivery system when covered with a hydrophilic polymer shell. PEG is widely used as hydrophilic raw material for micelles (molecular weight 2–15 kDa) due to its high water solubility, non-toxicity, and neutral charge. The hydrophilic corona formed by PEG on the micelle surface decreases nonspecific interaction with blood proteins, thereby increasing the circulation time. The morphology of the micelles (spheres, rods, vesicles, tubules, and lamellae) can significantly affect their pharmacokinetic properties, changing their time of circulation in the body. Micelles are easily prepared by methods involving direct dissolution and organic solvents, and present good long-term stability.75
Various methods are available to characterize micelle morphology. TEM has been used since the early 1980s, whereas cryo-TEM optimizes visualization of the size and shape of micelles, because the sample can be analyzed in solution, avoiding drying and dehydration of the sample. AFM and SEM can also be used to distinguish micelle shape, with sample preparation being simpler for AFM, as SEM requires the deposition of a conductive coating onto the sample. DLS is the technique most widely used to directly determine the size and polydispersity index (PDI) of micelles in water or in an isotonic buffer.74,76–78 In addition, microscopic images can provide an indication of micelle size, although the method used to prepare the sample must be taken into account in evaluating the results.71 Furthermore, SAXS has been used to provide information about micelle size, shape, aggregation, and the characteristic inter-headgroup spacing across the micelle core.4
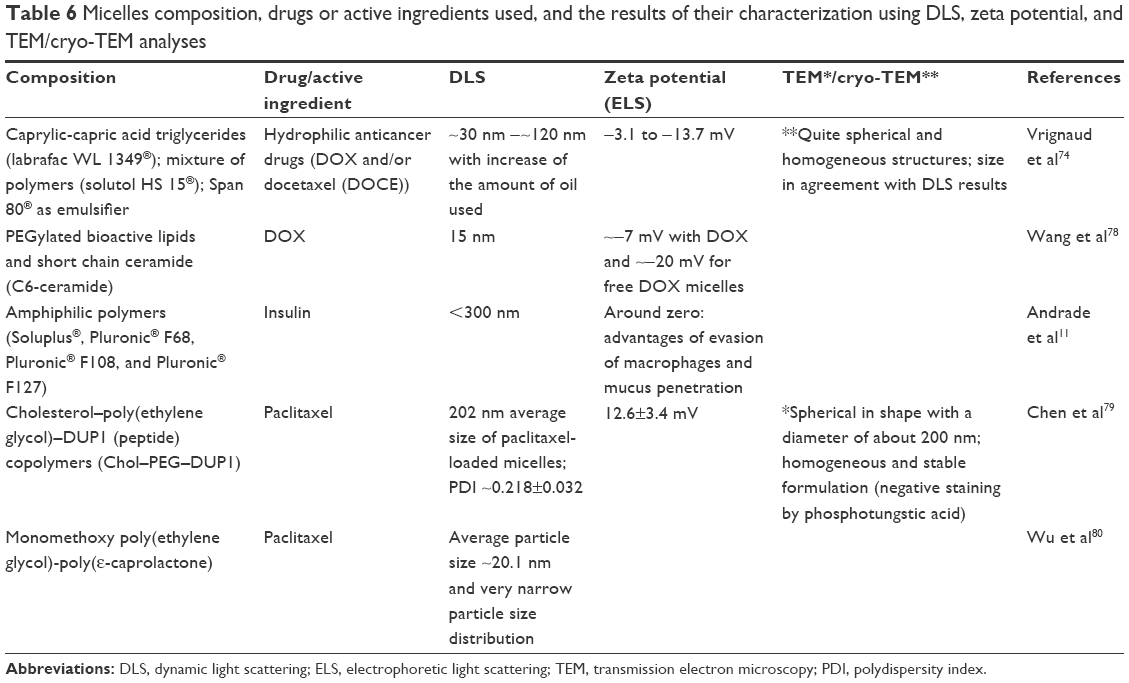
Table 6 presents details of micelle composition, the drug or active ingredient used, and the structural information obtained from DLS, zeta potential, and TEM/cryo-TEM analyses in different studies.
 | Table 6 Micelles composition, drugs or active ingredients used, and the results of their characterization using DLS, zeta potential, and TEM/cryo-TEM analyses |
The encapsulation and release of the hydrophilic anticancer drugs DOX and/or docetaxel (DOCE) by oil-based RM nanocarriers were elucidated by Vrignaud et al,74 who solubilized hydrophilic drugs in the oily core of the micelles, together with lipophilic content. The morphology of the samples was investigated by TEM, with and without a 4% osmium tetroxide solution stain, which specifically links with the double bonds of unsaturated lipids. Among the lipid contents used in the formulations, only the emulsifier Span 80® presented unsaturation; therefore, the stain was used only as an RM marker. Samples prepared without the staining agent showed greater detail due to the ability to observe different contrast along the nanoparticle. The characterization of the RM structure could explain the diffusion-based behavior of the DOX release profile, which appeared to be closely related to the morphology of the particles.
Wu et al80 developed an interesting gel-based dual-drug delivery system by combining a cisplatin-containing thermosensitive hydrogel and paclitaxel-loaded polymeric micelles. In this study, the size distribution of the micelles loaded with paclitaxel was characterized by DLS and AFM. The AFM images showed spherical, monodispersed, and well-distributed micelles, in agreement with the DLS results.
It can be seen that, in most cases, the size of the nanocarriers was determined by DLS and confirmed by microscopy, which provided information concerning morphological aspects of the samples.
Mesoporous materials
Mesoporous materials have been widely used for drug delivery, due to their highly ordered structure and large pore size. They are usually prepared from supramolecular assemblies composed of inorganic components (eg, silica nanoparticles) or organic and inorganic components (MOFs).81
The pore structure82 and pore size83 of mesoporous materials influence their pharmaceutical potential in terms of loading capacity and drug release.83,84 The incorporation of a drug is normally achieved by soaking the matrix in a highly concentrated drug solution and subsequent drying. The process is based on the adsorptive properties of the mesoporous material, with the pore size determining the size of the molecule that can be adsorbed within the mesopores.85
The pore diameter can typically be altered in the range from 2 to 50 nm by changing the components of these materials, enabling the production of various mesoporous materials that are able to host small drug molecules or macromolecules.85 Other factors that affect porosity and release kinetics include the influence of the pore connectivity, geometry, and degradation of the matrix in aqueous media.82 The stability of the pore structure also provides prolonged control of the drug-release kinetics.85
Mesoporous materials can provide drug delivery followed by alteration of the pore structure, such as increase in its size or its closure. These changes, which affect drug release, can be detected by XRD, SAXS, and porosimetry.3,5,12,86
Mesoporous silica nanoparticles
Most of the reported studies have been based on organic nanocarriers such as liposomes, polymers, and micelles, which have provided excellent systems for the release of therapeutic agents.87–89 More recently, discoveries based on inorganic nanoparticles, such as mesoporous silica nanoparticles (MSNs), have opened up exciting new possibilities in this area.90
MSNs are solid materials that exhibit biocompatibility at concentrations suitable for pharmacological applications.91 Figure 1C illustrates mesoporous silica nanoparticles.
These materials offer several advantageous structural properties, such as high surface area, a stable structure, and modifiable morphology (controllable particle shape and size). The large surface area and pore volume of MSNs allow high drug loading, while the highly ordered structure provides diffusion-controlled drug release. Furthermore, these materials have the capacity to protect the pharmaceutical content (eg, drugs and imaging agents) from premature release and undesired degradation in inhospitable environments (eg, the stomach) before reaching the designated target. No functional groups act as gates to control the release of the loaded substances; therefore, the release is controlled by the size and/or the morphology of the pores.92 However, the ability to modify the surface of silica-based nanocarriers with nanoparticles, polymers, and proteins, which act as shells, can also promote the controlled release of drugs. Exciting results have been reported in the literature, highlighting the potential of MSNs as promising platforms.93
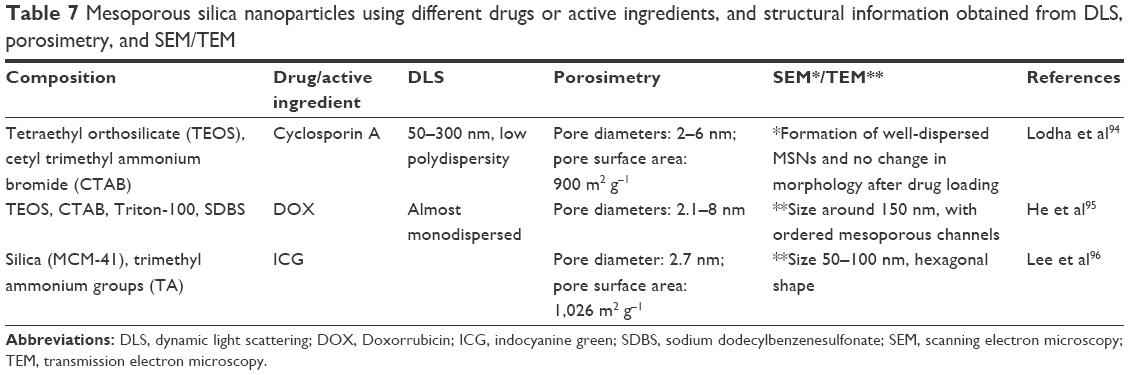
Table 7 shows some examples of mesoporous silica nanoparticles, their composition, the drug or other active ingredient used, and the information obtained from DLS, porosimetry, and microscopy analyses in the different studies.
 | Table 7 Mesoporous silica nanoparticles using different drugs or active ingredients, and structural information obtained from DLS, porosimetry, and SEM/TEM |
Chen and Zhu13 developed interesting pH-responsive mesoporous silica nanoparticles that showed promising controlled-release characteristics suitable for achieving good therapeutic effects in localized drug delivery. The mesoporous silica nanoparticles were prepared using cetyltrimethyl ammonium bromide (CTAB) as a template in the base-catalyzed condensation reaction of tetraethyl orthosilicate (TEOS). Ibuprofen was incorporated and the MSNs were coated with chitosan, and the release of the drug was evaluated at pH 6.8 and 7.4. TEM images showed uniform nanospheres with regular arrays of channels with diameters of 90–140 nm, before and after ibuprofen incorporation. Small-angle XRD (SAXRD) analyses showed three peaks that indicated a hexagonal unit cell measuring 48.5 Å. The N2 adsorption–desorption isotherm technique was used to characterize the effects of chitosan coating and the incorporation of ibuprofen molecules in MSN structures. The type IV isotherm curves obtained indicated that the MSN had a mesoporous structure, while loading with ibuprofen molecules resulted in reduced N2 adsorption, thus revealing that a large quantity of drug molecules had been loaded in the mesoporous channels. Samples coated with chitosan showed decreased nitrogen adsorption, due to the sealing effect of the outer chitosan layer. It was concluded that the chitosan layer was retained by hydrogen bonding to the mesoporous silica nanoparticles. In addition, the in vitro ibuprofen release was sensitive to the pH of the medium, with maximum release of the drug at pH 6.8, which is close to the pH found in the vicinity of certain tumor cells and inflammatory tissues.
Nanoscale metal–organic frameworks
MOFs constitute a class of porous materials that has increasingly attracted research interest in recent years. These substances include thousands of different hybrid structures consisting of coordination centers (metal ions) and organic linker agents (also known as spacers).97 Figure 1D illustrates an MOF. A solid can be considered an MOF if the links between the metal ions and linker agents are strong and provide robustness to the material. In addition, these materials must have high crystallinity and must exhibit porosity.98
MOFs are promising for numerous applications, including the loading and controlled release of drugs, because this material can exhibit an exceptionally high surface area, with large pore size.99–101 However, MOFs need to be scaled down to nanoscale metal–organic frameworks (NMOFs) in order to be used as drug carriers within blood vessels.102,103 The interest in NMOFs stems from their suitability for use in biomedical and pharmaceutical applications and to enable controlled release of drugs administered intravenously.104 Compared with conventional porous materials, advantages of NMOFs include the ability to incorporate large amounts of drugs as well as their adjustable composition and structure. Due to this versatility, NMOFs are promising platforms for both drug delivery (therapeutic function) and molecular imaging (diagnostic function), either separately or in the same system (known as theranostics).105
Synthesis of NMOFs can be achieved at relatively moderate temperatures, using diffusion, solvent evaporation, solvothermal, microwave, and ultrasound techniques. After the synthesis, an extremely important step is activation of the material, in order to unclog pores and remove guest molecules (eg, solvent remnants). Activation can be performed by exchanging solvents, lyophilization, and treatment with supercritical CO2.101
The characterization techniques applied to NMOFs are very similar to those used for porous materials in general. The stability of NMOFs is a very important feature, and characterization is often used after synthesis or after heating in order to demonstrate the properties of the material after removal of the guest molecules.
The successful synthesis of NMOFs can be confirmed by analysis of crystallinity using XRD, with the product being in the form of either powder or monocrystals, and the analysis also enables evaluation of the purity of the material. XRD has also been used to characterize changes in the framework following drug/nanoparticle incorporation.106 Microscopy techniques such as SEM and TEM provide information about the structure, morphology, and possible presence of defects.107–109 The porosity of the material can be determined by the adsorption/desorption technique, usually employing the adsorption of N2 at 77 K. The BET and Langmuir equations are typically employed to determine textural properties, such as surface area and pore volume.
In pioneering research, synthesis was performed of the MOFs denoted MIL 100 and MIL 101 (where MIL stands for “Materials of Institut Lavosier”). Mercury porosimetry analysis showed that these materials have surface areas 3 and 5 times larger, respectively, compared to the values obtained for MCM-41 mesoporous silica nanoparticles (where MCM stands for Mobil Crystalline Material), showing the great advantage of this new material.85
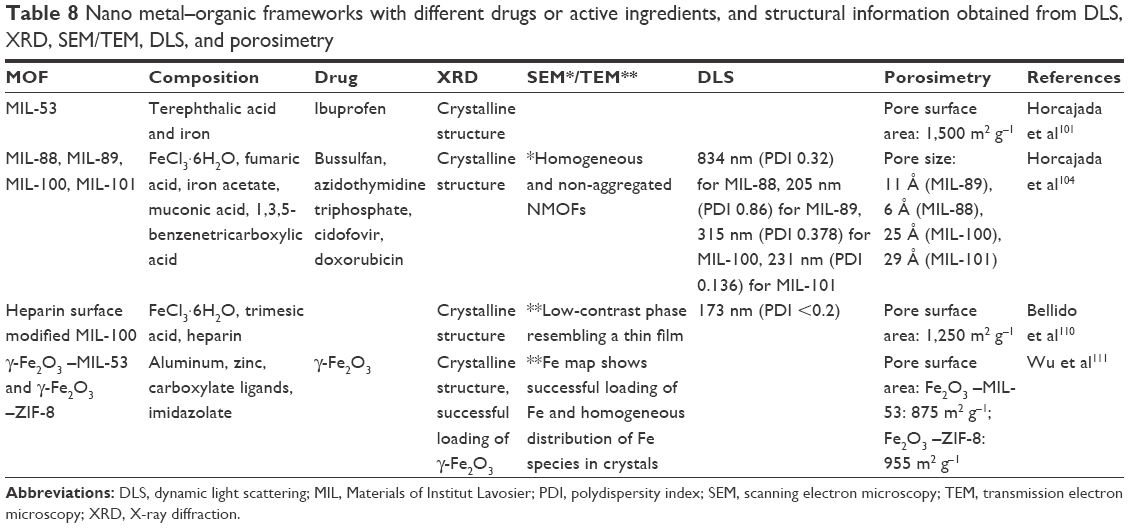
Table 8 shows some examples of NMOFs, their composition, the drug or active ingredient used, and the information obtained from analyses using XRD, microscopy, DLS, and porosimetry.
 | Table 8 Nano metal–organic frameworks with different drugs or active ingredients, and structural information obtained from DLS, XRD, SEM/TEM, DLS, and porosimetry |
Zhao et al112 developed novel MOF-based theranostic core-shell composites, comprising a UiO-66 MOF shell on a Fe3O4 core, for simultaneous drug delivery and magnetic resonance imaging. TEM images showed uniform core-shell morphology and a 25 nm-thick UiO-66 shell. X-ray diffractograms indicated the existence of a shell on the surface of the iron nanoparticles, with the simultaneous presence of the characteristic peaks of Fe3O4 and UiO-66. The drug-loading capacity was analyzed in terms of the porosity of the shells, using N2 adsorption–desorption isotherms. The resulting curves showed that the total pore volume (Vtotal) and the BET surface (SBET) of the Fe3O4@-UiO-66 particles were 0.21 cm3 g−1 and 149.75 m2 g−1, respectively. These are high values, in terms of drug-loading capacity, but are lower than for the pure UiO-66 MOF, due to the presence of the inner nonporous iron core. Tests using doxorubicin showed a high drug-loading capacity and sustained drug release, making Fe3O4@-UiO-66 an excellent drug delivery carrier.
Conclusion
Nanomaterials have considerable potential for use in pharmaceutical and biomedical applications, due to their novel chemical and physical characteristics. In recent years, there has been rapid development of nanomaterials suitable for transporting drugs, with the aims of optimizing drug treatment and decreasing side effects. It has, therefore, become crucial to understand the characteristics of these materials in order to ensure their safe use. This review describes the different methods that are commonly used to characterize nanocarriers, and outlines their essential physicochemical properties. A brief description of each technique is provided, together with their relative merits for use with different nanocarrier systems. This information is important for selection of appropriate techniques for the characterization of a potential nanocarrier under development. The appropriate combinations of these techniques can provide the information required to understand their pharmacokinetics and drug-release profiles, and can also lead to new ideas for the improvement of drug delivery systems.
Acknowledgments
This work was supported by the São Paulo State Research Foundation (FAPESP), the Coordination for the Improvement of Higher Education Personnel (CAPES), the National Council for Scientific and Technological Development (CNPq), and the Support Program for Scientific Development/School of Pharmaceutical Sciences-São Paulo State University (PADC/FCF-UNESP). The current affiliation of Eloísa Berbel Manaia is, the Institute of Chemistry, Universidade Estadual Paulista (UNESP), Rua Prof Francisco Degni 55, 14800-060, Araraquara, SP, Brazil.
Author contributions
All authors contributed toward data analysis, drafting and critically revising the paper and agree to be accountable for all aspects of the work.
Disclosure
The authors report no conflicts of interest in this work.
References
Petros RA, DeSimone JM. Strategies in the design of nanoparticles for therapeutic applications. Nat Rev Drug Discov. 2010;9(8):615–627. | ||
Lin PC, Lin S, Wang PC, Sridhar R. Techniques for physicochemical characterization of nanomaterials. Biotechnol Adv. 2014;32(4):711–726. | ||
Aznar E, Marcos MD, Martínez-Máñez R, et al. pH- and photo-switched release of guest molecules from mesoporous silica supports. J Am Chem Soc. 2009;131(19):6833–6843. | ||
Dong YD, Boyd BJ. Applications of X-ray scattering in pharmaceutical science. Int J Pharm. 2011;417(1–2):101–111. | ||
Chang JH, Shim CH, Kim BJ, Shin Y, Exarhos GJ, Kim KJ. Bicontinuous, thermoresponsive, L3-phase silica nanocomposites and their smart drug-delivery applications. Adv Mater. 2005;17(5):634–637. | ||
Wen CJ, Zhang LW, Al-Suwayeh SA, Yen TC, Fang JY. Theranostic liposomes loaded with quantum dots and apomorphine for brain targeting and bioimaging. Int J Nanomedicine. 2012;7:1599–1611. | ||
Yaghmur A, Glatter O. Characterization and potential applications of nanostructured aqueous dispersions. Adv Colloid Interface Sci. 2009;147–148:333–342. | ||
Bae KH, Lee JY, Lee SH, Park TG, Nam YS. Optically traceable solid lipid nanoparticles loaded with siRNA and paclitaxel for synergistic chemotherapy with in situ imaging. Adv Healthc Mater. 2013;2(4):576–584. | ||
Liu X, Dai Q, Austin L, et al. A one-step homogeneous immunoassay for cancer biomarker detection using gold nanoparticle probes coupled with dynamic light scattering. J Am Chem Soc. 2008;130(9):2780–2782. | ||
Gaisin NK, Gnezdilov OI, Pashirova TN, et al. Micellar and liquid-crystalline properties of bicyclic fragment-containing cationic surfactant. Colloid J. 2010;72(6):764–770. | ||
Andrade F, das Neves J, Gener P, et al. Biological assessment of self-assembled polymeric micelles for pulmonary administration of insulin. Nanomedicine. 2015;11(7):1621–1631. | ||
Yang Q, Wang S, Fan P, et al. pH-responsive carrier system based on carboxylic acid modified mesoporous silica and polyelectrolyte for drug delivery. Chem Mater. 2005;17(24):5999–6003. | ||
Chen F, Zhu Y. Chitosan enclosed mesoporous silica nanoparticles as drug nano-carriers: sensitive response to the narrow pH range. Microporous Mesoporous Mater. 2012;150:83–89. | ||
Sawyer LC, Grubb DT, Meyers GF. Polymer Microscopy. 3rd ed. New York: Springer; 2008. | ||
West AR. Solid State Chemistry and its Applications. 1st ed. New York: John Wiley & Sons; 1992. | ||
Kohlbrecher J, Bressler I. SASfit. Villigen, Switzerland: Paul Scherrer Institut; 2014. | ||
Mulet X, Boyd BJ, Drummond CJ. Advances in drug delivery and medical imaging using colloidal lyotropic liquid crystalline dispersions. J Colloid Interface Sci. 2013;393:1–20. | ||
Nascimento TL, Hillaireau H, Noiray M, et al. Supramolecular organization and siRNA binding of hyaluronic acid-coated lipoplexes for targeted delivery to the CD44 receptor. Langmuir. 2015;31(41):11186–11194. | ||
Manaia EB, Kaminski RC, de Oliveira AG, Corrêa MA, Chiavacci LA. Multifunction hexagonal liquid-crystal containing modified surface TiO2 nanoparticles and terpinen-4-ol for controlled release. Int J Nanomedicine. 2015;10:811–819. | ||
Inobe T, Takahashi K, Maki K, et al. Asymmetry of the GroEL-GroES complex under physiological conditions as revealed by small-angle x-ray scattering. Biophysi J. 2008;94(4):1392–1402. | ||
Chemin C, Péan JM, Bourgaux C, et al. Supramolecular organization of S12363-liposomes prepared with two different remote loading processes. Biochim Biophys Acta. 2009;1788(5):926–935. | ||
Petoukhov MV, Svergun DI. Applications of small-angle X-ray scattering to biomacromolecular solutions. Int J Biochem Cell Biol. 2013;45(2):429–437. | ||
Manaia EB, Kaminski RCK, Soares CP, et al. Liquid crystalline formulations containing modified surface TiO2 nanoparticles obtained by sol–gel process. J Solgel Sci Technol. 2012;63(2):251–257. | ||
Rissi NC, Guglielmi DAS, Corrêa MA, Chiavacci LA. Relationship between composition and organizational levels of nanostructured systems formed by Oleth 10 and PPG-5-Ceteth-20 for potential drug delivery. BJPS. 2014;50(3):653–661. | ||
Brar SK, Verma M. Measurement of nanoparticles by light-scattering techniques. Trends Analyt Chem. 2011;30(1):4–17. | ||
Hall JB, Dobrovolskaia MA, Patri AK, McNeil SE. Characterization of nanoparticles for therapeutics. Nanomedicine (Lond). 2007;2(6):789–803. | ||
Schoch RB, Han J, Renaud P. Transport phenomena in nanofluidics. Rev Mod Phys. 2008;80(3):839–883. | ||
Kaszuba M, Corbett J, Watson FM, Jones A. High-concentration zeta potential measurements using light-scattering techniques. Philos Trans A Math Phys Eng Sci. 2010;368(1927):4439–4451. | ||
Reimer L. Scanning Electron Microscopy: Physics of Image Formation and Microanalysis. 2nd ed. Heidelberg: Springer-Verlag Berlin Heidelberg; 2000. | ||
Bogner A, Thollet G, Basset D, Jouneau PH, Gauthier C. Wet STEM: a new development in environmental SEM for imaging nano-objects included in a liquid phase. Ultramicroscopy. 2005;104(3–4):290–301. | ||
Xiong X, Wang Y, Zou W, Duan J, Chen Y. Preparation and characterization of magnetic chitosan microcapsules. J Chem. 2012;2013(2013):1–8. | ||
Allan-Wojtas P, Hansen LT, Paulson AT. Microstructural studies of probiotic bacteria-loaded alginate microcapsules using standard electron microscopy techniques and anhydrous fixation. LWT-Food Sci Technol. 2008;41(1):101–108. | ||
Hoesli CA, Kiang RL, Mocinecová D, et al. Reversal of diabetes by βTC3 cells encapsulated in alginate beads generated by emulsion and internal gelation. J Biomed Mater Res B Appl Biomater. 2012;100(4):1017–1028. | ||
Williams DB, Carter CB. Transmission Electron Microscopy: A Textbook for Materials Science. 2nd ed. New York: Springer; 2009. | ||
Govender T, Riley T, Ehtezazi T, et al. Defining the drug incorporation properties of PLA–PEG nanoparticles. Int J Pharm. 2000;199(1):95–110. | ||
Rosevear FB. The microscopy of the liquid crystalline neat and middle phases of soaps and synthetic detergents. J Am Oil Chem Soc. 1954;31(12):628–639. | ||
Müller-Goymann CC. Physicochemical characterization of colloidal drug delivery systems such as reverse micelles, vesicles, liquid crystals and nanoparticles for topical administration. Eur J Pharm Biopharm. 2004;58(2):343–356. | ||
Carvalho FC, Sarmento VH, Chiavacci LA, Barbi MS, Gremião MP. Development and in vitro evaluation of surfactant systems for controlled release of zidovudine. J Pharm Sci. 2010;99(5):2367–2374. | ||
Giesche H. Mercury porosimetry: a general (practical) overview. Part Part Syst Charact. 2006;23(1):9–19. | ||
Van Brakel J, Modrý S, Svatá M. Mercury porosimetry: state of the art. Powder Technol. 1981;29(1):1–12. | ||
Sher P, Ingavle G, Ponrathnam S, Poddar P, Pawar AP. Modulation and optimization of drug release from uncoated low density porous carrier based delivery system. AAPS PharmSciTech. 2009;10(2):547–558. | ||
Israelachvili J. The science and applications of emulsions – an overview. Colloids Surf A Physicochem Eng Asp. 1994;91:1–8. | ||
Bubnov A, Kašpar M, Hamplová V, Dawin U, Giesselmann F. Thermotropic and lyotropic behaviour of new liquid-crystalline materials with different hydrophilic groups: synthesis and mesomorphic properties. Beilstein J Org Chem. 2013;9:425–436. | ||
Otto A, du Plessis J, Wiechers JW. Formulation effects of topical emulsions on transdermal and dermal delivery. Int J Cosmet Sci. 2009;31(1):1–19. | ||
Cohen-Avrahami M, Libster D, Aserin A, Garti N. Penetratin-induced transdermal delivery from H(II) mesophases of sodium diclofenac. J Control Release. 2012;159(3):419–428. | ||
Zeng N, Gao X, Hu Q, et al. Lipid-based liquid crystalline nanoparticles as oral drug delivery vehicles for poorly water-soluble drugs: cellular interaction and in vivo absorption. Int J Nanomedicine. 2012;7:3703–3718. | ||
Bisset NB, Boyd BJ, Dong YD. Tailoring liquid crystalline lipid nanomaterials for controlled release of macromolecules. Int J Pharm. 2015;495(1):241–248. | ||
Chen Y, Ma P, Gui S. Cubic and hexagonal liquid crystals as drug delivery systems. Biomed Res Int. 2014;2014:815981. | ||
Garti N, Hoshen G, Aserin A. Lipolysis and structure controlled drug release from reversed hexagonal mesophase. Colloids Surf B Biointerfaces. 2012;94:36–43. | ||
Wang Z, Zhou W. Lamellar liquid crystals of Brij 97 aqueous solutions containing different additives. J Solution Chem. 2009;38(6):659–668. | ||
Briggs J, Chung H, Caffrey M. The temperature-composition phase diagram and mesophase structure characterization of the monoolein/water system. J Phys II France. 1996;6(5):723–751. | ||
Negrini R, Mezzenga R. pH-responsive lyotropic liquid crystals for controlled drug delivery. Langmuir. 2011;27(9):5296–5303. | ||
Beloglazova NV, Shmelin PS, Speranskaya ES, et al. Quantum dot loaded liposomes as fluorescent labels for immunoassay. Anal Chem. 2013;85(15):7197–7204. | ||
Muthu MS, Leong DT, Mei L, Feng SS. Nanotheranostics – application and further development of nanomedicine strategies for advanced theranostics. Theranostics. 2014;4(6):660–677. | ||
Angelova MI, Soléau S, Méléard P, Faucon F, Bothorel P. Preparation of giant vesicles by external AC electric fields. Kinetics and applications. Progr Colloid Polym Sci. 1992;(89):127–131. | ||
Carugo D, Bottaro E, Owen J, Stride E, Nastruzzi C. Liposome production by microfluidics: potential and limiting factors. Sci Rep. 2016;6:25876. | ||
Pattni BS, Chupin VV, Torchilin VP. New developments in liposomal drug delivery. Chem Rev. 2015;115(19):10938–10966. | ||
Johnston MJ, Semple SC, Klimuk SK, et al. Therapeutically optimized rates of drug release can be achieved by varying the drug-to-lipid ratio in liposomal vincristine formulations. Biochim Biophys Acta. 2006;1758(1):55–64. | ||
Chen H, Zheng Y, Jiang JH, Wu HL, Shen GL, Yu RQ. An ultrasensitive chemiluminescence biosensor for cholera toxin based on ganglioside-functionalized supported lipid membrane and liposome. Biosens Bioelectron. 2008;24(4):684–689. | ||
Allen TM, Cullis PR. Liposomal drug delivery systems: from concept to clinical applications. Adv Drug Deliv Rev. 2013;65(1):36–48. | ||
Fattal E, Tsapis N. Nanomedicine technology: current achievements and new trends. Clin Transl Imaging. 2014;2(1):77–87. | ||
Lira RB, Seabra MABL, Matos ALL, et al. Studies on intracellular delivery of carboxyl-coated CdTe quantum dots mediated by fusogenic liposomes. J Mater Chem B Mater. 2013;1(34):4297–4305. | ||
Meng J, Guo F, Xu H, Liang W, Wang C, Yang XD. Combination therapy using co-encapsulated resveratrol and paclitaxel in liposomes for drug resistance reversal in breast cancer cells in vivo. Sci Rep. 2016;6:22390. | ||
Siekmann B, Westesen K. Sub-micron sized parenteral carrier systems based on solid lipids. Pharm Pharmacol Lett. 1992;1(3):123–126. | ||
Mehnert W, Mäder K. Solid lipid nanoparticles: production, characterization and applications. Adv Drug Deliv Rev. 2001;47(2–3):165–196. | ||
Dong Y, Ng WK, Shen S, Kim S, Tan RB. Solid lipid nanoparticles: continuous and potential large-scale nanoprecipitation production in static mixers. Colloids Surf B Biointerfaces. 2012;94:68–72. | ||
Müller RH, Mäder K, Gohla S. Solid lipid nanoparticles (SLN) for controlled drug delivery – a review of the state of the art. Eur J Pharm Biopharm. 2000;50(1):161–177. | ||
Liu D, Chen L, Jiang S, et al. Formulation and characterization of hydrophilic drug diclofenac sodium-loaded solid lipid nanoparticles based on phospholipid complexes technology. J Liposome Res. 2014;24(1):17–26. | ||
Battaglia L, Gallarate M, Peira E, et al. Solid lipid nanoparticles for potential doxorubicin delivery in glioblastoma treatment: preliminary in vitro studies. J Pharm Sci. 2014;103(7):2157–2165. | ||
Sarmento B, Martins S, Ferreira D, Souto EB. Oral insulin delivery by means of solid lipid nanoparticles. Int J Nanomedicine. 2007;2(4):743–749. | ||
Croy SR, Kwon GS. Polymeric micelles for drug delivery. Curr Pharm Des. 2006;12(36):4669–4684. | ||
Papagiannaros A, Levchenko T, Hartner W, Mongayt D, Torchilin V. Quantum dots encapsulated in phospholipid micelles for imaging and quantification of tumors in the near-infrared region. Nanomedicine. 2009;5(2):216–224. | ||
Frank D, Tyagi C, Tomar L, et al. Overview of the role of nanotechnological innovations in the detection and treatment of solid tumors. Int J Nanomedicine. 2014;9:589–613. | ||
Vrignaud S, Anton N, Gayet P, Benoit JP, Saulnier P. Reverse micelle-loaded lipid nanocarriers: a novel drug delivery system for the sustained release of doxorubicin hydrochloride. Eur J Pharm Biopharm. 2011;79(1):197–204. | ||
Zhang Y, Huang Y, Li S. Polymeric micelles: nanocarriers for cancer-targeted drug delivery. AAPS PharmSciTech. 2014;15(4):862–871. | ||
Kim D, Gao ZG, Lee ES, Bae YH. In vivo evaluation of doxorubicin-loaded polymeric micelles targeting folate receptors and early endosomal pH in drug-resistant ovarian cancer. Mol Pharm. 2009;6(5):1353–1362. | ||
Song H, Geng H, Ruan J, et al. Development of Polysorbate 80/Phospholipid mixed micellar formation for docetaxel and assessment of its in vivo distribution in animal models. Nanoscale Res Lett. 2011;6(1):354. | ||
Wang Y, Ding Y, Liu Z, Liu X, Chen L, Yan W. Bioactive lipids-based pH sensitive micelles for co-delivery of doxorubicin and ceramide to overcome multidrug resistance in leukemia. Pharm Res. 2013;30(11):2902–2916. | ||
Chen H, Wu F, Li J, Jiang X, Cai L, Li X. DUP1 peptide modified micelle efficiently targeted delivery paclitaxel and enhance mitochondrial apoptosis on PSMA-negative prostate cancer cells. Springerplus. 2016;5:362. | ||
Wu Z, Zou X, Yang L, et al. Thermosensitive hydrogel used in dual drug delivery system with paclitaxel-loaded micelles for in situ treatment of lung cancer. Colloids Surf B Biointerfaces. 2014;122:90–98. | ||
Vallet-Regí M, Izquierdo-Barba I, Colilla M. Structure and functionalization of mesoporous bioceramics for bone tissue regeneration and local drug delivery. Philos Trans A Math Phys Eng Sci. 2012;370(1963):1400–1421. | ||
Andersson J, Rosenholm J, Areva S, Lindén M. Influences of material characteristics on ibuprofen drug loading and release profiles from ordered micro- and mesoporous silica matrices. Chem Mater. 2004;16(21):4160–4167. | ||
Horcajada P, Rámila A, Pérez-Pariente J, Vallet-Regi M. Influence of pore size of MCM-41 matrices on drug delivery rate. Microporous Mesoporous Mater. 2004;68(1–3):105–109. | ||
Izquierdo-Barba I, Martinez Á, Doadrio AL, Pérez-Pariente J, Vallet-Regí M. Release evaluation of drugs from ordered three-dimensional silica structures. Eur J Pharm Sci. 2005;26(5):365–373. | ||
Vallet-Regí M, Balas F, Arcos D. Mesoporous materials for drug delivery. Angew Chem Int Ed Engl. 2007;46(40):7548–7558. | ||
Tandon P, Förster G, Neubert R, Wartewig S. Phase transitions in oleic acid as studied by X-ray diffraction and FT-Raman spectroscopy. J Mol Struc. 2000;524(1–3):201–215. | ||
De Jong WH, Borm PJ. Drug delivery and nanoparticles: applications and hazards. Int J Nanomedicine. 2008;3(2):133–149. | ||
Torchilin VP. Recent advances with liposomes as pharmaceutical carriers. Nat Rev Drug Discov. 2005;4(2):145–160. | ||
Haag R, Kratz F. Polymer therapeutics: concepts and applications. Angew Chem Int Ed Engl. 2006;45(8):1198–1215. | ||
Sanvicens N, Marco MP. Multifunctional nanoparticles–properties and prospects for their use in human medicine. Trends Biotechnol. 2008;26(8):425–433. | ||
Trewyn BG, Slowing II, Giri S, Chen HT, Lin VS. Synthesis and functionalization of a mesoporous silica nanoparticle based on the sol–gel process and applications in controlled release. Acc Chem Res. 2007;40(9):846–853. | ||
Slowing II, Trewyn BG, Giri S, Lin VSY. Mesoporous silica nanoparticles for drug delivery and biosensing applications. Adv Funct Mater. 2007;17(8):1225–1236. | ||
Vivero-Escoto JL, Slowing II, Trewyn BG, Lin VS. Mesoporous silica nanoparticles for intracellular controlled drug delivery. Small. 2010;6(18):1952–1967. | ||
Lodha A, Lodha M, Patel A, et al. Synthesis of mesoporous silica nanoparticles and drug loading of poorly water soluble drug cyclosporin A. J Pharm Bioallied Sci. 2012;4 (Suppl 1):S92–S94. | ||
He Q, Shi J, Chen F, Zhu M, Zhang L. An anticancer drug delivery system based on surfactant-templated mesoporous silica nanoparticles. Biomaterials. 2010;31(12):3335–3346. | ||
Lee CH, Cheng SH, Wang YJ, et al. Near-infrared mesoporous silica nanoparticles for optical imaging: characterization and in vivo biodistribution. Adv Funct Mater. 2009;19(2):215–222. | ||
Keskin S, Kizilel S. Biomedical applications of metal organic frameworks. Ind Eng Chem Res. 2011;50(4):1799–1812. | ||
Rowsell JLC, Yaghi OM. Metal–organic frameworks: a new class of porous materials. Microporous Mesoporous Mater. 2004;73(1–2):3–14. | ||
An J, Geib SJ, Rosi NL. Cation-triggered drug release from a porous zinc-adeninate metal-organic framework. J Am Chem Soc. 2009;131(24):8376–8377. | ||
Horcajada P, Serre C, Maurin G, et al. Flexible porous metal-organic frameworks for a controlled drug delivery. J Am Chem Soc. 2008;130(21):6774–6780. | ||
Horcajada P, Serre C, Vallet-Regí M, Sebban M, Taulelle F, Férey G. Metal-organic frameworks as efficient materials for drug delivery. Angew Chem. 2006;118(36):6120–6124. | ||
Lin W, Rieter WJ, Taylor KM. Modular synthesis of functional nanoscale coordination polymers. Angew Chem Int Ed Engl. 2009;48(4):650–658. | ||
Hoskins BF, Robson R. Infinite polymeric frameworks consisting of three dimensionally linked rod-like segments. J Am Chem Soc. 1989;111(15):5962–5964. | ||
Horcajada P, Chalati T, Serre C, et al. Porous metal-organic-framework nanoscale carriers as a potential platform for drug delivery and imaging. Nat Mater. 2010;9(2):172–178. | ||
Cai W, Chu CC, Liu G, Wáng YX. Metal-organic framework-based nanomedicine platforms for drug delivery and molecular imaging. Small. 2015;11(37):4806–4822. | ||
Takamizawa S, Nakata E, Yokoyama H, Mochizuki K, Mori W. Carbon dioxide inclusion phases of a transformable 1D coordination polymer host [Rh2(O2CPh)4(pyz)]n. Angew Chem. 2003;115(36):4467–4470. | ||
Yang Lr, Song S, Zhang Hm, et al. 3D metal–organic frameworks polymers of Pr(III) and Eu(III) with pyridine-2, 6-dicarboxylic acid: synthesis, structure and luminescent properties. Synthetic Met. 2012;162(3–4):261–267. | ||
Do XD, Hoang VT, Kaliaguine S. MIL-53 (Al) mesostructured metal-organic frameworks. Microporous Mesoporous Mater. 2011;141(1–3):135–139. | ||
Liu Z, Fujita N, Miyasaka K, et al. A review of fine structures of nanoporous materials as evidenced by microscopic methods. Microscopy (Oxf). 2013;62(1):109–146. | ||
Bellido E, Hidalgo T, Lozano MV, et al. Heparin-engineered mesoporous iron metal-organic framework nanoparticles: toward stealth drug nanocarriers. Adv Healthc Mater. 2015;4(8):1246–1257. | ||
Wu YN, Zhou M, Li S, et al. Magnetic metal-organic frameworks: γ-Fe2O3@ MOFs via confined in situ pyrolysis method for drug delivery. Small. 2014;10(14):2927–2936. | ||
Zhao HX, Zou Q, Sun SK, et al. Theranostic metal–organic framework core–shell composites for magnetic resonance imaging and drug delivery. Chem Sci. 2016;7(8):5294–5301. |
 © 2017 The Author(s). This work is published and licensed by Dove Medical Press Limited. The
full terms of this license are available at https://www.dovepress.com/terms
and incorporate the Creative Commons Attribution
- Non Commercial (unported, 3.0) License.
By accessing the work you hereby accept the Terms. Non-commercial uses of the work are permitted
without any further permission from Dove Medical Press Limited, provided the work is properly
attributed. For permission for commercial use of this work, please see paragraphs 4.2 and 5 of our Terms.
© 2017 The Author(s). This work is published and licensed by Dove Medical Press Limited. The
full terms of this license are available at https://www.dovepress.com/terms
and incorporate the Creative Commons Attribution
- Non Commercial (unported, 3.0) License.
By accessing the work you hereby accept the Terms. Non-commercial uses of the work are permitted
without any further permission from Dove Medical Press Limited, provided the work is properly
attributed. For permission for commercial use of this work, please see paragraphs 4.2 and 5 of our Terms.