Back to Journals » Patient Preference and Adherence » Volume 9
Patients’ preferences for attributes related to health care services at hospitals in Amhara Region, northern Ethiopia: a discrete choice experiment
Authors Berhane A, Enquselassie F
Received 5 May 2015
Accepted for publication 11 August 2015
Published 10 September 2015 Volume 2015:9 Pages 1293—1301
DOI https://doi.org/10.2147/PPA.S87928
Checked for plagiarism Yes
Review by Single anonymous peer review
Peer reviewer comments 3
Editor who approved publication: Dr Johnny Chen
Adugnaw Berhane,1 Fikre Enquselassie2
1College of Health Sciences, Debre Berhan University, 2School of Public Health, Addis Ababa University, Addis Ababa, Ethiopia
Background: Information from the patient’s point of view is essential in policy and clinical decisions. Prioritizing what patients value, need, and prefer in various aspects of a health program can be helpful in evaluating and designing hospital health care services.
Objective: To examine patients’ preference for attributes related to health care services and to ascertain the relative impact of attributes at hospitals in Amhara Region, northern Ethiopia.
Methods: A stated-preference discrete choice experiment survey was performed in multistage, stratified, and systematic sampling of patients who visited the hospitals. Attributes were selected based on a literature review of the most important characteristics of hospital health care service and reviewed and validated with inputs from patients and researchers in the field. Attributes included in the study were waiting time, physician communication, nursing communication, drug availability, continuity of care, and diagnostic facilities. A random-effects probit model was used to perform the analysis.
Results: One thousand and five respondents who received care in the outpatient and inpatient departments participated in the study. All attributes included in the study affected the choice of hospital. Patients were willing to wait up to 3.3 hours and 2.7 hours to get full drugs in the hospital and good nursing communication, respectively. The interaction terms indicate that preferences differ with the variables sex, occupation, and type of hospital. Patients expressed clear preferences in a decreasing order of all the significant attribute levels: a lot of diagnostic facilities, full drug availability, continuity of care, good nursing communication, partial drug availability, good physician communication, and shorter waiting time for the consultation.
Conclusion: Different hospital care attributes had a significant and different influence on patients’ choice of hospital. The study informs about patients’ preferences and the trade-offs among different possible process-related attributes. Decision makers should focus on patient preferences and consider selected attributes when designating hospital services, and hence to maximize patient satisfaction.
Keywords: patient preference, hospital health care, hospital choice, patient satisfaction
Introduction
Examining the quality and efficiency of services given for the patient is the main concern of the public health sector, and studying patients’ preferences with the quality of hospital services is an important method for evaluation of health services.1,2 Patients differ from each other in their social, biologic, or cultural characteristics as well as in their preferences, and the need for a more patient-centered approach in clinical practice and evaluation studies is widely acknowledged. Previous reports have shown that patients’ preferences have significantly impacted patients’ willingness to use health care services.3–5
Hospitals should put in place priority techniques in the case of resource limitations.6 Even though this is of powerful interest to the public, customers are not asked about their preferences and views. They are also not involved in the decision-making process. The patient’s point of view is important in relation to policy and clinical decisions. Studying what patients value and need, and how patients prefer different features of hospital health care, can be valuable in evaluating and designing hospital health care services. Whenever hospital processes are reorganized or new products are designed, the needs and preferences of patients have to be considered to assess patients’ priorities and their willingness to wait. The discrete choice experiment (DCE) technique is frequently applied to identify patients’ preferences;7 this is a stated-preference approach that confronts patients with hypothetical scenarios, of which only one can be chosen. Currently, this technique is applied to elicit patient preferences in hospital health care.7,8
The foundation of DCEs lies in the hypothesis that services can be explained with the attributes they have, and the value of a service depends on the level and nature of these attributes.9 These attributes might explain the effect of the services on health outcomes or the process by which the services are delivered for the non-health outcomes.10 Techniques for determining customers’ preferences, as preferred by health economists, are based on random utility theory; ie, patients choose the alternative that gives them the highest utility.10
A DCE should capture the main attributes so as to avoid concerns about the omitted attributes by the majority of the respondents.11 DCE can quantify the relative weight of attributes and trade off between attributes that describe respondents preference in a hospital health care service.12 DCEs also presume that each hospital service is able to be explained with different features and that these features provide different service characteristics,13 and this approach is valuable to setting priorities in giving health care services by measuring the benefit or satisfaction from the services. Despite the Ethiopian government’s efforts in improving the quality of health services delivered to the people, health services are limited and of poor quality. Making health services more congruent with patients’ preferences can be done through fulfilling with different attributes. But this is difficult within the constraints of budgets. Therefore, patients may be required to choose among attributes, and this leads to the necessity of a method for assessing priorities.6 Thus, the aim of this study was to examine patients’ preferences for attributes related to hospital health care services. We were also interested in the level of patients who were willing to trade off between time and other attributes, and to determine the relative importance of these attributes.
Materials and methods
Study setting and design
The study was conducted in nine public hospitals that are located in the Amhara Region of Ethiopia. The Amhara Region is one of the nine regions of Ethiopia located in the northern parts of the country. This was an experimental design, as it combined different levels of attributes, for the purpose of eliciting information about the hospital characteristics in order for patients to decide between the choice of two hypothetical hospital health care services.14
Establishing attributes and levels
The key attributes were established by the main features of patient satisfaction in hospital health care that might differ with the type of health care service. Six attributes were identified through literature review and adopted from other studies: waiting time for the consultation, physician communication, nursing communication, drug availability in the hospital pharmacy, continuity of care, and diagnostic facilities.1,13,15 These attributes were reviewed and validated with outputs from patients and experts in the field, and should practically differ with the type of service provided. The attribute levels were selected to reveal the range of conditions that patients might anticipate experiencing (Table 1).
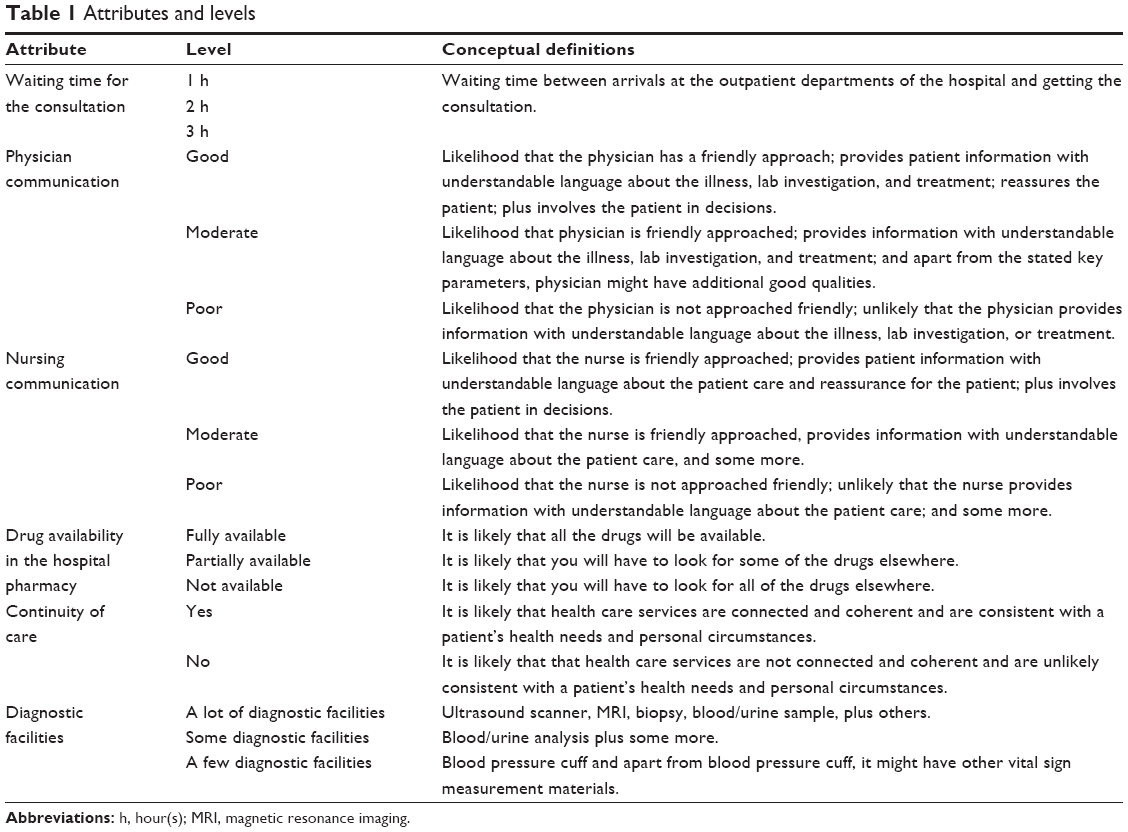 | Table 1 Attributes and levels |
Experimental design
In this study, using a full factorial design based on the selected hospital attributes, ie, five attributes had three levels and one attribute had two levels which gave rise to a total of 486 scenarios (35, 21) was not feasible. Hence, a fractional factorial design with orthogonal main effects was created by using an SPSS software version 17 (SPSS Inc., Chicago, IL, USA) in order to convert the number of scenarios to a satisfactory number in the questionnaire. Sixteen scenarios were generated, and the questionnaire was written to compare these scenarios between two hypothetical hospitals. The questionnaire consisted of eight comparisons between two hypothetical hospitals. Choice sets in the catalog were randomized prior to being written into the questionnaire. Properties of good design of the questionnaire were checked using the properties of level balance, orthogonality, and minimum overlap of attribute levels.14 The correlation between different attribute levels was minimal as a check for orthogonality of the design. We checked for level balance, ie, each attribute level in the questionnaire appeared approximately an equal number of times. In addition, the two hospital scenarios that rarely appeared together in a choice had the same attribute levels, which showed that there was minimum overlap.
The two hospitals were compared as they were different in their characteristics of the six attributes, and respondents had to choose between these hospitals (see the sample scenario pair in Table 2). According to the patients’ choices between the two hospitals, we prioritized and modeled which hospital type was preferred by the patients.
 | Table 2 A sample pair of scenarios |
The DCE questionnaire was pilot tested with 30 patients at a hospital to understand the clarity of attributes and levels, to determine whether respondents understood the task or not, and to understand how patients experienced the exercise.
Sample size determination, sampling, and data collection
Sample size determination
Sample size was determined using a formula of sample size for discrete choice models:16
|
|

where p is the choice share, z is the level of statistical significance and q is failure in choice share; q=1−p; r is the number of replications; and a is the allowable error margin. Choice share p for a particular preference is a share of a single attribute over the total attribute; hence, in our case, p is 1/6. Here, 6 is the number of attributes. Let us assume a heterogeneous population, ie, p=0.167, q=0.833. We want to be 95% confident in our result, ie, z=1.96. Our allowable margin of error is 5%. Our design had 16 replications, meaning the 16 scenarios generated from fractional factorial design changed into the 16 types of hospitals using the given attribute levels; therefore, r=16. We used a design effect value of 2 to accommodate sampling variance and 10% contingency. The final required sample size was 1,054.
Sampling and data collection
In Amhara Region, we sampled nine of the 17 functional public hospitals. Public hospitals are government-owned hospitals. The study focus was only public hospitals, as most of the population in the region use public hospitals. In this region, private hospitals are few in number and serve a lower number of people compared to public hospitals, which serve all segments of the population. Study participants were recruited from the nine selected public hospitals in Amhara Region.
Ethical approval was obtained from the Institutional Review Board of College of Health Sciences at Addis Ababa University (Addis Ababa, Ethiopia). In addition, permission from the Amhara Regional Health Bureau and the respective study hospital administrators was also sought.
A multistage, stratified technique of sampling was used to select the study population. In stage 1, hospitals were stratified as referral and district. Hence, four of the seven referral and five of the ten district hospitals were selected using the lottery method. In stage 2, hospitals were stratified as outpatient and inpatient departments. Proportional allocation of the sample was done to each selected hospital and its departments according to their previous year’s total patient visits for hospital services. All patients had to be at least 18 years of age and either be seeking health care at adult general, medical, or surgical outpatient departments or be patients of medical or surgical wards in an inpatient department.
We used a systematic sampling technique to select respondents among inpatients and outpatients in the selected departments. We took samples based on the average number of patients per day per selected departments everyday from Monday to Friday of the week. For the purpose of this study, every fifth patient attending an outpatient or inpatient department was taken. If the fifth patient was critically ill or died, we excluded them from the study and interviewed the next patient.
The data collector began the work by presenting the study to those present in the triage room, gave information about the study, and made appointments for the interviews. Informed consent of respondents was obtained orally, and the interviews were presented to the respondents at the end of the service, after patients had spent most of the day waiting for a consultation, lab investigation, and dispensing of drugs. The data were collected using the local language Amharic from August to October 2014.
Data analysis
The DCE data were analyzed using a random-effects probit model in STATA version 12 (StataCorp, College Station, Texas, USA), with the assumption that the distribution of the error term was normal and accounted for many observations from each respondent.12,17 We treated each respondent’s choice between pairs as a single observation and included this in the model as the dependent variable. The dependent variable was coded as “1”, which indicated the option being chosen, and “0” indicated the option not being chosen. The differences between the levels of each attribute in each pair of scenarios were considered as independent variables of the study. The variables for analysis are shown in Table 1.
The equation of the model can be presented as:
Ync = β0 + β1 ΔWAITc + β2 ΔPHYSICIANc + β3 ΔNURSINGc + β4 ΔDRUGc + β5 ΔCONTINUITYc + β6 ΔDIAGNOSTICc + ε | (2) |
where ΔY is the difference in utility between option 1 and option 2; n refers to the individual identification; c refers to the number of choice set; β0 is the constant term included to control and test model misspecifications due to unobserved dimensions or unobserved interactions between respondents’ sociodemographic characteristics and dimensions;18 β1, β2, β3, …, etc are part-worth utilities; ΔWAIT, ΔPHYSICIAN, etc represent differences in attribute levels between option 1 and option 2; and ε is the random error term.
Attributes such as waiting time, physician communication, nursing communication, drug availability, continuity of care, and diagnostic facilities were used to fit the main-effects model.
The model baseline (reference level used for all attributes expressed in the constant) was based on poor physician and nursing communication, drug unavailability, and no continuity of care with a few diagnostic facilities in the hospital. Waiting time was treated as a continuous variable with a linear utility function.
Besides analyzing the main effects (the six main attributes), it was also hypothesized that individual characteristics, such as sociodemographic variables and type of hospital visited, could influence preference for a hospital visit. We included variables for age, sex, educational status, marital status, occupation, residence, payment status, hospital type, and patient status. Hospital type was coded as referral and district, and patient status was coded as outpatient and inpatient.
To create a more parsimonious model by including the main effects and interaction terms, the insignificant variables were excluded stepwise one at a time with P-values greater than 0.10.
Marginal rate of substitution (MRS) values were calculated by dividing the coefficient values of the attributes with another attribute, in this case by the waiting time attribute.18 Hence, attributes could be compared on a common value scale in terms of willingness to wait.
Theoretical validity of the study was examined by exploring whether the estimated parameters were in the expected sign. Having good physician communication, good nursing communication, full drug availability in the hospital pharmacy, presence of continuity of care, availability of lots of diagnostic facilities, and less waiting time for the consultation were all anticipated to increase patient satisfaction.
Estimating how much each attribute contributes to the log-likelihood of the model gives the relative impact of the attributes. This can be attained through estimating and reestimating the model by omitting one attribute at a time and estimating the difference between the full and the reduced model log-likelihoods.19 More contribution of the attributes in the total log-likelihoods of the model, as shown by the attributes’ partial log-likelihoods, indicates the attribute was more important.
Results
Sociodemographic characteristics
One thousand and five responses were obtained from the target number of 1,054 questionnaires, which gave a response rate of 95.4%, and this has a potential dataset of 8,040 pairwise observations (1,005× eight questions). Of the total respondents, 580 (57.3%) were males and 209 (21%) of the patients reported themselves as illiterate. The median age of the respondents was 34 (standard deviation =13.5) years, with a range of 18–88 years. A summary of sociodemographic characteristics is presented in Table 3.
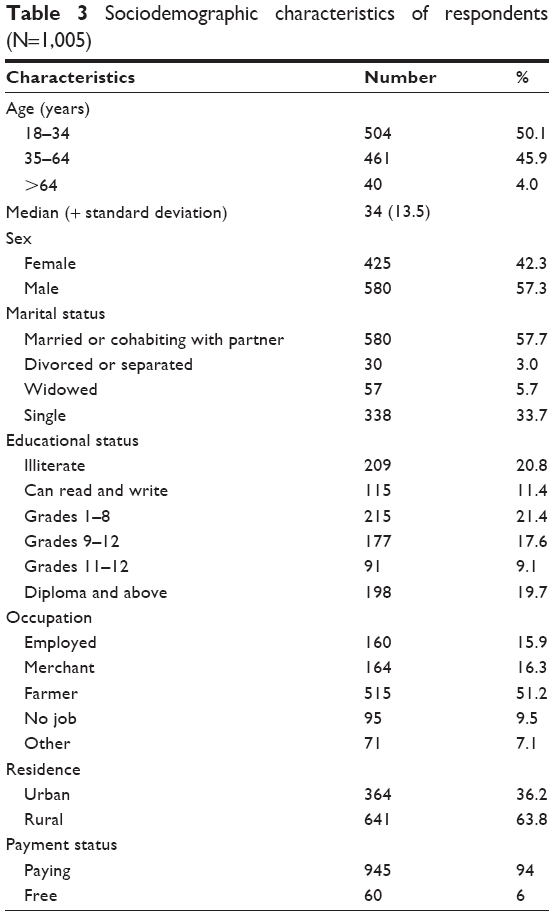 | Table 3 Sociodemographic characteristics of respondents (N=1,005) |
Main-effects model
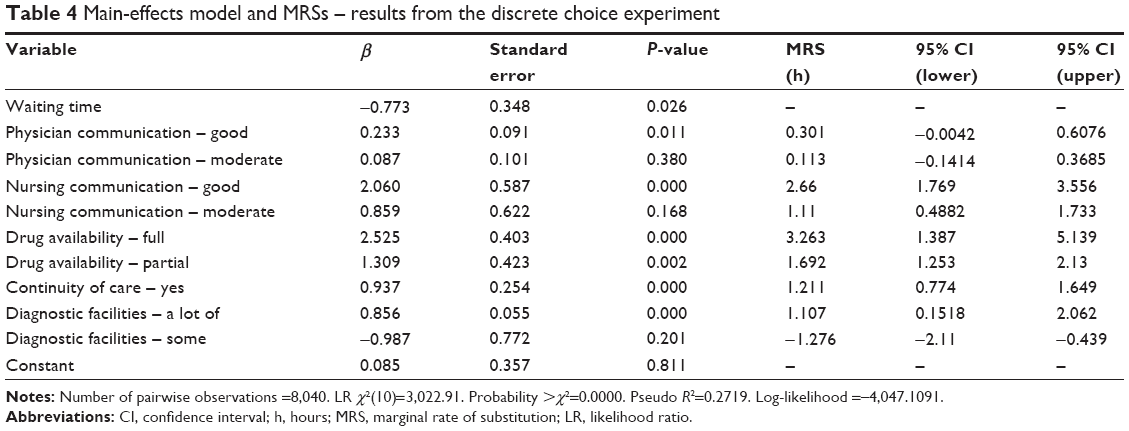
The result of the main-effects model is shown in Table 4. The model result showed a good fit with McFadden’s pseudo R2=0.2719. The model had sensitivity of 87.6%, specificity of 66.7%, negative predictive value of 82.67%, and positive predictive value of 74.74%. In general, the model correctly classified 77.75% of the responses.
 | Table 4 Main-effects model and MRSs – results from the discrete choice experiment |
All attributes had a significant impact on participants’ decisions, as indicated by their coefficients that were significantly different from 0.
The waiting time coefficient (β=−0.773) was of a negative value, as expected, showing a higher probability of choosing a hospital with less waiting time for a consultation; this entails dissatisfaction related with longer waiting time. Coefficients (β) of the attribute levels of good physician communication (β=0.233), good nursing communication (β=2.06), full drug availability (β=2.525), a lot of diagnostic facilities (β=0.856), and the presence of continuity of care (β=0.937) were positive and larger than their respective reference attribute levels, which indicates that, by assuming everything else is equal, participants preferred to visit a hospital which had continuity of care, good physician and nursing communication, full drug availability, and a lot of diagnostic facilities.
MRSs
Table 4 also presents the MRS values between attributes. Calculating the value of one attribute with waiting time for consultation indicated that patients were willing to give up for that attribute if the difference was longer. Waiting time was more important than good nursing communication if the difference in waiting time was longer than 2.7 hours, suggesting that patients would be willing to wait up to 2.7 hours for a hospital with good nursing communication. Waiting time for consultation was more important than full drug availability and a lot of diagnostic facilities in the hospital if the difference in waiting time was longer than 3.3 and 1.1 hours, respectively, indicating that patients would be willing to wait 3.3 and 1.1 hours to be consulted in a setting with full drug availability and a lot of diagnostic facilities, respectively.
Segmented model
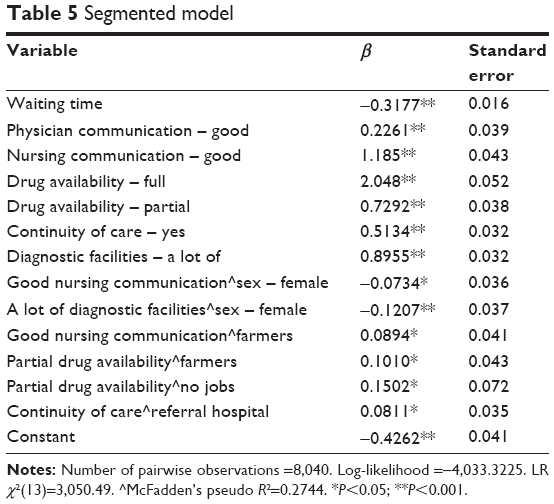
Table 5 presents the results of the segmented model. The segmented model had almost similar fit (pseudo R2=0.2744) with that of the main-effects model. The model had sensitivity of 84.51%, specificity of 70.74%, negative predictive value of 80.20%, and positive predictive value of 76.5%. In general, the model correctly classified 78.03% of the responses.
 | Table 5 Segmented model |
In the segmented model, waiting time, good physician communication, good nursing communication, full drug availability, partial drug availability, presence of continuity of care, and a lot of diagnostic facilities had an influence on patient preference in public hospital health care services. Good nursing communication, a lot of diagnostic facilities, partial drug availability, and presence of continuity of care were present in the interaction effects, demonstrating that these attributes were key for a subgroup of patients.
The statistically significant coefficients of the interaction effects indicated that preferences differed with the variables sex, occupation, and type of hospital. A hospital with good nursing communication (β=0.089) and partial drug availability (β=0.101) was preferred by farmers. Participants with no jobs preferred a hospital with partial drug availability (β=0.150). Those respondents who were from referral hospitals preferred a hospital that has continuity of care (β=0.081). A hospital with good nursing communication and a facility with a lot of diagnostic facilities were less likely preferred by female respondents.
Relative impact of the attributes
Table 6 presents the relative importance of attributes in the main-effects model. The results indicated that a hospital with a lot of diagnostic facilities was ranked at the top, which accounted for 65.9% of the log-likelihood. This was followed by full drug availability in the hospital, continuity of care, and good nursing communication collectively accounting for 23.5%. Interestingly, attribute levels like moderate nursing communication, some diagnostic facilities, and moderate physician communication that were not significant in the main-effects model had a negligible impact on the log-likelihood.
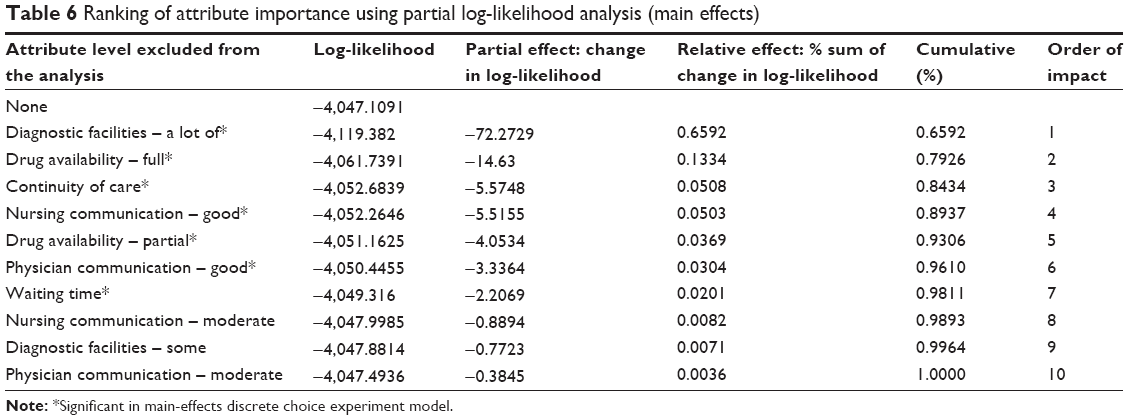 | Table 6 Ranking of attribute importance using partial log-likelihood analysis (main effects) |
Discussion
This study examined patients’ preferences in health care, focusing on patients’ priorities, their willingness to wait, and relative attribute impact at public hospitals. Generally, preferences for the levels under each hospital attribute were consistent with the a priori expectation that a hospital with less waiting time that had hospital levels with good physician and nursing communication, full drug availability, and continuity of care with a lot of diagnostic facilities would be more preferred than hospital levels with poor physician and nursing communication, no drug availability, no continuity of care, and few diagnostic facilities. These directions of the coefficient values provided a check on internal/theoretical validity of the DCE model.
In this study, good physician and nursing communication were among the most important characteristics of health care services preferred by respondents. Similarly, previous studies showed that patient–physician and nursing communication are the key parts of the overall quality of hospital care and treatment20,21 and are the key factors which enhance patient satisfaction with the health care providers.22 This is shown by increasing patient involvement and participation in decision making regarding their treatment.22
Another study also showed that a patient-centered approach to health care, ie, a doctor’s friendly approach, would result in a high score of information and shared decision making, and that a higher educational level is associated with more patient-centered scoring.23 Patients have also explained their preferences for physicians and nurses who demonstrate aspects of caring, time, and hope.24 But in this study, respondents did not prefer moderate physician and nursing communication. This may indicate that respondents expected good communication and were not tolerant of moderate communication from physicians and nurses.
Full and partial drug availability in the hospital were also highly preferred by respondents in the current study. This is in line with Hanson et al’s study,2 which showed that the availability of medicines in the hospital is a predominant factor in hospital choice. This finding also suggests the highest MRSs, indicating that patients want consistent drug availability in the hospital. This is probably because lack of drugs in a hospital would force patients to purchase them outside of a hospital. This has more negative implications for time to search for the drugs, and regulation of quality and price of drugs in the private sector is not common,25 hence drugs are expensive in such sectors. This has, specifically, a cumbersome effect in developing countries,26 and our results also suggest consistent drug availability in the hospital can be a policy measure.
Continuity of care in the hospital was also one of the important attributes in hospital choice. This was the most valued attribute of care even in an other study of health care preference.27 Respondents’ MRSs in terms of willing to wait were moderately longer than for other attributes. Turner et al28 also showed that when patients needed a routine checkup or had a problem causing uncertainty or a serious health problem, patients preferred to be seen by the health care provider who is already familiar with their health problem. This was also indicated by other studies in which self-reported continuity of care was strongly preferred by patients and hence was associated with higher patient satisfaction.21,29
Respondents preferred a lot of diagnostic facilities, but did not prefer only some diagnostic facilities in the hospital. This may be due to the option that respondents would necessarily prefer, as they would expect, a more thorough examination in a visit to a hospital with a lot of diagnostic facilities and may be willing to pay more for this.
The results of interaction terms showed that preferences differed with sex, occupation, and type of hospital. A hospital with good nursing communication and partial drug availability in the hospital was preferred by farmers. Participants with no jobs preferred a hospital with partial drug availability. This may be due to jobless respondents having low expectations of drug availability in the hospital or there being too much variation in preferences of this attribute. Those respondents who were from referral hospitals preferred a hospital that has continuity of care. This may be due to respondents from a referral hospital being associated with a serious acute illness and/or chronic diseases, and hence they are in need of continuity of care for better health outcomes.
A lot of diagnostic facilities had a relatively large impact on patients’ valuation of health care, although full drug availability, presence of continuity of care, and good nursing communication had relatively moderate impacts on patients’ preferences and considered as relatively important attributes with a moderate impact.
There are some limitations to this study. As the experiment was done in choices made by patients in hypothetical settings instead of real-life situations, it was likely prone to hypothetical bias, but we tried to minimize the hypothetical bias by informing respondents about the importance of the study despite the hypothetical nature of the experiment and using attribute levels which is relatively certain and short for the respondents.
Another limitation is that a “neither” option was not included in the choice questionnaire. Therefore, respondents who could potentially choose the “neither” option were not included in the analysis; hence the results may not explain some of the respondents’ behavior. In addition, some attributes of health care could be considered essential core features of health care and not optional extras. For example, it is hard for decision makers to trade off diagnostic facilities against medication supply.
Conclusion
The current study used a DCE to examine patient preferences for attributes related to public hospital health care services and relative attribute impacts on patients’ preferences. Changes to the diagnostic facilities of a hospital are likely to have the greatest impact on patients’ preferences for hospital health care. Patients had the following decreasing order of attribute impact on preference: a lot of diagnostic facilities, full drug availability, continuity of care, good nursing communication, partial drug availability, good physician communication, and waiting time for consultation. Results from this study should, however, be considered by decision makers, to identify important features of hospital health care that are essential to patients and contribute to the understanding of preference, hence are important to enhancing patient satisfaction and compliance with treatment. Attributes that were statistically significant provide evidence that decision makers have a variety of measures available that could improve hospital quality. Stakeholders should be aware of the differences in preferences among individual patients and aim to address hospital quality with the purpose of strengthening health care practice and to maximize patient satisfaction.
Future research on the preferences for health care in a specific hospital’s department/ward may be important to elicit disease-specific preferences for hospital health care. In addition, future research should also include other attributes such as cost that could have an impact on preferences.
Acknowledgments
We would like to thank all the interviewers and respondents who participated in this survey. Our acknowledgment also goes to Dr Amarech Guda for her technical support in DCE analysis and Prof Elizabeth Bradley for her valuable contributions to this study. We also gratefully acknowledge Addis Ababa University for providing financial support.
Disclosure
The authors report no conflicts of interest in this work.
References
Jouyani Y, Bahrampour M, Barouni M, Dehnavieh R. Patient preferences for hospital quality: case study of iran. Iran Red Crescent Med J. 2013;15(9):804–808. | ||
Hanson K, McPake B, Nakamba P, Archard L. Preferences for hospital quality in Zambia: results from a discrete choice experiment. Health Econ. 2005;14(7):687–701. | ||
Facey K, Boivin A, Gracia J, et al. Patients’ perspectives in health technology assessment: a route to robust evidence and fair deliberation. Int J Technol Assess Health Care. 2010;(26):334–340. | ||
Bridges JF, Jones C. Patient-based health technology assessment: a vision of the future. Int J Technol Assess Health Care. 2007;23:30–35. | ||
Marshall DA, Johnson FR, Kulin NA, et al. How do physician assessments of patient preferences for colorectal cancer screening tests differ from actual preferences? A comparison in Canada and the United States using a stated-choice survey. Health Econ. 2009;18:1420–1439. | ||
Gibson JL, Martin DM, Singer PA. Setting priorities in health care organizations: criteria, processes, and parameters of success. BMC Health Serv Res. 2004;4:25. | ||
de Bekker-Grob EW, Ryan M, Gerard K. Discrete choice experiments in health economics: a review of the literature. Health Econ. 2012;21:145–172. | ||
Hiligsmann M, Dellaert BG, Dirksen CD, et al. Patients’ preferences for osteoporosis drug treatment: a discrete-choice experiment. Arthritis Res Ther. 2014;16:R36. | ||
Lancaster KJ. A new approach to consumer theory. J Polit Econ. 1966;74(2):132–157. | ||
Ryan M. Using conjoint analysis to take account of patient preferences and go beyond health outcomes: an application to in vitro fertilisation. Soc Sci Med. 1999;48(4):535–546. | ||
Hoyos D. The state of the art of environmental valuation with discrete choice experiments. Ecol Econ. 2010;69(8):1595–1603. | ||
Lancsar E, Louviere J. Conducting discrete choice experiments to inform health care decision making: a user’s guide. Pharmacoeconomics. 2008;26(8):661–677. | ||
Alizadeh A, Eftekhaari TE, Mousavi SH, et al. Patient preferences for hospital quality in Bandar Abbas using a discrete choice experiment: 2010–2011. Life Science Journal. 2012;9(4):1882–1886. | ||
Reed Johnson F, Lancsar E, Marshall D, et al. Constructing experimental designs for discrete-choice experiments: report of the ISPOR Conjoint Analysis Experimental Design Good Research Practices Task Force. Value Health. 2013;16:3–13. | ||
Seghieri C, Mengoni A, Nuti S. Applying discrete choice modelling in a priority setting: an investigation of public preferences for primary care models. Eur J Health Econ. 2014;15:773–785. | ||
Vienna University of Economics and Business. Conjoint and Discrete Choice Experiments Available from: https://www.google.com/url?sa=t&rct=j&q=&esrc=s&source=web&cd=4&cad=rja&uact=8&ved=0CDoQFjADahUKEwiqp_OO9tLHAhWHn3IKHYjMAYs&url=http%3A%2F%2Fstatmath.wu.ac.at%2Fpeople%2Ftislam%2FVienna%2520presentations%2Fweek%2520of%2520July%25203%2FConjoint%2520and%2520Discrete%2520Choice%2520Analysis.ppt&ei=7hLkVar4Eoe_ygOImYfYCA&usg=AFQjCNGGu2078CePfWRNU5ygXAqe6lkpUA. Accessed October 11, 2013. | ||
Propper C. The disutility of time spent on the United Kingdom’s National Health Service waiting lists. J Hum Resour. 1995;30(4):677–700. | ||
Scott A. Eliciting GPs’ preferences for pecuniary and non-pecuniary job characteristics. J Health Econ. 2001;20:329–347. | ||
Lancsar E, Louviere J, Flynn T. Several methods to investigate relative attribute impact in stated preference experiments. Soc Sci Med. 2007;64:1738–1753. | ||
Zolnierek KB, Dimatteo MR. Physician communication and patient adherence to treatment: a meta-analysis. Med Care. 2009;47:826–834. | ||
King A, Hoppe RB. “Best practice” for patient-centered communication: a narrative review. J Grad Med Educ. 2013;5:385–393. | ||
Hölzel LP, Kriston L, Härter M. Patient preference for involvement, experienced involvement, decisional conflict, and satisfaction with physician: a structural equation model test. BMC Health Serv Res. 2013;13:231. | ||
Lau SR, Christensen ST, Andreasen JT. Patients’ preferences for patient-centered communication: a survey from an outpatient department in rural Sierra Leone. Patient Educ Couns. 2013;93:312–318. | ||
Martins RG, Carvalho IP. Breaking bad news: patients’ preferences and health locus of control. Patient Educ Couns. 2013;92:67–73. | ||
Carasso BS, Lagarde M, Tesfaye A, Palmer N. Availability of essential medicines in Ethiopia: an efficiency-equity trade-off? Trop Med Int Health. 2009;14(11):1394–1400. | ||
Suh GH. High medicine prices and poor affordability. Curr Opin Psychiatry. 2011;24(4):341–345. | ||
Cheraghi-Sohi S, Hole AR, Mead N, et al. What patients want from primary care consultations: a discrete choice experiment to identify patients’ priorities. Ann Fam Med. 2008;6(2):107–115. | ||
Turner D, Tarrant C, Windridge K, et al. Do patients value continuity of care in general practice? An investigation using stated preference discrete choice experiments. J Health Serv Res Policy. 2007;12(3):132–137. | ||
Fan VS, Burman M, McDonell MB, Fihn SD. Continuity of care and other determinants of patient satisfaction with primary care. J Gen Intern Med. 2005;20(3):226–233. |
 © 2015 The Author(s). This work is published and licensed by Dove Medical Press Limited. The
full terms of this license are available at https://www.dovepress.com/terms
and incorporate the Creative Commons Attribution
- Non Commercial (unported, 3.0) License.
By accessing the work you hereby accept the Terms. Non-commercial uses of the work are permitted
without any further permission from Dove Medical Press Limited, provided the work is properly
attributed. For permission for commercial use of this work, please see paragraphs 4.2 and 5 of our Terms.
© 2015 The Author(s). This work is published and licensed by Dove Medical Press Limited. The
full terms of this license are available at https://www.dovepress.com/terms
and incorporate the Creative Commons Attribution
- Non Commercial (unported, 3.0) License.
By accessing the work you hereby accept the Terms. Non-commercial uses of the work are permitted
without any further permission from Dove Medical Press Limited, provided the work is properly
attributed. For permission for commercial use of this work, please see paragraphs 4.2 and 5 of our Terms.