Back to Journals » Patient Preference and Adherence » Volume 13
Patient experiences with interdisciplinary treatment for substance dependence: an assessment of quality indicators based on two national surveys in Norway
Authors Haugum M ![]() , Iversen HH
, Iversen HH ![]() , Helgeland J
, Helgeland J ![]() , Lindahl AK, Bjertnaes O
, Lindahl AK, Bjertnaes O ![]()
Received 16 November 2018
Accepted for publication 12 March 2019
Published 5 April 2019 Volume 2019:13 Pages 453—464
DOI https://doi.org/10.2147/PPA.S194925
Checked for plagiarism Yes
Review by Single anonymous peer review
Peer reviewer comments 2
Editor who approved publication: Dr Johnny Chen
Mona Haugum,1,2 Hilde Hestad Iversen,1 Jon Helgeland,1 Anne Karin Lindahl,2,3 Oyvind Bjertnaes1
1Division of Health Services, Norwegian Institute of Public Health, Oslo, Norway; 2Department of Health Management and Health Economics, Institute of Health and Society, Faculty of Medicine, University of Oslo, Oslo, Norway; 3Division of Surgery, Akershus University Hospital, Lorenskog, Norway
Purpose: The quality of health care is often measured using quality indicators, which can be utilized to compare the performance of health-care providers. Conducting comparisons in a meaningful and fair way requires the quality indicators to be adjusted for patient characteristics and other individual-level factors. The aims of the study were to develop and test a case-mix adjustment model for quality indicators based on patient-experience surveys among inpatients receiving interdisciplinary treatment for substance dependence, and to establish whether the quality indicators discriminate between health care providers.
Patients and methods: Data were collected through two national surveys involving inpatients receiving residential treatment in Norway in 2013 and 2014. The same questionnaire was used in both surveys, and comprised three patient-experience scales. The scales are reported as national quality indicators, and associations between the scales and patient characteristics were tested through multilevel modeling to establish a case-mix model. The intraclass correlation coefficient was computed to assess the amount of variation at the hospital-trust level.
Results: The intraclass correlation coefficient for the patient-reported experience scales varied from 2.3% for “treatment and personnel” to 8.1% for “milieu”. Multivariate multilevel regression analyses showed that alcohol reported as the most frequently used substance, gender and age were significantly associated with two of the three scales. The length of stay at the institution, pressure to be admitted for treatment, and self-perceived health were significantly related to all three scales. Explained variance at the individual level was approximately 7% for all three scales.
Conclusion: This study identified several important case-mix variables for the patient-based quality indicators and systematic variations at the hospital-trust level. Future research should assess the association between patient-based quality indicators and other quality indicators, and the predictive validity of patient-experience indicators based on on-site measurements.
Keywords: quality of health care, health care quality indicator, case-mix adjustment, patient satisfaction, survey
Introduction
The systematic measurement and reporting of quality indicators in health care have become common in several countries during the last few decades.1,2 The reasons for the increased focus on health care performance are often linked, and include both the increasing expense and the variations in the quality of health care.3 Patient-reported experiences (also called user experiences) constitute parts of the frameworks for quality indicator projects for the Nordic Council, the OECD, and the WHO.2,4,5 The quality indicators used in Norway are meant to reflect aspects of the quality of health care, as a means to inform policy-makers, health care leaders, health personnel, and patients about health care performance.6 The Norwegian quality indicator system consists of several indicators of the quality of health care within different areas, using both patient administrative data and patient-reported experiences.7
Patient-experience surveys elicit a view of the quality of health care that cannot be provided by other clinical or administrative assessments. When measuring patient experiences on a national or other large scale, it is useful to be able to compare between health care providers or hospital trusts. While such comparisons may be informative when choosing a provider or allocating resources, patient characteristics not related to the quality of health care may influence how certain patient groups evaluate this quality. This makes it necessary to develop and apply appropriate case-mix adjustments to ensure that such comparisons are valid.8–10 In addition, different patient groups have different probabilities of responding to the surveys, which results in some groups being underrepresented in the resulting sample. A common approach to compensate for nonresponse is to weight data to reduce bias related to certain groups being underrepresented.11 Weighted results are meant be more representative for the complete patient population; that is, not only to those who actually replied to the survey. The aim of making case-mix adjustments is to increase the accuracy of the results when comparing different health care providers.10
There is no apparent consensus on how to develop or use quality indicators, with the approach often being determined by the objective of performing particular measurements.6 However, one step-by-step guide provided by the Agency for Healthcare Research and Quality suggests that the performance of such quality indicators should be judged according to: face validity, precision, minimum bias, construct validity, fostering real quality improvement, and application,12 each of these factors being related to data quality, validity, reliability, applicability, and feasibility.6
In 2013, the Norwegian Directorate of Health commissioned a national patient-experience survey involving inpatients receiving interdisciplinary treatment for substance dependence.13 In Norway, the regional hospital trusts are decreed by law to offer interdisciplinary treatment for substance dependence. This is a service for patients with substance dependence that include both medical, psychological and social work professionals, and the treatment focuses on both patients’ health problems and social situations. The service includes residential, day, policlinic and ambulatory services.14 In the agreement between that directorate and the Norwegian Institute of Public Health (NIPH), the directorate underlined that it wanted to test the possibility of developing quality indicators based on the national survey. The NIPH is responsible for conducting national patient-experience surveys, and has a long history of conducting national surveys and reporting corresponding quality indicators based on patient experiences. However, after testing the data material from this population as quality indicators, the NIPH concluded that the number of respondents at each institution was too small for reporting proper indicators. It was therefore decided to expand the sample with another national survey of the same population, which was conducted 1 year later.15
The NIPH usually samples 400 respondents from each participating unit (eg, hospital) when measuring the experiences that patients have with health care. However, the institutions offering interdisciplinary treatment for substance dependence in Norway are substantially smaller than this, which necessitated some adjustments to the usual methods employed when conducting patient-experience surveys and reporting the results from these surveys. There is a growing body of literature when it comes to assessing patient experiences and patient reported outcomes with different types of treatment for substance dependence. Some of these efforts focus on developing and validating relevant tools.16–23 Within the literature, some evidence can be found regarding patient characteristics that should be considered for case-mix adjustments.24–26 However, several of these studies are conducted in more narrow populations than the Norwegian one, which are including all patients treated for substance dependence, hence suggesting that a more-explorative approach was needed in the current setting.
The aim of this study was to establish whether the experiences of inpatients can be used as a basis for national quality indicators of interdisciplinary treatment for substance dependence. The objective was twofold: (i) to use the data material from the national surveys to develop a feasible case-mix adjustment model, and (ii) to establish whether the quality indicator scores vary across health care providers, hence testing the ability of the indicators to discriminate between levels of patient-reported quality.
Material and methods
Sample and data collection
All public and private residential institutions with a contract with regional health authorities were included in the national surveys. The included institutions represented a range of treatments, dependencies, programs, number of patients and length of stay, while detoxifications institutions were excluded. The surveys were conducted as national measurements, and it was mandatory for the institutions to participate. The NIPH established contact with each of the institutions through the four regional health authorities, which provided contact information to their underlying hospital trusts, which again provided information on the leaders at all the institutions working with interdisciplinary treatment for substance dependence. The NIPH could from there establish contact with health personnel at each institution, and together with them plan and conduct the surveys. All patients staying at the institutions, aged 16 years and older, were invited to participate. Individual patients could be excluded based on ethical considerations by personnel at each institution.
In 2013, 1,245 patients were staying at the residential institutions during the data collection. Twelve of the patients were excluded due to ethical considerations, while 163 patients were not available for participation (due to, eg, doctor’s visit, leave from the institution). Hence, 1,070 inpatients from 98 institutions were eligible for inclusion in 2013. In 2014, 23 patients of 1,279 were excluded due to ethical considerations, while 143 patients were not available, leaving 1,113 patients eligible for participation.
The data were collected using a cross-sectional design on a single day decided by the institutions during a single designated week decided by the NIPH. The health personnel at each institution were responsible for handing out and collecting the answered questionnaires, making this an on-site survey. The questionnaires were distributed to the institutions in prepacked envelopes containing an information sheet, the questionnaire, and a return envelope before the day of data collection. The health personnel was instructed to give one envelope to each consenting patient. Patients were informed that participation was voluntary, and that no one would know their answers to the questions. Pre-established practice with treating a filled-out and returned questionnaire as consent to participate was employed. The surveys were conducted anonymously, and carried out as a quality assurance project. No demographic information other than the background items in the questionnaire was collected. The participating institutions did not provide information to the NIPH about their respondents, other than the number of eligible patients and the reasons for ineligibility. One of the consequences of this procedure is a lack of information regarding nonrespondents.
Measures
The questionnaire used in the survey was the Patient Experiences Questionnaire for Interdisciplinary Treatment for Substance Dependence (PEQ-ITSD), which consists of 51 closed-ended questions. The data quality, validity, and reliability of the PEQ-ITSD have been comprehensively described, tested, and reported on previously.17 Most of the questionnaire items are scored on a 5-point scale, ranging from “not at all” to “to a very large extent.” The questionnaire-scale was linearly converted to a scale from 0 to 100, where a higher score indicated a better outcome. To obtain a scale score, a respondent had to answer at least half of the questions constituting each scale.
Identical versions of the questionnaire were used in the surveys performed in 2013 and 2014. The questionnaire comprises three scales: “treatment and personnel,” “milieu,” and “outcome”, which were derived from exploratory factor analyses, and has shown good internal consistency reliability, test–retest reliability and construct validity. The variation in the three scale scores and the regression models’ variance constitute the main outcomes in the following analyses. The “treatment and personnel” scale consists of 12 items concerning topics such as the relationships of patients to personnel, their access to personnel, and patient centeredness. The “milieu” scale consists of five items relating to the safety experienced by patients at the institution, how they were received when they arrived, and their opinion of the meals quality. The “outcome” scale also consists of five items, which asks the patients whether they consider that the time spent at the institution has helped them as it should and has prepared them adequately for their life after discharge.
The demographic variables collected through the respondents’ replies to the questionnaire, ie, the variables tested as relevant case-mix adjustors, were: gender, marital status, education, self-perceived physical and mental health, most frequently used drug or substance prior to this admission, length of stay at this institution, number of previous admissions, age, and age when they developed the substance dependence. In addition to the mentioned variables, a new variable, mixed use, was computed. This variable corresponds to the number of substances that each respondent reported using most frequently before admission, with a possible value from 1 to 6. This variable acted as a proxy for the severity of dependence.
Given the smallness of the sample at each institution, the scales were inspected at several levels of health care. The participating institutions could be grouped into hospital trusts or private organizations as well as in regional hospital trusts. Grouping the institutions in this way allowed us to assess the standard error of the scale scores, and thereby determine the health care level at which the statistical uncertainty was too large. We used the criterion employed in other national patient-experience surveys performed in Norway, which is to compute scale scores only where the standard error is lower than 6. This criterion leads to that the hospital trust level was chosen to represent the provider level in this study, meaning public hospital trusts or private organizations with more than one underlying unit (institution).
Results of national surveys reported by the NIPH are usually weighted to address nonresponse. However, the present survey did not include this information. The results were weighted based on self-reported length of stay at the institution in order to compensate for the larger probability of being sampled when having stayed longer at the institution.
Analysis
Due to the nested nature of the data (ie, the respondents were nested within the hospital trusts), and violation of the prerequisite that the data are statistically independent, multilevel modeling was used in all regression analyses.27 For multilevel modeling to be necessary, it is often stated that the ICC should be larger than 0.01,28 and that the design effect should be larger than 2.29 In line with these recommendations, we calculated both the ICC and design effect.
Associations between independent variables and the scales were assessed with a merged data set containing data from 2013 to 2014. The analyses only included institutions that had respondents from both survey years. The tested variables and the resulting model were based on (i) the scientific literature, (ii) the effect of background variables on the scales, (iii) the distribution of the background variables across the institutions, and (iv) suggestions from external experts that we sought advice from.
The multilevel analyses assessed the amount of variation at the hospital-trust level. In the null model, the hospital trusts were entered as random intercepts. This model was used to calculate the proportion of the variance explained at the hospital-trust level based on the ICC. The design effect was calculated based on the mean number of responses across the hospital trusts and the ICC for each of the scales. The full model included hospital trusts as random intercepts and all patient variables that were statistically significant on a 0.05-level with at least one of the scales in bivariate models as fixed effects. Mixed use and survey year were entered into the multivariate model regardless of results from the bivariate analyses. The variance explained by the full model was calculated as described by Snijders and Bosker.27 Based on findings from the multilevel analysis, we calculated adjusted scores for all hospital trusts on the three scales. Variables that were statistically significant on a 0.05-level on at least two of the scales in the multivariate analysis were included in the case-mix model.
The statistical analyses were conducted using SPSS (version 24.0; SPSS Inc., Chicago, IL, USA) and R software.30
Results
In total, 978 inpatients in 2013 and 1,017 inpatients in 2014 responded to the national survey, giving a total merged data set of 1,995 respondents. The response rate for both years was 91%. The analyses were applied to 1,452 respondents from 21 hospital trusts, whose sample sizes ranged from 25 to 154. Table 1 shows that the mean age in the merged sample at the hospital-trust level was 36 years, and 69% of the respondents were male. Most (82%) of the respondents reported being single and 89% had finished primary school. The mean age when the respondents had developed substance dependence was 20 years, and the most frequently used substances prior to the current admission were alcohol, cocaine/amphetamine and cannabis, closely followed by medication. Sixty-four percent of the respondents reported their physical health to be good, very good or excellent, with 56% reporting this for the question about mental health. About half of the respondents had been at the institution for <3 months, and 68% had one or more previous admissions to a residential institution.
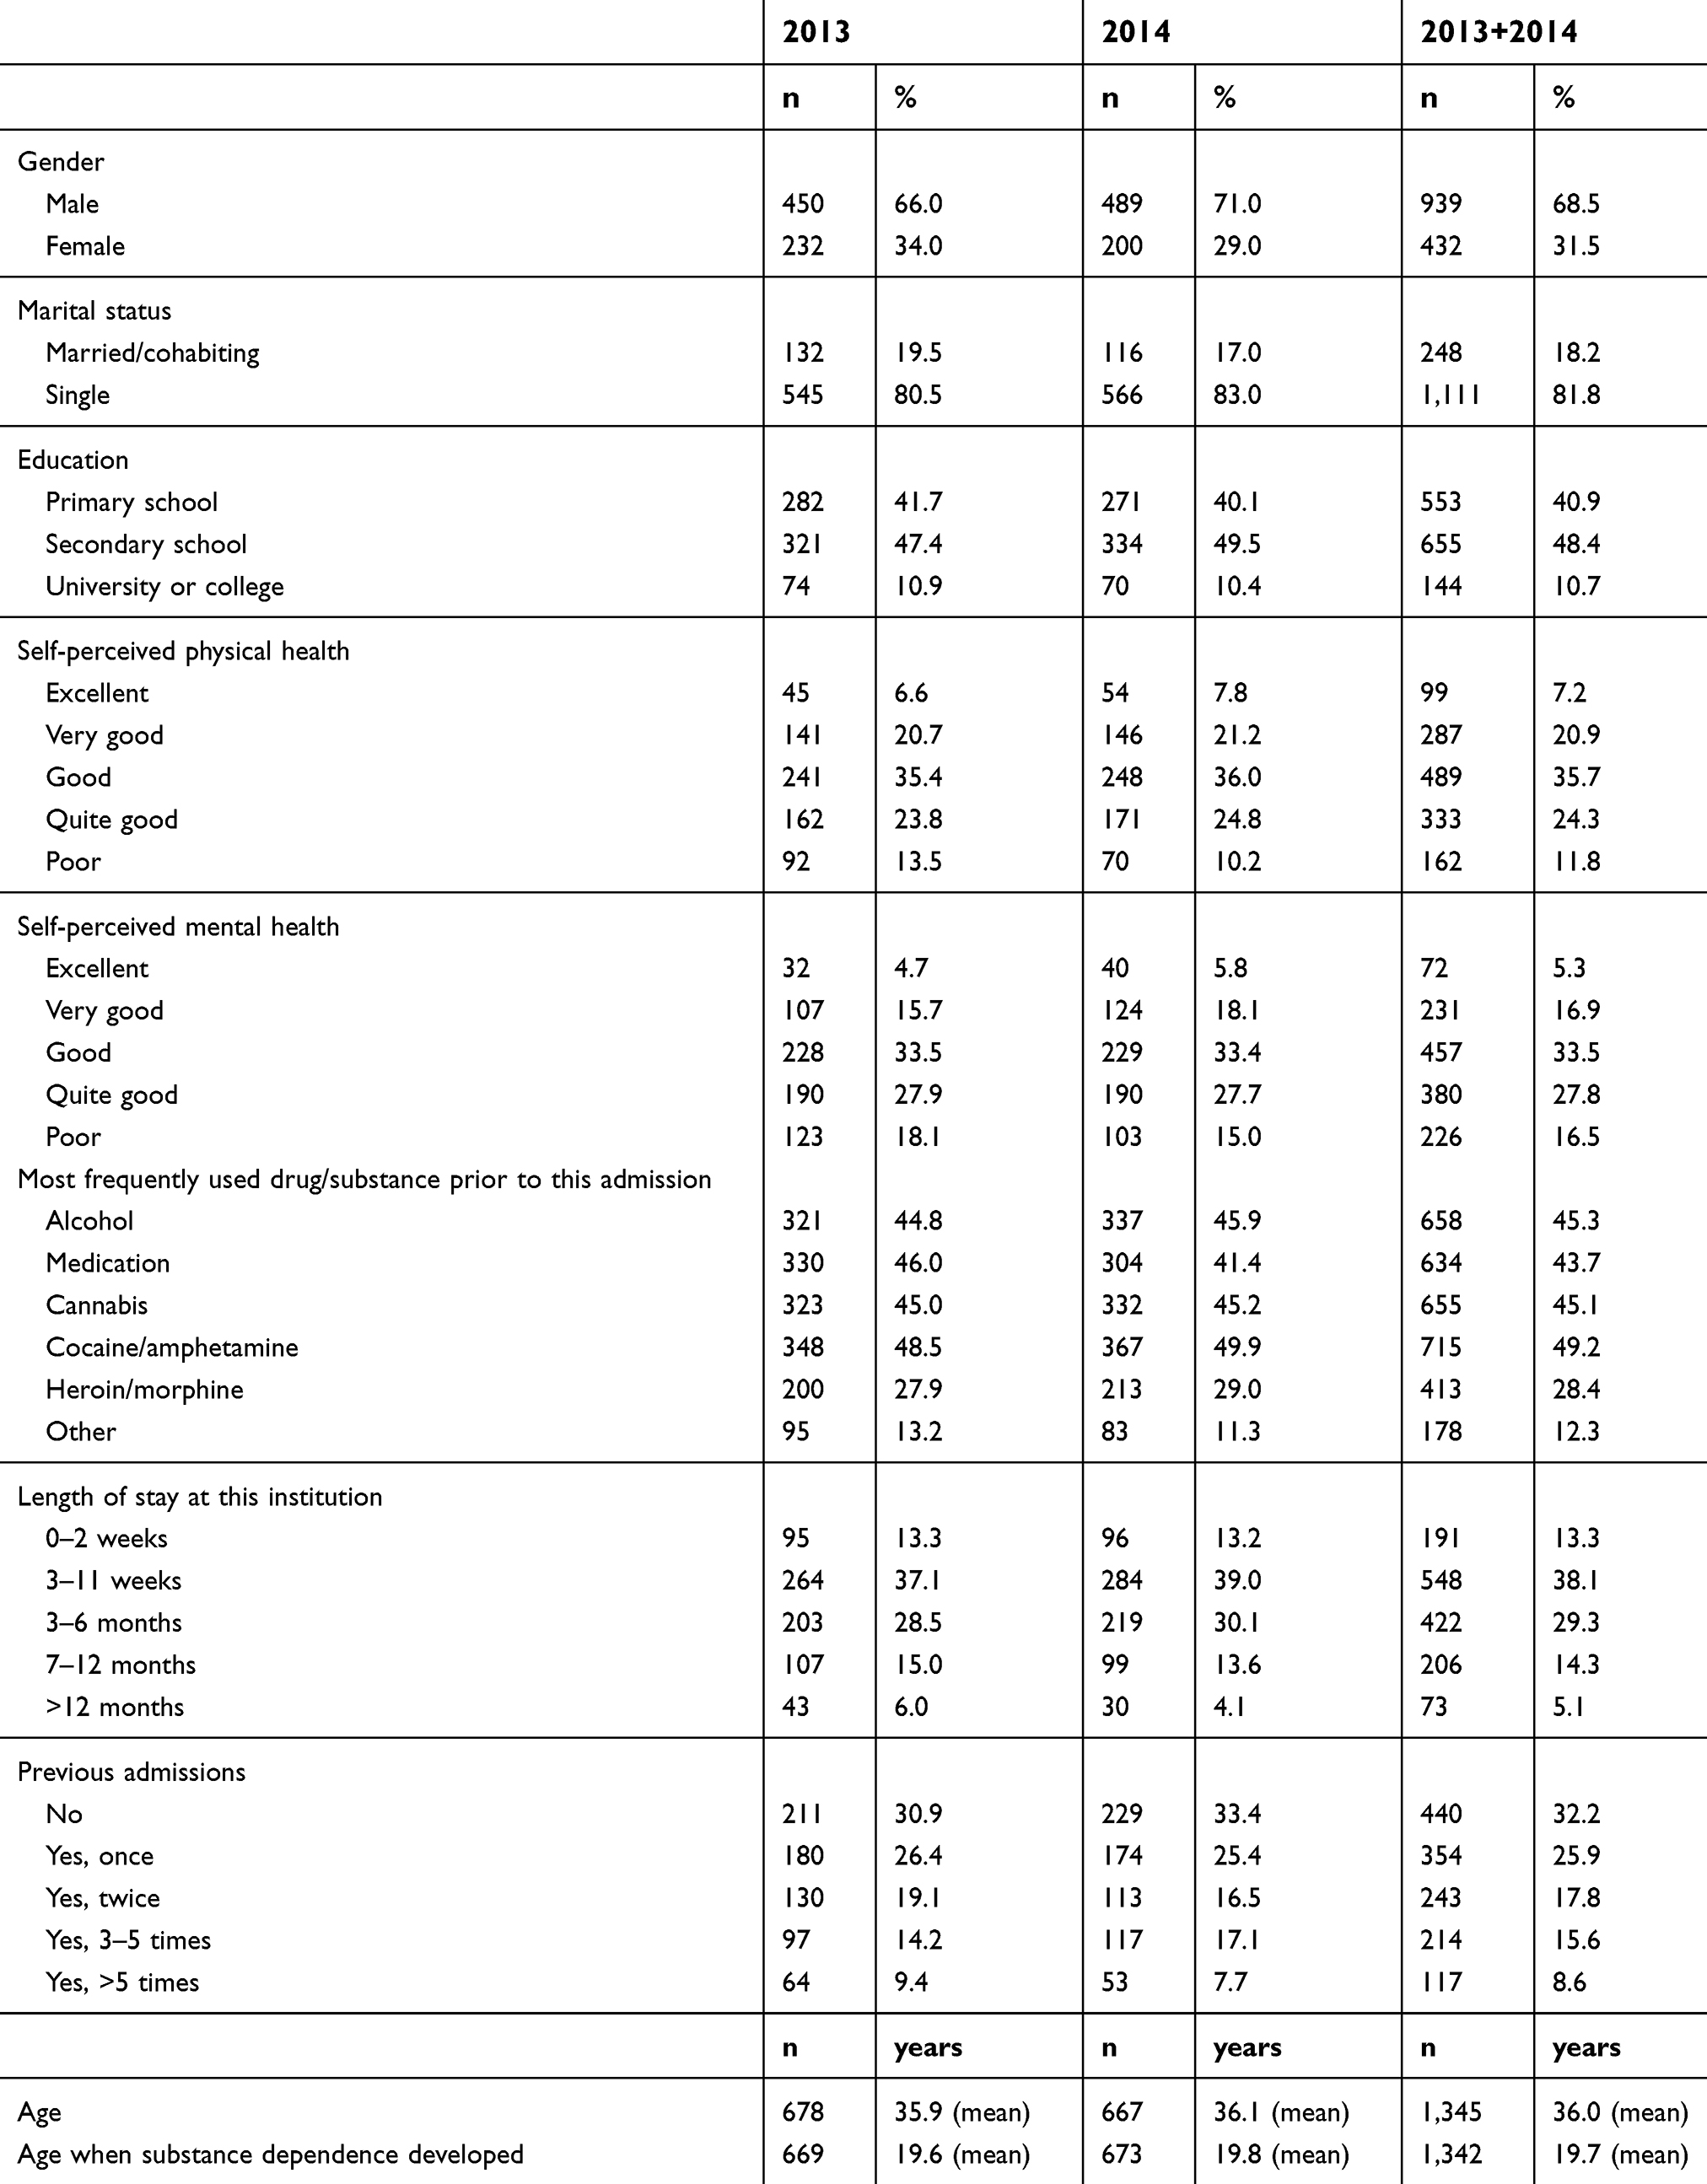 | Table 1 Sample descriptives at the hospital trust level in 2013, 2014, and both years combined |
The multilevel bivariate regression models showed that all but five variables of 16 had a significant association with at least one of the scales (results not shown). The five variables were (i) heroin/morphine as the most frequently used drug prior to admission, (ii) other as the most frequently used drug prior to admission, (iii) mixed use, (iv) marital status, and (v) education. All of the other background variables were associated with at least one of the scales at the 0.05 level. Table 2 shows the multilevel multivariate regression model and that patients reporting alcohol as their most frequently used substance before admission had significantly better experiences on the “treatment and personnel” and ”outcome” scales when other factors were controlled for. Respondents with longer stays at the institutions reported better experiences with “treatment and personnel” and “outcome,” but worse experiences on the “milieu” scale. Being pressured or forced by others to be admitted for treatment had a negative impact on all three scales. Females had significantly better experiences than males regarding “treatment and personnel” and “outcome,” while older patients reported better experiences on the “treatment and personnel” and “milieu” scales. Patients reporting worse health (both physical and mental) reported worse experiences on all three scales.
 | Table 2 Results from multilevel regression models of the associations between independent variables and scale scores |
Table 3 shows that the ICC varied from 2.3% for “treatment and personnel” to 8.1% for “milieu”, which indicate meaningful variance in the scale scores at the hospital-trust level, and the need for multilevel modeling. The design effect was larger than 2 for all three scales. The proportion of the explained variance in the full model was 7.62% for “treatment and personnel,” 6.97% for “milieu,” and 7.72% for “outcome.”
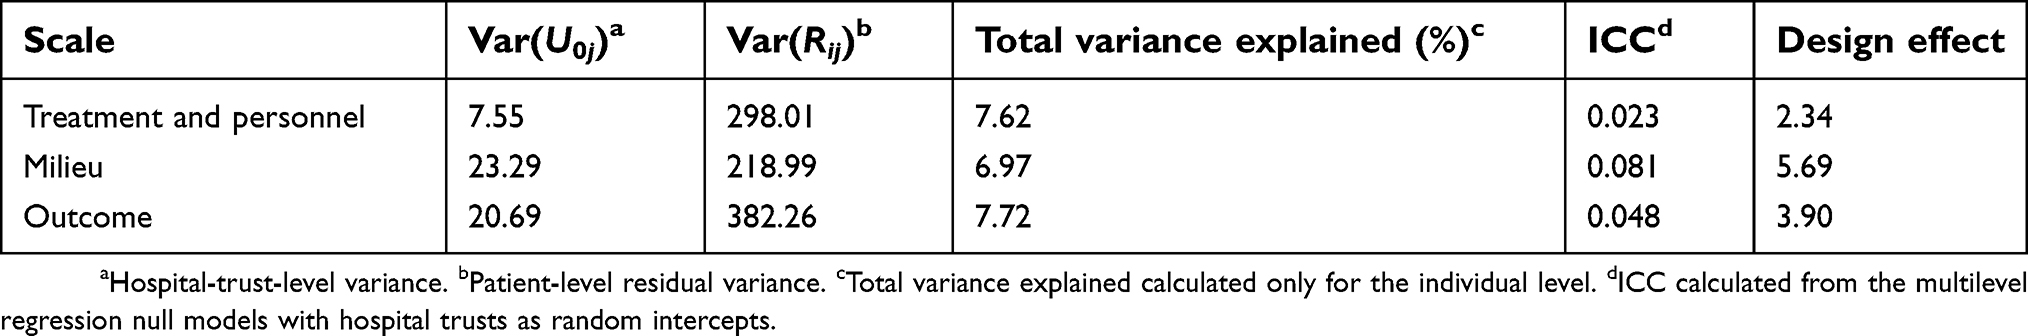 | Table 3 Summary statistics on model variance |
Figure 1 displays the variation in results from the 21 participating hospital trusts, comprising hospital trusts or private organization with underlying departments/institutions. Each line represents one scale, while the results for each hospital trust appearing as points on the lines in the same order for all three scale scores. The scale scores for “treatment and personnel” varied from 54 to 66, while those for “milieu” varied from 62 to 87 and, those for “outcome” varied from 59 to 77. The mean national scale scores for the merged material were 61 for “treatment and personnel,” 75 for “milieu,” and 68 for “outcome.” One hospital trust obtained a score that was significantly lower than the national mean for “treatment and personnel” (P<0.01). For “milieu,” four hospital trusts scored lower than the national mean (P<0.01 to P<0.001) and two had higher scores (P<0.05 to P<0.001). Four hospital trusts varied significantly from the national mean for “outcome,” with two in each direction (P<0.05 to P<0.001).
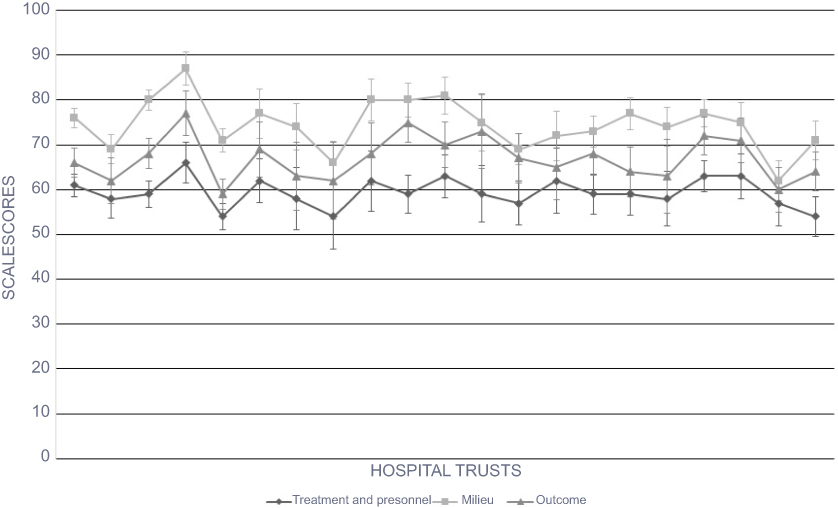 | Figure 1 Variations in mean scale scores with 95% confidence intervals across hospital trusts.a Note: aSomewhat fewer respondents compared to other results due to the R analyses eliminating cases with missing data on one or more variables in the case-mix adjustment model. |
Discussion
This study explored the effects of patient characteristics on different aspects of the experiences of patients receiving residential treatment for substance dependence, with the aim of developing a feasible case-mix model to enable fairer comparisons between health care providers. The results showed that there is a need to adjust for several of the available variables, such as length of stay at the institution, pressure from others to be admitted for treatment, and self-perceived physical and mental health. Furthermore, alcohol reported as the most frequently used substance, being female, and increasing age were positively associated with two of the three scales. The results also showed that the indicators can be used to discriminate between health care providers.
The multilevel models showed that the scale scores should be adjusted for self-perceived physical and mental health. For both the “treatment and personnel” and “milieu” scales, comprising items related to aspects related to the residential institution only, self-perceived health should function well as a case-mix variable. However, for the “outcome” scale, which measures the experiences of patients with aspects related to the treatment results, self-perceived health was omitted from the case-mix adjustment, even though the two variables were significantly associated with the scale. The reason for omitting self-perceived health is that both of these variables can be viewed as outcome variables, since the health of the patients might be expected to change due to them receiving treatment at the institutions.
In addition to the previously mentioned variables, the full case-mix model also included the computed variable of mixed use. Professionals in the field of substance-dependence treatment were approached for advice on the variables they thought should be included in the testing—their suggestions were age, marital status, gender, and mixed use. Mixed use was not significantly associated with any of the three scales, but the variable was kept in the model to compensate for the “outcome” scale not being adjusted for self-perceived health, and also functioning as a proxy for severity.
Age and self-perceived health have been found to be significantly associated with patient experiences and/or satisfaction in several populations, with patients who rate their health more positively and/or are older reporting satisfaction or better experiences.31–33 This is consistent with the findings of the present study. Other variables that have been demonstrated (although more inconsistently) to be associated with the experiences of patients include education, marital status, income, and gender,31–33 but only gender was found to be significantly associated with the scale scores in the current study.
In line with the above-mentioned findings in other populations as well as those in the current study, a study conducted in the USA found that both self-perceived physical health and mental health were the strongest predictors of survey scores for patients receiving behavioral health care, such as treatment for mental illness or treatment for alcohol or drug use.9 Other variables reported as significant were education, age, and race/ethnicity, along with whether or not the patients were treated for alcohol or drug use. Education was not significantly associated with the scale scores in the current study; however, in the Norwegian sample, few respondents reported having a university- or college-level education, and the potential effect of differences in education level could be weaker. The PEQ-ITSD currently does not include questions on race or ethnicity, so these variables were not tested in the current study.
The length of stay at the institution was significantly associated with all of the scale scores: a longer stay was associated with more-positive evaluations on both the “treatment and personnel” and “outcome” scales, but with more negative evaluations on the “milieu” scale. This might be due to patients who have stayed in an institution for a longer time becoming more familiar with the personnel and the institution as a whole, forming relationships and trust, and being able to experience some benefits from their treatment that patients with shorter stays have not yet experienced. However, patients with longer stays may also become more tired of the institution and other patients, hence affecting the “milieu” score negatively. Another possible explanation is that patients who generally are more positive and have better experiences and outcomes stay longer in treatment.
Even though length of stay has been demonstrated to be a predictor of the results in these surveys, its suitability as a case-mix adjustor has been discussed. Ideally, a case-mix adjustor should be specific to individual patients and also outside the control of health care providers.31 The length of stay can clearly be influenced by health care providers, and a shorter length of stay in hospitals has been shown to negatively affect the quality of health care.34 However, the point in our study is not to adjust for the actual length of stay for discharged patients, but to correct for the fact that institutions and hospital trusts at the time of measurement had different patient-mix concerning length of stay. The time of measurement (a single day in a specific week) was decided by the external research organization, and so was outside the control of the different health care providers. Thus, differences in the length of stay at the time of measurement might be considered a valid and important case-mix adjustor in our study.
To be pressured or forced by others to be admitted for treatment had a negative impact on the scores on all the scales. The question did not distinguish who applied the pressure/force and may, therefore, be given a high score by all patients regardless of the legal status on their admission (voluntary vs involuntary) or the reason for seeking treatment. Previous research has shown that patients receiving psychiatric residential treatment who report higher levels of coercion (both perceived and documented) either at admission or during treatment report lower satisfaction or worse experiences with treatment.35,36
The present results also indicated that respondents reporting alcohol as their previously most-used substance reported more positive experiences which therefore influenced the scores. Our external experts described this as a possible effect of age, in that people with alcohol dependence are generally older than people with other types of dependence. However, the current study identified each of alcohol dependence and age as predictors for scale scores when controlling for the other.
The data materials in national surveys are usually weighted to minimize the potential bias of nonresponses. As stated above, no information were collected concerning the background of patients or administrative information other than what the respondents replied in the questionnaire. This prevented the standard weighting procedure, where information on nonrespondents is compared to that on respondents in order to weight respondents to make them more representative of the total population. However, the high response rate of 91% strengthens the generalizability of the findings and reduces the need to implement weighting procedures based on responses.
The surveys were conducted as cross-sectional studies, and the results are therefore a description of the current status of the residential institutions. This means that some patients would have already been at the institutions for several weeks or even months, while others had arrived more recently. This way of recruiting patients and collecting data leads to a skewness in the possibility of being sampled to the surveys, since patients who have stayed for a longer time will have a higher probability of being sampled, and so those responding to the survey may have a longer stay on average. The data materials from these surveys are therefore weighted based on the length of stay, with patients with longer stays having smaller weights.
Implications
When measuring quality and reporting quality indicators based on patient experiences in similar populations as the one surveyed in this study, the following variables are suggested case-mix adjustors: alcohol as the most frequently used substance, length of stay, pressure from others to be admitted for treatment, gender, age, and self-perceived physical and mental health. We also recommend adjusting for mixed use. Given several measuring points, one should also consider adjusting for this. Case-mix adjustments based on these suggestions should be considered when comparing between health care providers and to enhance the clinical legitimacy. Information on nonrespondents should be considered collected as a means to weight the results for response, especially in studies where the response rate is relatively low.
One of the main objectives of case-mix adjustments is to ensure fairer comparisons between health care providers based on survey scores. This is achieved by predicting how health care providers would score or rate if the populations were more standardized.31 Case-mix adjustments usually have a relatively small impact;9 and the need for such adjustments has been discussed.38 However, some still argue that even small adjustments show that the appropriate measures have been taken to ensure valid comparisons, and to reduce the probability of health care providers attracting “easier” populations to improve their scores, such as patients who are older or in better health.9,38
Quality indicators are often reported based on patient administrative data and/or registries. However, patient experiences and satisfaction have become an acknowledged and important way to measure aspects of the quality of health care, including in treatment for substance dependence.37 The three scales tested in this study are the first quality indicators based on patient experiences reported nationally in Norway for this population, and they have been shown to effectively discriminate between health care providers, as indicated by the relatively large variations among the hospital trusts. In addition, it appears that the scale scores are somewhat correlated for each hospital (Figure 1). Furthermore, the scales can be used as quality indicators given their relevance to patients, and they have been demonstrated to be valid and reliable.17 The scales provide an important tool for use when measuring and discussing the quality of interdisciplinary treatment for substance dependence in Norway, and the current study has shown how the survey scores should be adjusted based on patient characteristics in order to ensure valid and fair comparisons between hospital trusts.
Limitations
One of the limitations of this study was that the only available case-mix variables were patient-reported responses to the questionnaire. It is probable that other patient characteristics can impact the experiences of inpatients, and therefore should have been included in the analyses. Although this limitation is quite common when attempting to measure quality,39 it is a topic that needs further exploration and which presupposes the availability of other background variables. Further developments of these measures in the given patient population should consider the availability of possibly important independent variables, such as patient administrative data and institution characteristics, eg, treatment programs or planned treatment duration.40
Another limitation was the lack of information on the health of respondents at admission. This made it impossible to know whether the self-reported health answered in the questionnaire had changed from admission and, if it had, in what direction. A possible solution is to include transition questions that either ask the respondents about their health status prior to admission, or ask them to compare their current health status with that prior to admission. Changes in health might be interpreted as an outcome in itself, but could also be used to validate the patient-reported experience scales, especially the outcome scale.
The cut-off for reporting quality indicator scores was set at the level of hospital trusts with more than one underlying unit, and with merged data from two identical surveys. The rationale for this approach was to ensure a sufficient number of respondents per unit. Since not all residential institutions in Norway are organized together under hospital trusts or are part of a larger private organization, some institutions do not receive results on the indicators and so were excluded from the present analyses. This means that even though they have a relatively large patient population, some institutions will not receive case-mix-adjusted indicator scores. A solution could be to merge even more data sets (covering more survey years), but the results from several years might be difficult to use and interpret, and was deemed unnecessary in the present study.
The present surveys were conducted as two cross-sectional surveys performed in consecutive years. The included patients might, therefore, have been at the institutions for very different durations, which is why the data were both weighted and adjusted for the length of stay. Another approach would have been to collect data at discharge. Such an approach has been discussed previously, and deemed a more-time-consuming method for data collection, since many institutions are small and their patient flows are therefore relatively low; in addition, it could mean losing patients that drop out of treatment.17 We are currently working on how to collect the experiences of patients at discharge in a fashion that is feasible for all involved. Furthermore, assessing the predictive validity of on-site patient-based indicators will be important for future research, preferably using a longitudinal design.
Conclusion
This study found that the three scales comprising the PEQ-ITSD function well as patient-experience-based quality indicators at the hospital-trust level, given that data from 2 years were merged and implementation of the proposed case-mix model. The variations in scale scores across health care providers show that the indicators can be used to discriminate between different providers, suggesting the possibility of improving scale scores through improvement work. Future research should assess the associations between patient-based quality indicators and other quality indicators, and the predictive validity of patient-experience indicators based on on-site measurements.
Ethics approval and informed consent
Data were collected anonymously, with no registration of the patients being surveyed. The project was run as part of the national program and was an anonymous quality assurance project. According to the Norwegian Regional Committees for Medical and Health Research Ethics, research approval is not required for quality assurance projects. The Norwegian Social Science Data Services states if the information used are anonymous, the project is not subject to notification (
Data availability
The datasets generated and analyzed during the current study are not publicly available due to this being one part of an ongoing PhD-project at the NIPH and the University of Oslo. Request for permission to use the data must be directed to the NIPH.
Acknowledgments
We thank Marit Seljevik Skarpaas for performing data collection and management, and Inger Opedal Paulsrud and Linda Selje Sunde for administrative help with the data collection. We also thank Olaf Holmboe for providing the case-mix adjusted indicator scores using R software. We are grateful to the contact persons and project-management professionals in the departments, institutions, and health regions concerned. We also thank the patients who participated in the surveys. The Norwegian Knowledge Centre for the Health Services (now part of the NIPH) was responsible for the planning and execution of the data collections that are described in this manuscript. The NIPH is responsible for the current study. The Norwegian Directorate of Health funded the national surveys.
Author contributions
All authors made substantial contributions to conception and design, acquisition of data, or analysis and interpretation of data; took part in drafting the article or revising it critically for important intellectual content; gave final approval of the version to be published; and agree to be accountable for all aspects of the work.
Disclosure
The authors report no conflicts of interest with this work.
References
1. Mainz J. Defining and classifying clinical indicators for quality improvement. Int J Qual Health Care. 2003;15(6):523–530. doi:10.1093/intqhc/mzg081
2. Arah OA, Westert GP, Hurst J, Klazinga NS. A conceptual framework for the OECD health care quality indicators project. Int J Qual Health Care. 2006;18(Suppl 1):5–13. doi:10.1093/intqhc/mzl024
3. Kelley E, Hurst J. Health care quality indicators project: conceptual framework paper. OECD Health Work Pap. 2006;23:1–36.
4.
5.
6. Rygh LH, Saunes IS. Utvikling og bruk av kvalitetsindikatorer for spesialisthelsetjenesten. Rapport nr. 6–2008. Nasjonalt kunnskapssenter for helsetjenesten, Oslo; 2008.
7.
8. Hendryx M. Conducting case-mix adjustment for mental health performance indicators. Cambridge, MA: Human Services Research Institute; 2004.
9. Eselius LL, Cleary PD, Zaslavsky AM, Huskamp HA, Busch SH. Case-mix adjustment of consumer reports about managed behavioral health care and health plans. Health Serv Res. 2008;43(6):2014–2032. doi:10.1111/j.1475-6773.2008.00878.x
10. Cleary PD, Meterko M, Wright SM, Zaslavsky AM. Are comparisons of patient experiences across hospitals fair? A study in veterans health administration hospitals. Med Care. 2014;52(7):619–625. doi:10.1097/MLR.0000000000000144
11. Groves RM, Fowler FJ
12.
13. Haugum M, Iversen HH, Bjertnæs ØA. Pasienterfaringer med døgnopphold innen tverrfaglig spesialisert rusbehandling – resultater etter en nasjonal undersøkelse i 2013. PasOpp-rapport nr. 7–2013. Nasjonalt kunnskapssenter for helsetjenesten, Oslo; 2013.
14.
15. Haugum M, Iversen HH. Pasienterfaringer med døgnopphold innen tverrfaglig spesialisert rusbehandling – resultater etter en nasjonal undersøkelse i 2014. PasOpp-rapport nr. 6–2014. Nasjonalt kunnskapssenter for helsetjenesten, Oslo; 2014.
16. Myers B, Govender R, Koch JR, Manderscheid R, Johnson K, Parry CD. Development and psychometric validation of a novel patient survey to assess perceived quality of substance abuse treatment in South Africa. Subst Abuse Treat Prev Policy. 2015;10:44. doi:10.1186/s13011-015-0040-3
17. Haugum M, Iversen HH, Bjertnaes O, Lindahl AK. Patient experiences questionnaire for interdisciplinary treatment for substance dependence (PEQ-ITSD): reliability and validity following a national survey in Norway. BMC Psychiatry. 2017;17(1):73. doi:10.1186/s12888-017-1489-6
18. Holcomb WR, Parker JC, Leong GB. Outcomes of inpatients treated on a VA psychiatric unit and a substance abuse treatment unit. Psychiatr Serv. 1997;48(5):699–704. doi:10.1176/ps.48.11.1458
19. Marsden J, Stewart D, Gossop M, et al. Assessing client satisfaction with treatment for substance use problems and the development of the Treatment Perceptions Questionnaire (TPQ). Addict Res. 2000;8(5):455–470. doi:10.3109/16066350009005590
20. de Los Cobos JP, Valero S, Haro G, et al. Development and psychometric properties of the Verona Service Satisfaction Scale for methadone-treated opioid-dependent patients (VSSS-MT). Drug Alcohol Depend. 2002;68(2):209–214. doi:10.1016/S0376-8716(02)00196-5
21. De Wilde EF, Hendriks VM. The client satisfaction questionnaire: psychometric properties in a Dutch addict population. Eur Addict Res. 2005;11(4):157–162. doi:10.1159/000086396
22. Hubley AM, Palepu A. Injection Drug User Quality of Life Scale (IDUQOL): findings from a content validation study. Health Qual Life Outcomes. 2007;5:46. doi:10.1186/1477-7525-5-46
23. de Los Cobos JP, Trujols J, Sinol N, Batlle F. Development and validation of the scale to assess satisfaction with medications for addiction treatment-methadone for heroin addiction (SASMAT-METHER). Drug Alcohol Depend. 2014;142:79–85. doi:10.1016/j.drugalcdep.2014.06.028
24. Harris AH, Humphreys K, Finney JW. Veterans Affairs facility performance on Washington Circle indicators and casemix-adjusted effectiveness. J Subst Abuse Treat. 2007;33(4):333–339. doi:10.1016/j.jsat.2006.12.015
25. Williams EC, Gupta S, Rubinsky AD, et al. Variation in receipt of pharmacotherapy for alcohol use disorders across racial/ethnic groups: a national study in the U.S. Veterans Health Administration. Drug Alcohol Depend. 2017;178:527–533. doi:10.1016/j.drugalcdep.2017.06.011
26. Harris AH, Gupta S, Bowe T, et al. Predictive validity of two process-of-care quality measures for residential substance use disorder treatment. Addict Sci Clin Pract. 2015;10:22. doi:10.1186/s13722-015-0042-5
27. Snijders TAB, Bosker RJ. Multilevel Analysis – An Introduction to Basic and Advanced Multilevel Modeling.
28. Peugh JL. A practical guide to multilevel modeling. J Sch Psychol. 2010;48(1):85–112. doi:10.1016/j.jsp.2009.09.002
29. Lai MHC, Kwok O-M. Examining the rule of thumb of not using multilevel modeling: the “design effect smaller than two” rule. J Exp Educ. 2015;83(3):423–438. doi:10.1080/00220973.2014.907229
30.
31. O’Malley AJ, Zaslavsky AM, Elliott MN, Zaborski L, Cleary PD. Case-mix adjustment of the CAHPS Hospital Survey. Health Serv Res. 2005;40(6 Pt 2):2162–2181. doi:10.1111/j.1475-6773.2005.00470.x
32. Crow R, Gage H, Hampson S, et al. The measurement of satisfaction with healthcare: implications for practice from a systematic review of the literature. Health Technol Assess. 2002;6(32):1–244. doi:10.3310/hta6320
33. Batbaatar E, Dorjdagva J, Luvsannyam A, Savino MM, Amenta P. Determinants of patient satisfaction: a systematic review. Perspect Public Health. 2017;137(2):89–101. doi:10.1177/1757913916634136
34. Kossovsky MP, Sarasin FP, Chopard P, et al. Relationship between hospital length of stay and quality of care in patients with congestive heart failure. Qual Saf Health Care. 2002;11(3):219–223.
35. Bjertnaes O, Iversen HH, Kjollesdal J. PIPEQ-OS – an instrument for on-site measurements of the experiences of inpatients at psychiatric institutions. BMC Psychiatry. 2015;15:234. doi:10.1186/s12888-015-0621-8
36. Katsakou C, Bowers L, Amos T, et al. Coercion and treatment satisfaction among involuntary patients. Psychiatr Serv. 2010;61(3):286–292. doi:10.1176/ps.2010.61.3.286
37. Trujols J, Iraurgi I, Oviedo-Joekes E, Guardia-Olmos J. A critical analysis of user satisfaction surveys in addiction services: opioid maintenance treatment as a representative case study. Patient Prefer Adherence. 2014;8:107–117. doi:10.2147/PPA.S52060
38. Paddison C, Elliott M, Parker R, et al. Should measures of patient experience in primary care be adjusted for case mix? Evidence from the english general practice patient survey. BMJ Qual Saf. 2012;21(8):634–640. doi:10.1136/bmjqs-2011-000737
39. Braithwaite RS. Risk adjustment for quality measures is neither binary nor mandatory. JAMA. 2018;319(20):2077–2078. doi:10.1001/jama.2018.3368
40. Myers B, Williams PP, Govender R, Manderscheid R, Koch JR. Substance abuse treatment engagement, completion and short-term outcomes in the Western Cape province, South Africa: findings from the service quality measures initiative. Drug Alcohol Depend. 2018;185:278–284. doi:10.1016/j.drugalcdep.2017.12.033
 © 2019 The Author(s). This work is published and licensed by Dove Medical Press Limited. The
full terms of this license are available at https://www.dovepress.com/terms
and incorporate the Creative Commons Attribution
- Non Commercial (unported, 3.0) License.
By accessing the work you hereby accept the Terms. Non-commercial uses of the work are permitted
without any further permission from Dove Medical Press Limited, provided the work is properly
attributed. For permission for commercial use of this work, please see paragraphs 4.2 and 5 of our Terms.
© 2019 The Author(s). This work is published and licensed by Dove Medical Press Limited. The
full terms of this license are available at https://www.dovepress.com/terms
and incorporate the Creative Commons Attribution
- Non Commercial (unported, 3.0) License.
By accessing the work you hereby accept the Terms. Non-commercial uses of the work are permitted
without any further permission from Dove Medical Press Limited, provided the work is properly
attributed. For permission for commercial use of this work, please see paragraphs 4.2 and 5 of our Terms.