Back to Journals » International Journal of Nanomedicine » Volume 11
Oxidative stress response in neural stem cells exposed to different superparamagnetic iron oxide nanoparticles
Authors Pongrac I, Pavičić I, Milić M, Brkić Ahmed L, Babič M, Horak D ![]() , Vinković Vrček I, Gajović S
, Vinković Vrček I, Gajović S
Received 17 December 2015
Accepted for publication 24 February 2016
Published 26 April 2016 Volume 2016:11 Pages 1701—1715
DOI https://doi.org/10.2147/IJN.S102730
Checked for plagiarism Yes
Review by Single anonymous peer review
Peer reviewer comments 2
Editor who approved publication: Dr Thomas Webster
Igor M Pongrac,1 Ivan Pavičić,2 Mirta Milić,2 Lada Brkič Ahmed,1 Michal Babič,3 Daniel Horák,3 Ivana Vinković Vrček,2 Srećko Gajović1
1School of Medicine, Croatian Institute for Brain Research, University of Zagreb, 2Institute for Medical Research and Occupational Health, Zagreb, Croatia; 3Institute of Macromolecular Chemistry, Academy of Sciences of the Czech Republic, Prague, Czech Republic
Abstract: Biocompatibility, safety, and risk assessments of superparamagnetic iron oxide nanoparticles (SPIONs) are of the highest priority in researching their application in biomedicine. One improvement in the biological properties of SPIONs may be achieved by different functionalization and surface modifications. This study aims to investigate how a different surface functionalization of SPIONs – uncoated, coated with D-mannose, or coated with poly-L-lysine – affects biocompatibility. We sought to investigate murine neural stem cells (NSCs) as important model system for regenerative medicine. To reveal the possible mechanism of toxicity of SPIONs on NSCs, levels of reactive oxygen species, intracellular glutathione, mitochondrial membrane potential, cell-membrane potential, DNA damage, and activities of SOD and GPx were examined. Even in cases where reactive oxygen species levels were significantly lowered in NSCs exposed to SPIONs, we found depleted intracellular glutathione levels, altered activities of SOD and GPx, hyperpolarization of the mitochondrial membrane, dissipated cell-membrane potential, and increased DNA damage, irrespective of the surface coating applied for SPION stabilization. Although surface coating should prevent the toxic effects of SPIONs, our results showed that all of the tested SPION types affected the NSCs similarly, indicating that mitochondrial homeostasis is their major cellular target. Despite the claimed biomedical benefits of SPIONs, the refined determination of their effects on various cellular functions presented in this work highlights the need for further safety evaluations. This investigation helps to fill the knowledge gaps on the criteria that should be considered in evaluating the biocompatibility and safety of novel nanoparticles.
Keywords: superparamagnetic iron oxide nanoparticles, biocompatibility, oxidative stress, genotoxicity, murine neural stem cells
Introduction
With the rapid developments in cell biology, regenerative medicine has evolved as a new field in which new treatment strategies employing the therapeutic capacity of stem cells increase steadily in number. The ability of stem cells to differentiate into multiple lineages of somatic cells facilitates their therapeutic use in regenerating or replacing damaged tissues.1,2 This brings a number of opportunities for treating degenerative diseases or repairing injured tissue, such as in the postischemic brain.1–4 In assessing the therapeutic possibilities of stem cells, accurate tracking methods for determining the dynamics of cell migration and differentiation after implantation into the host organ are needed.3,4 One of the most useful, successful, and noninvasive methods in cell tracking is cellular magnetic resonance imaging (MRI), which uses a different contrasting agent in order to enable a good visualization of the cells.1–5 Among the various MR-contrast media, superparamagnetic iron oxide nanoparticles (SPIONs) are the most extensively studied, due to their efficacy, clinical applicability, and safety.1–5 SPIONs are also used in other emerging fields of nanomedicine and nanoscience (magnetic hyperthermia, drug/gene delivery, tissue engineering, gene delivery, cell sorting, MRI-assisted diagnosis, and surgery).1,2 Several classes of SPIONs were initially approved for clinical use, such as Feridex, Combidex, Feraheme, Endorem, and Resovist, but approval was later withdrawn.6–8 Although successful for many applications and claimed to be safe, the response of the cells after labeling with SPIONs still needs to be clarified in detail.4–7 The biosafety of nanoparticles (NPs) is a prerequisite for their application in biomedicine.9 One of the major challenges in theranostic applications of SPIONs is to improve their selectivity and efficacy and reduce their side effects.5 There is accumulated evidence that metallic NPs have cytotoxic potential due to an enhanced reactive surface area and the ability to cross cell and tissue barriers.2,7,10 Some studies have shown that SPION accumulation may affect normal physiological stimuli, differentiation of cells, and even cause oxidative stress to cells.4 It has been reported that labeling of cells with SPIONs for a longer period leads to a transient increase in reactive oxygen species (ROS).5 The discharge of iron from SPIONs may occur in the lysosomes due to their acidic pH and the presence of reducing compounds, such as cysteine, ascorbic acid, and glutathione (GSH).11 Once the free iron enters the cytosol, it is able to interact with hydrogen peroxide physiologically formed by different types of enzyme-catalyzed reactions, generating free radicals.12,13 In general, the cellular oxidative stress caused by the formation of ROS is considered to be a key mechanism of nanomaterial toxicity.2,10,14–19 Moreover, oxidative stress, together with its secondary consequences, is known to be involved in the pathogenesis of many diseases, such as cancer, diabetes, and respiratory problems, as well as in aging processes.19,20 In vivo experiments have demonstrated that the composition, size, and surface functionalization of NPs dictate their toxicity.21 In addition, modification in surface properties may improve cellular internationalization while decreasing the possible side effects.22,23
Safety and risk assessments of metallic NPs are of the highest priority for investigating their possible application in biomedicine.7,24–26 In vitro methods constitute valuable tools for fast screening and identification of toxic potential of NPs indicating those NPs that must be submitted to longer-term in vivo tests.27,28 Furthermore, screening results may serve to identify the physicochemical characteristics responsible for NP safety/toxicity aiding to the safer design of NPs.29
The aim of this study was to investigate how different surface functionalization of SPIONs affected their biocompatibility. Several types of SPIONs have already been developed with functionalized biocompatible polymers and targeting agents.2,30–33 They exhibit improved properties, such as higher relaxivity, better colloidal stability, and easier internalization by cells, compared to commercial contrast agents.2,30–35 To investigate the role of surface coating on their potential cytotoxicity, we selected three types of SPIONs: uncoated (UnSPIONs), coated with D-mannose (ManSPIONs), and coated with poly-L-lysine (PLLSPIONs). The study was done on neural stem cells (NSCs) as an important model system for regenerative medicine.34 To reveal the possible mechanisms of SPION toxicity, ROS and intracellular GSH levels, mitochondrial membrane potential (MMP), cell MP (CMP), SOD and GPx activity, and DNA damage were examined. Indeed, all of the tested SPIONs showed a substantial influence on NSCs, implying that their use in vivo can be associated with noticeable side effects.
Materials and methods
Chemicals and materials
If not otherwise stated, chemicals were obtained from Sigma-Aldrich (St Louis, MO, USA). Phenol-red free Dulbecco’s Modified Eagle’s Medium (DMEM) with 4.5 g/L glucose and 4-(2-hydroxyethyl)-1-piperazineethanesulfonic acid (HEPES) as the buffering agent (product number 12-709) was obtained from Lonza (Basel, Switzerland). The plastic and glassware used for chemical analysis were from Sarstedt (Nümbrecht, Germany). Osmium tetroxide was purchased from Agar Scientific (Stansted, UK) and epoxy resin (medium hard) from TAAB Laboratories Equipment (Aldermaston, UK). GPx and SOD assay kits were purchased from Cayman Chemical (Ann Arbor, MI, USA). All dilutions were made with high purity deionized water (18.2 MΩcm), obtained from a Milli-Q® system (EMD Millipore, Billerica, MA, USA).
Synthesis and characterization of SPIONs
Three different superparamagnetic iron oxide (γ-Fe2O3) NPs – UnSPIONs, ManSPIONs, and PLLSPIONs – were prepared according to previously described methods.35 Briefly stated, UnSPIONs were prepared by coprecipitation of FeCl2 and FeCl3, followed by the oxidation of the resulting magnetite with sodium hypochlorite.30 The postsynthesis coating of UnSPIONs with D-mannose or poly-L-lysine was achieved by addition of D-mannose or poly-L-lysine to the primary uncoated maghemite cores.33 Careful characterization and colloidal stability evaluation of each SPION type was conducted in both ultrapure water (UPW) and phenol-red free DMEM as cell-free culture medium. Particle morphology and particle-size distribution were examined by transmission electron microscopy (TEM; 902A; Carl Zeiss Meditec AG, Jena, Germany) operated in bright-field mode at an acceleration voltage of 80 kV. Images were recorded with a Canon PowerShot S50 camera attached to the microscope. TEM samples were prepared by depositing a drop of the particle suspension on a Formvar-coated copper grid and air-drying at room temperature. The size and charge of SPIONs were measured at 25°C by dynamic light scattering (DLS) and electrophoretic LS at 173°C using Zetasizer Nano ZS (Malvern Instruments, Malvern, UK) equipped with a green laser (532 nm). The hydrodynamic diameter (dH) was obtained as a value at the peak maximum of the particle-size volume-distribution function. Size values are reported as an average of ten measurements. The charge of the NPs was characterized by ζ-potential values, which were calculated from the measured electrophoretic mobility. Results are expressed as an average value of five measurements. The data were processed by the Zetasizer software (6.32; Malvern Instruments). Detailed information on the characterization of the three types of SPIONs is given in a previously published study.36 A stock solution of SPIONs (4 mg/mL) was prepared in UPW. Before each experiment, dilutions of SPION suspensions were performed in DMEM followed by sonication for 10 minutes in a sonication bath on ice.
Animals
Wild-type C57Bl/6NCrl mouse fetuses were used to obtain NSCs. All animal procedures were approved by the internal review board of the ethics committee of the School of Medicine, University of Zagreb, and were in accordance with the ethical codex of the Croatian Society for Laboratory Animal Science and with EU Directive 2010/63/EU on the protection of animals used for scientific purposes. In compliance with the regulations, extreme caution was taken to ameliorate and minimize the suffering of the animals. All of the animals were used only once.
Neural stem cell culture and treatment
NSCs were isolated from pregnant wild-type C57Bl/6NCrl females. At gestation day 14.5, embryos were isolated and parts of the telencephalic wall were microdissected and dissociated using StemPro Accutase® (Thermo Fisher Scientific, Waltham, MA, USA). After mechanical cell dissociation by trituration, round stem cells were obtained. Cells were maintained at 37°C in a humidified atmosphere with 5% CO2/95% O2. As it has been well established that temperature, among other physicochemical parameters, has significant effects on the nature of interaction between NPs and biological surfaces,37 the temperature was very carefully controlled during all cell experiments by performing them in a New Brunswick Galaxy 48R incubator (Eppendorf AG, Hamburg, Germany). The proliferation medium contained: DMEM/F-12 with GlutaMax, 1% N2, 2% B27, 1% penicillin–streptomycin, EGF (20 ng/mL), and FGF (10 ng/mL) (all Thermo Fisher Scientific). The neurospheres were dissociated and NSCs plated in a single-cell state for further experiments. All of the plates had been previously coated for 12 hours with 50 μg/mL poly-D-lysine water solution (Sigma-Aldrich).
Prior to each experiment, cells were seeded in quintuplicate at a density of 2×10⁶, 8×10⁵, and 1×10⁴ cells/well on 6-, 12-, or 96-well plates, respectively. At 24 hours after NSC plating, the culture medium was refreshed and supplemented with increasing concentrations of SPIONs (20, 100, and 200 mg/L). This concentration range was chosen according to previously published results on labeling efficiency without adverse effects of UnSPIONs and ManSPIONs in rat bone marrow stromal cells.30 Control cells without treatment were included in each analysis. At the end of the exposure period, the toxicity end points were evaluated in the control and exposed cells. Each experiment was repeated at least three times.
Cell viability
Viability of NSCs was measured using Cell Counting Kit 8, which utilizes tetrazolium salt WST-8 (2-[2-methoxy-4-nitrophenyl]-3-[4-nitrophenyl]-5-[2,4-disulfophenyl]-2H-tetrazolium, monosodium salt). WST-8 is reduced by cell dehydrogenases to give a highly water-soluble yellow formazan product. The amount of the formazan dye is directly proportional to the number of living cells.
The NSCs were treated with SPIONs for 24 hours at 37°C. Negative controls without treatment were used for each analysis. Cells treated with dimethyl sulfoxide were used as positive controls. At the end of the treatment, the cells were washed three times with 200 μL phosphate-buffered saline (PBS)/well to minimize the interferences of SPIONs with the assay.
The washing steps were critical, because SPION concentration should be decreased as much as possible to reduce the risk of interference, as shown previously.36 However, the washing needed to be gentle, careful, and highly reproducible, as the NSCs may be easily detached from the culture plate and removed with the supernatants. After washing, 10 μL of WST-8 solution was added to each well. After 4 hours’ incubation at 37°C, optical density at 450 nm was determined for each well using a Victor multiplate reader (PerkinElmer, Waltham, MA, USA).
Measurement of intracellular ROS level
ROS production in NSCs treated with SPIONs was determined using 2′,7′-dichlorodihydrofluorescein diacetate (DCFH-DA) and dihydroethidium (DHE) staining. The molecular probes DCFH-DA and DHE are both nonfluorescent unless oxidized by intracellular ROS.
DCFH-DA penetrates cell membranes freely and is hydrolyzed by cellular esterases to form DCFH, which is oxidized to the fluorescent 2′,7′-dichlorofluorescein (DCF) in the presence of hydroxyl radicals.38 DHE oxidized in the presence of a superoxide radical to fluorescent 2-hydroethidium (EOH), which is stable within the cell, allowing for precise measurement of DHE fluorescence without risk of interconversion variability.5
Dose-dependent measurements of ROS generation were done by incubating cells with SPIONs (20, 100, and 200 mg/L) for 4 hours at 37°C. Hydrogen peroxide-treated cells (100 μM H2O2) were used as positive controls and untreated cells used as negative controls. After treatment, the cells were washed three times with PBS (to avoid interference), followed by staining with 20 μM DCFH-DA or 20 μM DHE for 30 minutes at 37°C. Cells were then washed twice with PBS and analyzed using the Victor multiplate reader at an excitation wavelength of 485 nm and emission wavelength of 535 nm. Data are expressed as percentage fluorescence compared with relevant negative controls.
To evaluate dynamic conditions of cell response to oxidative stress, additional experiments were done in which NSCs were exposed first to different concentrations of SPIONs for 4 hours at 37°C, then washed with DMEM, incubated in DMEM for an additional 4 hours at 37°C, followed by DCFH-DA and DHE staining for 30 minutes at 37°C, then washed twice with PBS and analyzed using a multiplate reader.
Quantification of intracellular GSH
Analysis of intracellular GSH levels was performed using a fluorogenic bimane probe – monochlorobimane (MBCl) – which reacts specifically with GSH to form a fluorescent adduct.39 After treatment with SPIONs for 4 hours at 37°C, the NSCs were washed three times with PBS, followed by incubation with 50 μM MBCl for 20 minutes at 37°C. The cells were then washed twice with PBS and analyzed using the Victor multiplate reader at an excitation wavelength of 355 nm and emission wavelength of 460 nm. Negative (untreated) and positive (treated with 100 μM H2O2) cell-treatment controls were included in each experiment. Dynamic oxidative stress conditions were evaluated by treating the NSCs with SPIONs for 4 hours at 37°C and washing them afterward with DMEM, followed by incubation in DMEM for an additional 4 hours at 37°C. Then, NSCs were stained with 50 μM MBCl for 20 minutes at 37°C, washed twice with PBS, and analyzed using the multiplate reader. All of the data are expressed as percentage fluorescence compared to relevant negative controls.
Determination of enzyme activities
After treatment of NSCs with SPIONs for 4 hours at 37°C, the medium was removed. The adherent cells were washed three times with PBS solution, detached from plates using Accutase, and then collected by centrifugation at 1,500 g for 10 minutes at 4°C. Negative (untreated) and positive (treated with 100 μM H2O2) cell-treatment controls were included in each experiment.
For determination of GPx activity, the collected cells were suspended and lysed on ice by ultrasound for 15 seconds in cold 50 mM Tris-HCl buffer (pH 7.5) containing 5 mM ethylenediaminetetraacetic acid (EDTA) and 1 mM dithiothreitol. Subsequently, the lysates were clarified by centrifugation at 10,000 g for 15 minutes at 4°C to remove cellular debris and used for determination of enzyme activities. The total GPx (EC 1.11.1.9) activity was measured using a GPx assay kit (Cayman Chemical) which measures GPx activity indirectly by a coupled reaction with GSH reductase. Oxidized GSH produced upon reduction of H2O2 by GPx was recycled to its reduced state by GSH reductase and NADPH. The oxidation of NADPH to NADP+ was accompanied by a decrease in absorbance at 340 nm. Under conditions in which GPx activity is rate-limiting, the rate of decrease measured at 340 nm is directly proportional to the GPx activity in the sample. The absorbance was recorded using the Victor multiplate reader. All GPx activities were calculated as nmol/min/mL.
For determination of SOD activity, the collected cells were suspended and lysed on ice by ultrasound for 15 seconds in cold 20 mM HEPES buffer pH 7.2 containing 1 mM ethylene glycol tetraacetic acid, 210 mM mannitol, and 70 mM sucrose. Subsequently, the lysates were clarified by centrifugation at 1,500 g for 5 minutes at 4°C, and supernatants were used for determination of enzyme activities. The total SOD (EC 1.15.1.1) activity was measured using a SOD assay kit (Cayman Chemical). The method utilizes tetrazolium salt for detection of superoxide radicals generated by xanthine oxidase and hypoxanthine. The absorbance at 450 nm, measured by using the Victor multiplate reader, was directly proportional to the SOD activity in the sample. One unit of SOD is defined as the amount of enzymes needed to exhibit 50% dismutation of the superoxide radical. The SOD assay measures all three types of SOD (Cu/Zn, Mn, and Fe SOD). All SOD activities were calculated as U/mL. All enzyme activities are expressed as percentage of controls.
Measurement of mitochondrial membrane potential
Changes in MMP were estimated using the fluorescent carbocyanine dye 3,3′-dihexyloxacarbocyanine iodide (DiOC6), which rapidly reaches equilibrium in the mitochondria with low quenching effects when used at low nanomolar concentrations.40 This lipophilic cationic dye is concentrated within mitochondria and released during mitochondrial membrane depolarization.40
After treatment with SPIONs for 4 hours at 37°C, the NSCs were washed three times with PBS to avoid interference with fluorescent dye. Then, cells were incubated with 20 nM DiOC6 for 30 minutes at 37°C. The stained cells were then washed with PBS and analyzed using the Victor multiplate reader at an excitation wavelength of 485 nm and emission wavelength of 510 nm. Negative (untreated) and positive (treated with 500 μM H2O2) cell-treatment controls were included in each experiment. The data are expressed as percentage fluorescence compared to relevant negative controls.
Evaluation of changes in membrane potential
Changes in the CMP of treated NSCs compared to control cells were measured using an ion-channel MP assay kit (MPF-Kit2; Fivephoton Biochemicals, San Diego, CA, USA). This kit provides an easy-to-use, highly sensitive, accurate quantitative method to measure changes in ion flux and MP using fluorescent voltage-sensitive dyes and quencher mixtures that eliminate the need for washes, and minimize data scatter, without a patch-clamp technique. MP-assay oxonol dyes enter depolarized cells and bind to intracellular proteins or membranes, resulting in enhanced fluorescence and a red spectral shift. An increase in membrane depolarization leads to an elevated influx of voltage-sensitive dye and an increase in fluorescence.
After treatment with SPIONs for 4 hours at 37°C, the NSCs were washed three times with PBS to avoid interference with fluorescent dye. Then, the assay was performed according to the manufacturer’s instructions. The stained cells were then analyzed, without any washing step, using the Victor multiplate reader at 530 nm excitation and 565 nm emission. Time courses were generated by recording fluorescence intensities every 30 seconds for 5 minutes.
Relative changes in fluorescence intensity (ΔF/F0) were calculated as the difference between fluorescence intensities of treated and control (untreated) cells (ΔF) divided by the initial intensity value (F0). Using Boltzmann distribution, changes in MP were calculated according to previous analysis41 and using the following equation:
|
|
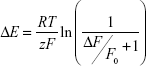
where R, T, z, and F represent the gas constant, the absolute temperature, the apparent charge, and Faraday’s constant, respectively.
Comet assay
DNA damage in NSCs was detected by the use of an alkaline version of the comet assay.8 After treatment with SPIONs for 24 hours at 37°C, cells were washed with PBS and detached by the use of Accutase in order to gain single-cell suspension (confirmed by light microscopy) and resuspended in 3 mL of DMEM. A single-cell suspension was centrifuged at 800 rpm for 8 minutes in order to remove the nonactivated Accutase. The supernatant was removed and 100 μL of DMEM was added. Aliquots of 10 μL of this suspension (counted in order to gain a count of 104 cells per microscopic slide prepared) were mixed with 100 μL of 0.5% low-melting agarose, and the suspension was placed on slides precoated with 200 μL of 1% normal-melting agarose. Slides were allowed to solidify on ice for 10 minutes and afterward kept in prechilled lysis solution (2.5 mol/L NaCl, 100 mmol/L Na2EDTA, 10 mmol/L Tris, pH 10, 1% sodium sarcosinate, 1% Triton X-100, 10% dimethyl sulfoxide) at 4°C. After 1 hour, the slides were placed in freshly prepared denaturation and electrophoresis buffer (10 mmol/L NaOH, 200 mmol/L Na2EDTA, pH 13), incubated for 20 minutes at 4°C, and electrophoresed in new solution for denaturation for 20 minutes at 25 V and 300 mA. Finally, the slides were neutralized three times, 5 minutes each time, in 0.4 mol/L Tris buffer (pH 7.5) and analyzed the same day. The slides were kept in a humid atmosphere in the dark at 4°C until staining and further analysis. Negative (untreated) cell-treatment controls were included in each experiment. Experiments were done in duplicate and analyzed for statistical differences between the same treatments.
For image analysis, slides were stained with 100 μL of 20 μg/mL ethidium bromide solution for 10 minutes. A minimum of 110 randomly selected DNAs per sample (55 comets/slide) were scored. Comets were randomly captured at a constant depth of the gel, avoiding the edges of the gel, occasional dead cells, and DNA near or trapped in an air bubble and superimposed comets. Microscopic slides were examined at 250× magnification with a fluorescence microscope (excitation filter 515–560 nm, barrier filter 590 nm; Zeiss), and DNA-damage parameters were scored using a computer-based image-analysis system (Comet Assay IV; Perceptive Instruments, Bury St Edmunds, UK) attached to a fluorescence microscope with a charge-coupled device camera. Undamaged DNA has a round shape, and damaged DNA has the shape of a comet. The tail of the comet represents the amount of DNA damage. The parameters selected for the quantification of DNA damage were comet-tail length (in micrometers, calculated from the center of the head of the comet) and tail intensity (percentage DNA in comet tail). The extent of DNA damage, as recorded by the alkaline comet assay, was analyzed considering the mean (± standard deviation of the mean), median, and range of the comet parameters measured.
Statistical analysis
Differences between treatments for the different measured variables were tested using the Mann–Whitney U-test and one-way analysis of variance with post hoc Scheffé test and Pearson’s χ2 test. In other cases, the differences against controls were tested using the Dunnett test or Kruskal–Wallis analysis of variance by Ranks test (nonparametric test used when assumptions of homogeneity of variances were not reachable). The minimal significance level was P<0.05. All statistical analyses were computed using Statistica 10.0 (StatSoft Inc, Tulsa, OK, USA).
Results
In the present study, we evaluated the response of NSCs to exposure to three different types of SPIONs applied at three different concentrations (20, 100, and 200 mg/L) at two different time points (4 and 24 hours). The two types of surface coatings (D-mannose and poly-L-lysine) were selected for their known biocompatibility within central nervous system applications,30,33,35 while UnSPIONs were used for the purpose of comparison.
Nanoparticle characterization
SPION particle size, surface charge, and aggregation behavior have previously been studied in detail in both UPW and DMEM using TEM, DLS, and electrophoretic LS.36 Hydrodynamic diameter (dH), polydispersity index (PDI) and ζ-potential were verified just before the cell experiments. In UPW, the volume size distribution was monomodal for UnSPIONs and ManSPIONs, whereas PLLSPIONs had a bimodal distribution. DLS data showed that all SPION types were ~100 nm in size and characterized by negative ζ-potential values (Table 1). Only PLLSPIONs had an additional large population of 443.4±105.7 nm particles (63%), indicating their partial aggregation already in UPW. Indeed, their ζ-potential of close to zero (−4.8±0.3 mV) may have decreased long-term colloidal stability. Although PLL coating should lead to a net positive surface charge of NPs, the slightly negative ζ-potential may have been the result of negative ions left after particle synthesis and attached to the PLL. Another explanation for the observed ζ-potential of PLLSPIONs may be that the PLL polymer chain was not fully adsorbed to the particle surface. Some part of the chain is adhered to the surface through dielectric and complex interaction, and the other chain part remains floating in supernatant around the particle.33 The drawback of the ζ-potential measurement is that it does not measure surface potential, but rather its gradient at a certain distance from the solid surface.
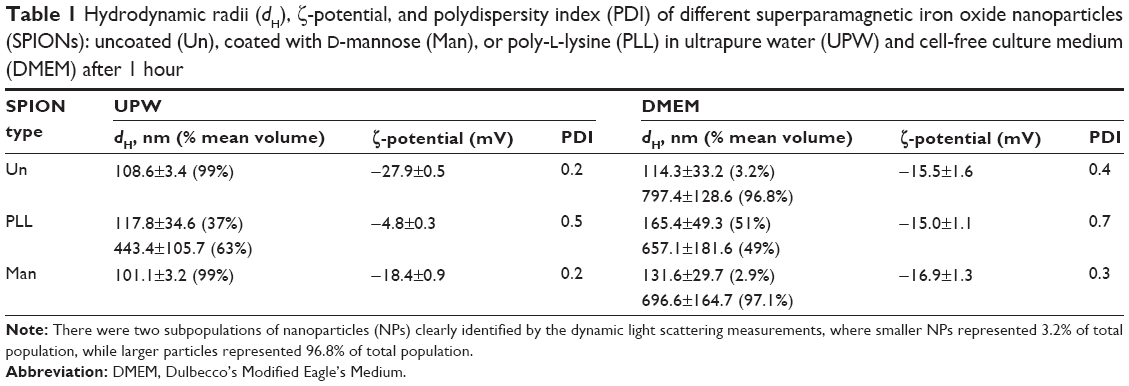 | Table 1 Hydrodynamic radii (dH), ζ-potential, and polydispersity index (PDI) of different superparamagnetic iron oxide nanoparticles (SPIONs): uncoated (Un), coated with D-mannose (Man), or poly-L-lysine (PLL) in ultrapure water (UPW) and cell-free culture medium (DMEM) after 1 hour |
The recorded TEM images were in accordance with DLS data (Figure 1). Upon dispersal in cell-free culture medium (DMEM), a significant aggregation of UnSPIONs and ManSPIONs occurred, in agreement with previously published data.36 The decreased SPION stability in DMEM may be explained by the decreased absolute ζ-potential values affecting the electrostatic stabilization, which became insufficient to prevent particle aggregation (Table 2). However, surface charge became more negative only for PLLSPIONs, consistent with their similar size distributions in UPW and DMEM.
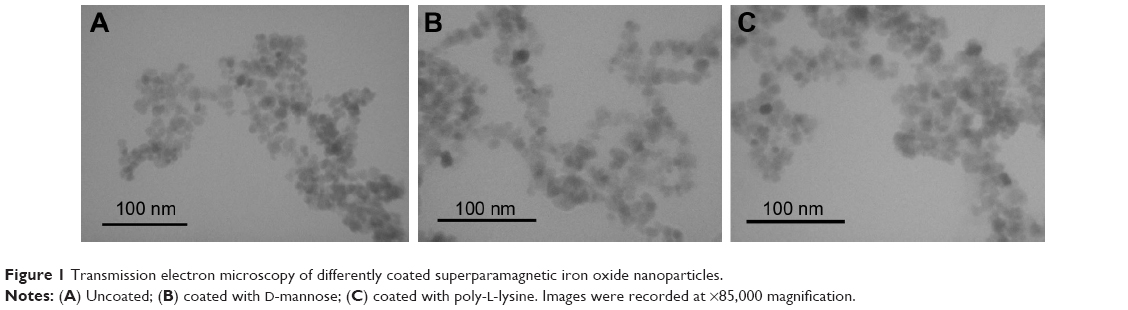 | Figure 1 Transmission electron microscopy of differently coated superparamagnetic iron oxide nanoparticles. |
 | Table 2 Evaluation of primary DNA damage in neural stem cells following 24-hour exposure to uncoated superparamagnetic iron oxide nanoparticles (UnSPIONs), and coated with D-mannose (ManSPIONs) or poly-L-lysine (PLLSPIONs)a |
Effect of SPIONs on cellular viability
The Cell Counting Kit assay was used to measure surrogate-cell viability by detecting mitochondrial reductase activity in living NSCs. None of the tested SPIONs induced a significant reduction in NSC viability after 24 hours of exposure (Figure 2). This is consistent with previous studies, which showed that SPIONs efficiently label stem cells without inducing cytotoxicity up to a concentration of 200 mg/L.4,5,7
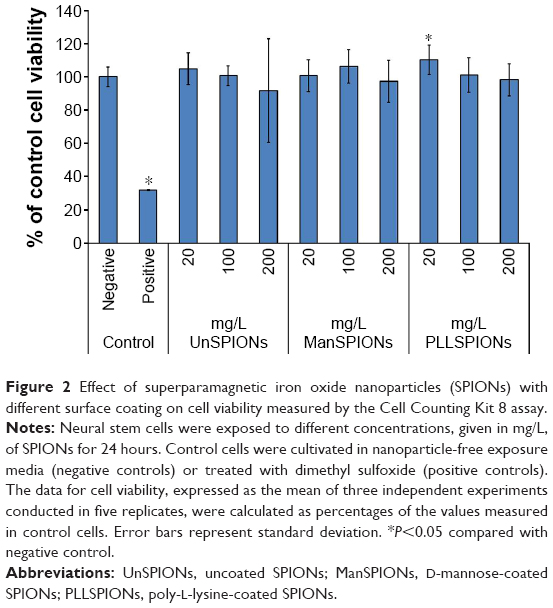 | Figure 2 Effect of superparamagnetic iron oxide nanoparticles (SPIONs) with different surface coating on cell viability measured by the Cell Counting Kit 8 assay. |
Generation of ROS
The intracellular generation of hydroxyl and superoxide radicals was evaluated using the fluorescent dyes DCFH-DA and DHE, respectively. After NSCs had been exposed to different SPIONs for 4 hours, DCF and EOH fluorescence were measured and expressed as percentage of control (untreated cells). Levels of superoxide radicals significantly decreased in NSCs in a dose-dependent manner for all three types of SPIONs (Figure 3). For UnSPIONs and ManSPIONs, formation of hydroxyl radicals also decreased as the SPION dose increased. The PLLSPIONs induced significant increase in DCF fluorescence at the lowest dose, while the highest dose led to a significant decrease in hydroxyl radicals. Although significant, no differences in ROS levels between the treated and control NSCs were higher than 20%. To evaluate the possible NSC recovery from acute oxidative stress, cells were placed in fresh NP-free DMEM for an additional 4 hours after exposure to SPIONs. The obtained results clarified the effect of particular SPIONs on NSCs (Figure 3). For 20 and 100 mg/L UnSPIONs, DCF fluorescence was again significantly lower than controls, as it was prior to the recovery phase, while it was significantly increased postrecovery in the NSCs exposed to the highest concentration of UnSPIONs. For all UnSPION concentrations applied, the level of EOH fluorescence was unchanged in the exposed compared to the control NSCs postrecovery. Interestingly, ROS formation was inhibited after recovery in NSCs exposed to the lowest concentration of either ManSPIONs or PLLSPIONs. Significant increases in hydroxyl radicals were observed in NSCs after recovery from exposure to the highest dose of ManSPIONs and to the middle dose of PLLSPIONs.
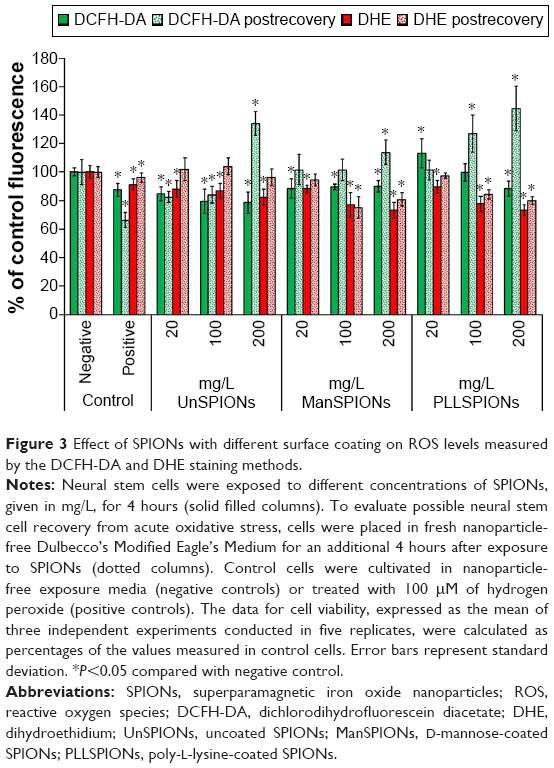 | Figure 3 Effect of SPIONs with different surface coating on ROS levels measured by the DCFH-DA and DHE staining methods. |
Cellular antioxidant response
The action of intracellular molecular antioxidant GSH was assessed with the thiol-interactive fluorescent dye MBCl. Although significantly lower, the DCF and EOH fluorescence in the treated compared to the control cells may implicate an absence of any ROS in treated NSCs; significant depletion of GSH indicated oxidative stress caused by SPION treatment. After 4 hours, the decline in GSH levels in the treated compared to control NSCs was significant and concentration-dependent for all SPIONs (Figure 4). The lowest SPION concentration (20 mg/L) caused a decrease in intracellular GSH level by 40%, while the tenfold-higher SPION concentration decreased GSH by 60% compared to control cells. The positive control, NSCs treated with H2O2 (200 μM), reduced the GSH level to 50%±3% (P<0.01) compared to negative controls. Additionally, there was a recovery of GSH levels in NSCs after 4 hours in NP-free DMEM (Figure 4). A possible reason for this phenomenon was the recycling of oxidized GSH by the cell-defense system. Figure 4 shows that differently coated SPIONs had a similar effect on the GSH status of NSCs. For the lowest-dose treatments, GSH levels completely recovered, but it were still significantly lower in NSCs treated with 100 mg/L or higher dose of SPIONs compared to control cells (Figure 4).
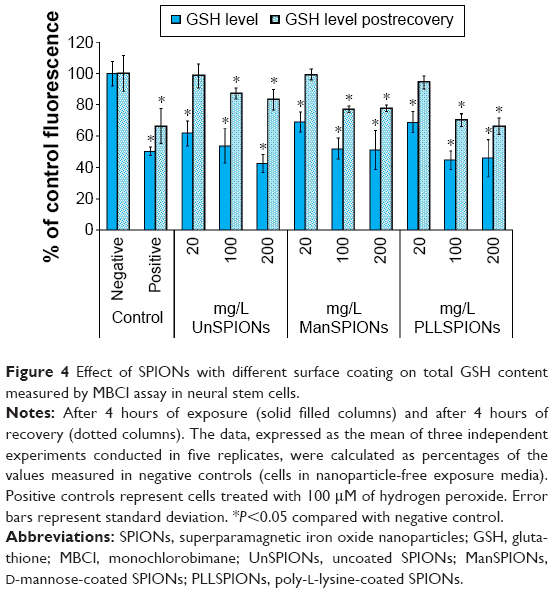 | Figure 4 Effect of SPIONs with different surface coating on total GSH content measured by MBCl assay in neural stem cells. |
Regulation of oxidative stress by antioxidant enzymes was determined by measuring the activities of SOD and GPx in NSCs after a 4-hour exposure to different SPIONs. The results presented in Figure 5 confirmed that the treated NSCs encountered oxidative stress. SOD activity was significantly lower in cells treated with ManSPIONs and PLLSPIONs than in control NSCs, whereas only the highest dose of UnSPIONs caused significant change. However, SOD response was not clearly dependent on the SPION dose. On the contrary, a 4-hour exposure of NSCs to SPIONs led to a dose-dependent increase in GPx activity compared with the untreated cells (Figure 5). The PLLSPIONs had the most pronounced effect on GPx, increasing its activity by 15%, 20%, and 39% at 20, 100 and 200 mg/L, respectively, compared to controls (Figure 5). Similarly to the results for SOD, the UnSPION effect on GPx activity was the lowest compared to the other two SPION types.
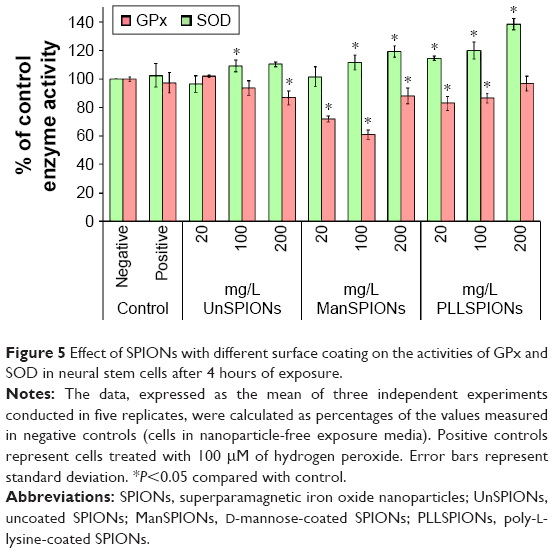 | Figure 5 Effect of SPIONs with different surface coating on the activities of GPx and SOD in neural stem cells after 4 hours of exposure. |
Changes in mitochondrial membrane potential
Toxic oxidative stress may perturb mitochondrial function in many different ways, including dissipation of the MMP. The specific voltage-dependent dye DiOC6 was used to investigate whether different SPIONs could change the MMP in NSCs. This dye was used at a low concentration (20 nM) in nonquenching mode to prevent dye aggregation and quenching in the mitochondria. In addition, experimental setup included NSC treatment before dye loading, in order to make a static comparison of preexisting relative mitochondrial polarization between control and experimental treatments. In such an experimental setup, depolarized (less negative) mitochondria have lower cationic dye concentrations and lower fluorescence, while hyperpolarized (more negative) mitochondria are characterized by higher dye concentrations and fluorescence.
Treatment of NSCs with SPIONs for 4 hours induced significant increase in MMP compared to control cells, detected by increased fluorescence for DiOC6 (Figure 6). This is a clear indication of mitochondrial hyperpolarization. However, the changes in MMP caused by SPIONs were not dose- or type-dependent. All SPIONs, irrespective of the type of surface coating, increased MMPs by 30%–50% compared to untreated NSCs. Consistently, the same pattern was observed for H2O2 treatment as the positive control (Figure 6), indicating that oxidative stress causes mitochondrial membrane hyperpolarization in NSCs.
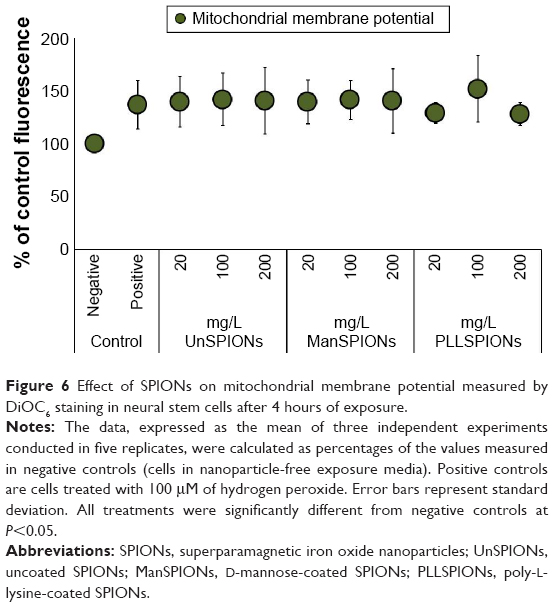 | Figure 6 Effect of SPIONs on mitochondrial membrane potential measured by DiOC6 staining in neural stem cells after 4 hours of exposure. |
Dissipation of cellular membrane potential
The effect of different SPIONs on MP changes in NSCs was studied using the Fivephoton ion-channel MP assay kit. The fluorescence intensities (ΔF/F0) decreased in a dose-dependent manner in the presence of increasing SPION concentrations applied compared to negative controls (Figure 7). Consequently, the calculated changes in MP (ΔE) became more negative upon treatment with SPIONs, indicating cell-membrane depolarization. All SPION types induced significant and dose-dependent depolarization of the cell membrane in NSCs after just 30 seconds (Figure 7). After a pronounced increase at the beginning of the treatment, ΔE remained significantly higher during the next 10 minutes, indicating long-term depolarization of the cell membrane. The highest extent of depolarization was caused by the PLLSPIONs, whereas UnSPIONs induced the lowest NSC-membrane depolarization.
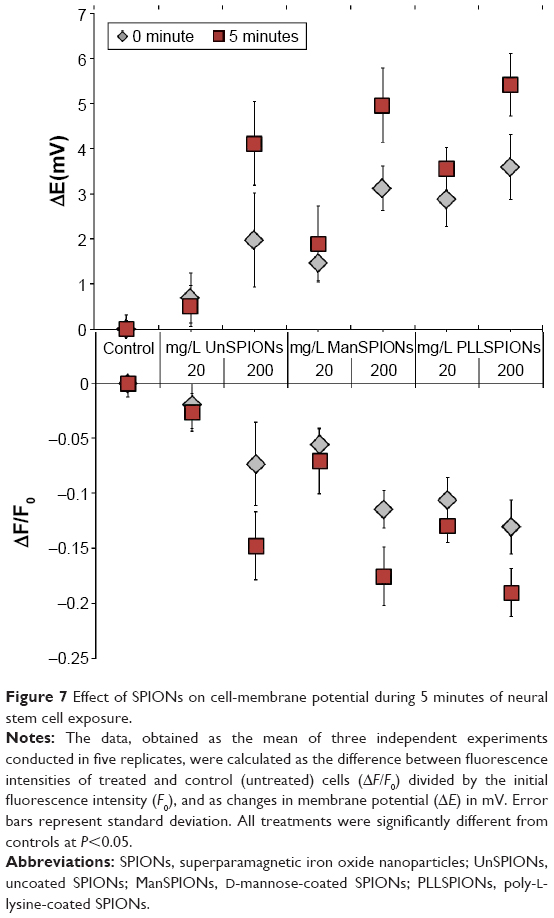 | Figure 7 Effect of SPIONs on cell-membrane potential during 5 minutes of neural stem cell exposure. |
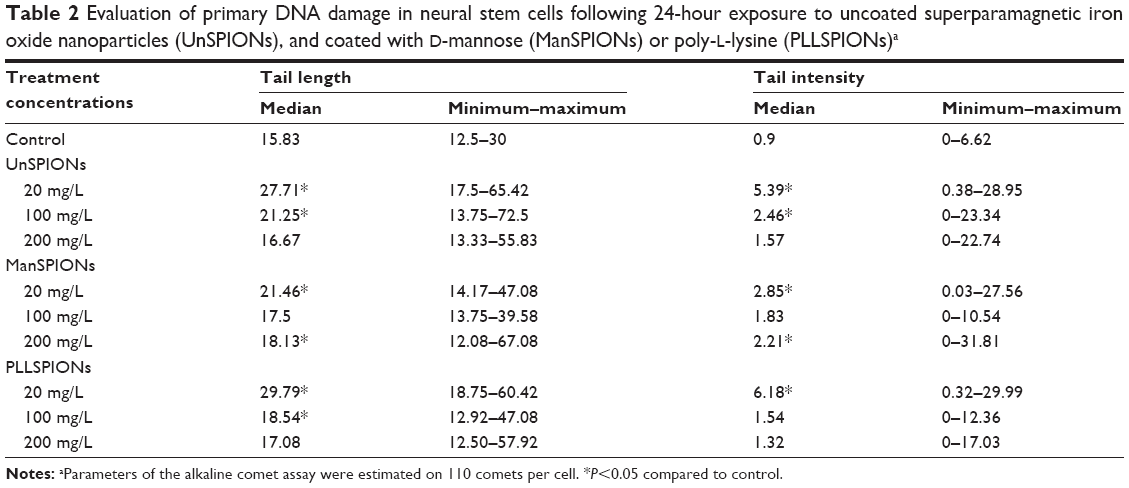
DNA damage
In the case of the comet assay, it is recommended that concentrations for cell treatment should be in the range from nontoxic to ~80% viability, while prolonged exposure is required to ensure uptake by cells and access to DNA.42 It should also be emphasized that no modifications of the assay are necessary during the testing of NPs.42 In our experiments, positive and negative controls were included to demonstrate correct performance of the assay and ensure reproducibility. Untreated cells were used as negative controls to show the background level of DNA damage, whereas the cells treated with hydrogen peroxide, which induces strand breaks, were used as positive controls.
The comet assay on NSCs treated with different SPIONs for 24 hours showed a significant increase in tail length and tail intensity compared to control cells (Table 2), which provided the extent of DNA damage. A comet-like tail in electrophoresis implies the presence of a damaged DNA strand that lags behind that of normal DNA. During electrophoresis, DNA does not migrate on its own, but only its relaxed loops and damaged fragments. The tail of the comet is the result of the migration of relaxed DNA loops and DNA fragments (smaller or larger as results of DNA breaks) that are pulled in by the electric field. The length of these loops/fragments determines the length of the comet tail. On the other hand, tail intensity indicates the actual percentage of damaged DNA in the tail, since there are agents that can cause a few small DNA breaks very distant from the DNA core, and yet represent a small percentage of DNA in the tail (small percentage of DNA damage). Therefore, it is the tail intensity rather than the tail length that is really increased beyond a critical amount of damage.43 Our results on tail lengths and tail intensities were coherent, and both of the measured parameters demonstrated that lower dose of SPIONs induced heavier DNA damage. With increased SPION concentration, tail lengths and tail intensities became lower (Table 2), which could be explained by the aggregation behavior of SPIONs. During the 24 hours, higher concentrations of NPs would promote particle aggregation and/or agglomeration, reducing the effective dose of SPIONs. When SPIONs with different surface coatings were compared, the highest DNA damage was recorded for PLLSPIONs, whereas ManSPIONs caused the lowest increase in tail length and tail intensity (Table 2).
Discussion
The present study has shown that SPIONs altered the oxidant/antioxidant status of NSCs, causing significant biological effects, which could not be detected by a mere measuring of cell viability. Observed GSH depletion, decreased SOD, and increased GPx activity, mitochondrial membrane hyperpolarization, cell-membrane depolarization, and DNA damage could be considered early consequences of ROS production induced by the intracellular actions of SPIONs. The cellular response to SPIONs was similar to those of other metallic NPs noted on various cell types.10,16–18,44,45
Although ROS levels were significantly lowered after 4 hours in treated compared to control cells evaluated by DCFH-DA and DHE staining, this certainly cannot be explained by the beneficial effect of SPIONs on NSCs. Other oxidative stress parameters measured in this study showed that the upregulation of antioxidative defense mechanisms occurred in NSCs exposed to NPs, which in turn efficiently decreased the produced ROS. Indeed, GSH was found to be strongly depleted in response to SPIONs, with no differences among SPION types. As GSH is the major endogenous antioxidant scavenger that protects cells from oxidative stress, its preservation is critical for cell survival.46 A decrease in GSH levels may be explained by its role in the efficient degradation of the radicals formed during oxidative stress. As an alteration in GSH level indicates the adaptive response of the cell to oxidative damage,47 we consider this depletion an indirect measure for persistent acute oxidative stress caused by SPIONs.
According to the hierarchical oxidative stress hypothesis,47 cells respond via protective antioxidant mechanisms to even a minimal amount of ROS, which may result in different levels of biological injury. Various in vivo studies described molecular injury caused by oxidative stress after exposure to iron oxide NPs.23,47,48 Evaluations of other intracellular antioxidant system impairments by SPIONs, such as activities of SOD and GPx, only confirmed our assumption. Along with the GSH, these enzymatic defense mechanisms also play an important role in minimizing the production and action of harmful ROS. It should be emphasized that no significant differences among the responses of GSH, SOD, or GPx were observed upon exposure to differently coated SPIONs (Figures 4 and 5).
SOD is specialized for dismutation of the highly reactive superoxide radical to the less toxic hydrogen peroxide, which in turn is decomposed by GPx at low concentrations and by catalase at high concentrations. In addition, the activity of GPx also indicates the consumption rate of GSH. SOD activity was significantly lower in NSCs exposed to ManSPIONs and PLLSPIONs compared to controls, even at the lowest SPION concentration applied, while UnSPIONs caused a significant decrease in SOD activity at only the highest concentration. Although these changes did not follow a dose-dependent trend, they demonstrated the presence of oxidative stress in NSCs upon treatment with SPIONs. SOD is considered the primary defense line against oxidative stress.49 If oxidative stress is not very strong, SOD activity increases, whereas persistent and profound oxidative stress decreases SOD activity, either by the direct binding of SPIONs to the SOD or by a ROS were production at an amount that disables its activity.
On the contrary, GPx activity significantly increased in treated compared to control NSCs with increased SPION dose. The excess of hydrogen peroxide causes the inactivation of SOD,50 while GPx participates in the oxidative stress response when the concentration of hydrogen peroxide increases. With the GSH as a substrate, the observed changes for GPx, SOD, and GSH indicated that the defense system in NSCs exposed to SPIONs was activated to decrease the peroxy-radical level.
However, ROS formation and elimination are dynamic processes that occur as part of maintaining redox cellular homeostasis.51 At mild oxidative stress conditions, restoration of this homeostasis is easily handled by different defense mechanisms in which the GSH has the key role. To evaluate the severity of observed acute oxidative stress in NSCs induced by SPIONs, ROS and GSH levels were measured in the treated NSCs after 4 hours of recovery. The results were quite interesting (Figures 3 and 4), showing that the antioxidative defense system was capable of neutralizing ROS in NSCs exposed to lower SPION doses. Only the highest dose of all three types of SPIONs induced a pronounced formation of hydroxyl radicals. ROS formation was firstly decreased by the defense system, which was unable to return to cellular redox homeostasis. The reason may have been the high amount of SPIONs accumulated in the treated cells due to the direct effect of SPIONs, released iron ions, and subsequent generation of hydroxyl radicals by Fenton-like reactions. Continuous ROS generation will eventually overcome the cellular defense system. Since it is evident from the results obtained for GSH, SOD, and GPx parameters that this system was activated, it can be concluded that the SPIONs caused acute oxidative stress. It should also be stressed that ManSPIONs induced the lowest, while PLLSPIONs caused the highest changes in oxidative stress markers in treated compared to control NSCs.
MMP measurements provided additional evidence of oxidative stress induced by SPIONs in NSCs. The observed hyperpolarization of the mitochondrial membrane probably occurred as a result of NSC-defense response against functional disorders caused by SPIONs, which did not affect cell viability. Similar behavior has already been described for neuronal cells in other stress conditions.52,53 It is interesting that our results were opposite to the results described for cell response upon exposure to magnetite NPs,19 where mitochondrial membrane depolarization and increased ROS levels in treated human lung cells were observed. Toxic oxidative stress perturbs mitochondrial function in a number of ways, including MMP disruption. Mitochondrial hyperpolarization is a transient event that precedes the release of apoptogenic factors during apoptosis. It is mainly caused by ATP depletion, subsequent interruption of the proton pumps associated with the electron-transport chain on the inner mitochondrial membrane, and release of ROS in the cytosol.54–61 The MMP is established by the proton pump of the electron-transport chain or mitochondrial respiratory chain,61 and is involved in programmed cell death.56 The dissipation of MMP induced by increased ROS production is a common observation when toxicity leads to cell death by apoptosis, necrosis, or autophagy.56,61,62
The exact pathophysiological role of mitochondrial hyperpolarization has yet to be determined. It is proposed as a step to inhibit apoptosis.63 In the case of neurons, a positive correlation was found between MMP and neuronal survival, ie, neurons having hyperpolarized mitochondrial membranes survive longer.53 In our case, NSCs obviously counteracted the stress upon SPION exposure by engaging different defense systems, and the change in MMP was among them.
To examine disturbance in CMP, the Fivephoton ion-channel MP assay was used. Dissipation of CMP was observed for all SPION types in a dose–response manner. The PLLSPIONs induced the highest and ManSPIONs the lowest increase in ΔE in the cell membrane in treated compared to control NSCs in a dose–response manner. Oxidative stress induces cell-membrane depolarization by disturbing its assembly, which in turn causes changes in membrane fluidity and permeability, alterations of ion transport, and the inhibition of metabolic processes.64 Depolarization of the cell membrane modulates differentiation processes in dividing neural cells,65,66 and the regulation of ROS level seems to be critical for neuronal development.67 As the control of stem cell migration and differentiation is a major concern in stem cell-based therapy, it would be advisable that NP applications for stem cell labeling are free of any unexpected perturbation in CMP and ROS production.
Consistent with previously described findings, the exposure of NSCs to SPIONs was accompanied with a significant increase in DNA damage and production of chain breaks, probably due to the attack of ROS, which caused damage to proteins, membranes, and DNA.68–70 The results of the comet assay demonstrated the genotoxic potential of the SPIONs regardless of their coating, although the extent of the response to particular SPIONs varied. Among the three SPION types tested, ManSPIONs had the lowest genotoxic potential, whereas the most pronounced increase in tail length and tail intensity was observed upon exposure of NSCs to PLLSPIONs.
Although surface coating is expected to prevent the toxic effects of SPIONs, our results showed that all of the tested types of SPIONs affected the NSCs by disturbing the mitochondrial homeostasis, CMP, and DNA integrity. In contrast to other studies showing that uncoated SPIONs have a more deleterious effect on cell behaviour,71,72 there were no significant differences in toxicity end points between the different coatings applied in our study. More interestingly, there was no dose–response relationship for some of the measured parameters, which could be explained by the agglomeration behavior of SPIONs. Agglomeration would be more pronounced at higher concentrations, which in turn decreases effective dose of SPIONs.36
In contrast to studies claiming low cytotoxicity of SPIONs at doses of 100 mg/L or higher,14,73 this study showed that many subtle cellular functions might be impaired but left unobserved when evaluating only rough toxicity end points. We did not observe that the coating of maghemites prevented their toxicity. It is possible that the SPIONs’ aberrant cellular effects may be even stronger when applied in tissues under pathological conditions associated with increased ROS levels. Oxidative stress can be amplified due to the presence of corroded SPIONs, and cause a vicious circle leading to cell death.73 It is plausible to take into account the possibility that SPIONs may be overloaded intracellularly and cause adverse cellular response. Therefore, during the design of novel SPIONs, demands for safety and absence of cellular toxicity should not fall behind labeling efficiency and appropriate magnetism. To prevent toxic side effects, design should be directed toward chemically stable and oxidation-resistant SPIONs.
Conclusion
The SPIONs in murine NSCs were accompanied by oxidative stress caused by an imbalance in the ROS formation and antioxidant cell-defense system. NSCs exposed to SPIONs had depleted intracellular GSH levels, altered activities of SOD and GPx, hyperpolarization of the mitochondrial membrane, dissipated CMP, and DNA damage, irrespective of the surface coating applied for stabilization of SPIONs. This indicated the need for systematic toxicological examination to detect cellular effects of novel bionanomaterials. Given that efficient diagnosis and treatment with SPIONs require sufficient cell uptake, the biocompatibility and biosafety evaluation of SPIONs remains a necessary prerequisite for biomedical application.
Acknowledgments
This work was supported by the GlowBrain project (FP7-REGPOT–2012–CT2012–316120, European Commission) and the Czech Science Foundation (16-01128J). We are grateful to Makso Herman, MA for help in language editing.
Author contributions
IVV and SG designed the project. MB and DH synthesized nanoparticles. IMP, IP, LBA, and MM performed the cell experiments. IMP, MM, and IVV analyzed results. IVV wrote the manuscript draft. All authors contributed to the revision of the manuscript draft. IVV and SG prepared the final manuscript.
Disclosure
The authors report no conflicts of interest in this work.
References
Srinivas M, Aarntzen EH, Bulte JW, et al. Imaging of cellular therapies. Adv Drug Del Rev. 2010;62:1080–1093. | ||
Shubayev VI, Pisanic TR 2nd, Jin S. Magnetic nanoparticles for theragnostics. Adv Drug Deliv Rev. 2009;61:467–477. | ||
Hoehn M, Wiedermann D, Justicia C, et al. Cell tracking using magnetic resonance imaging. J Physiol. 2007;584:25–30. | ||
Küstermann E, Himmelreich U, Kandal K, et al. Efficient stem cell labeling for MRI studies. Contrast Media Mol Imaging. 2008;3:27–37. | ||
Chen J, Rogers SC, Kavdia M. Analysis of kinetics of dihydroethidium fluorescence with superoxide using xanthine oxidase and hypoxanthine assay. Ann Biomed Eng. 2013;41:327–337. | ||
Benetti F, Bregoli L, Olivato I, Sabbioni E. Effects of metal(loid)-based nanomaterials on essential element homeostasis: The central role of nanometallomics for nanotoxicology. Metallomics. 2014;6:729–747. | ||
Novotna B, Jendelova P, Kapcalova M, et al. Oxidative damage to biological macromolecules in human bone marrow mesenchymal stromal cells labeled with various types of iron oxide nanoparticles. Toxicol Lett. 2012;210:53–63. | ||
Singh N, Jenkins GJ, Asadi R, Doak S. Potential toxicity of superparamagnetic iron oxide nanoparticles (SPION). Nano Rev. 2010;1:5358. | ||
Huang DM, Chung TH, Hung Y, et al. Internalization of mesoporous silica nanoparticles induces transient but not sufficient osteogenic signals in human mesenchymal stem cells. Toxicol Appl Pharmacol. 2008;231:208–215. | ||
Nel A, Xia T, Madler L, Li N. Toxic potential of materials at the nanolevel. Science. 2006;311:622–627. | ||
Hohnholt MC, Geppert M, Luther EM, Petters C, Bulcke F, Dringen R. Handling of iron oxide and silver nanoparticles by astrocytes. Neurochem Res. 2013;38:227–239. | ||
Hurd TR, Murphy MP. Biological systems relevant for redox signalling and control. In: Jacob C, Winyard PG, editors. Redox Signalling and Regulation in Biology and Medicine. Weinheim, Germany: Wiley; 2009:13–45. | ||
Wang L, Nagesha DK, Selvarasah S, Dokmeci MR, Carrier RL. Toxicity of CdSe nanoparticles in Caco-2 cell culture. J Nanobiotechnology. 2008;6:11. | ||
Karlsson HL, Gustafsson J, Cronholm P, Möller L. Size-dependent toxicity of metal oxide particles – a comparison between nano- and micrometer size. Toxicol Lett. 2009;188:112–118. | ||
Donaldson K, Poland CA, Schins RP. Possible genotoxic mechanisms of nanoparticles: criteria for improved test strategies. Nanotoxicology. 2010;4:414–420. | ||
Lin WS, Xu Y, Huang CC, et al. Toxicity of nano- and micro-sized ZnO particles in human lung epithelial cells. J Nanopart Res. 2009;11:25–39. | ||
Deng XY, Luan QX, Chen WT, et al. Nanosized zinc oxide particles induce neural stem apoptosis. Nanotechnology. 2009;20:115101. | ||
Yang H, Liu C, Yang DF, Zhang HS, Xi ZG. Comparative study of cytotoxicity, oxidative stress and genotoxicity induced by four typical nanomaterials: the role of particle size, shape and composition. J Appl Toxicol. 2009;29:69–78. | ||
Könczöl M, Ebeling S, Goldenberg E, et al. Cytotoxicity and genotoxicity of size-fractionated iron oxide (magnetite) in A549 human lung epithelial cells: role of ROS, JNK, and NF-κB. Chem Res Toxicol. 2011;24:1460-1475. | ||
Jomova K, Valko M. Advances in metal-induced oxidative stress and human disease. Toxicology. 2011;283:65-87. | ||
Harper S, Usenko C, Hutchison JE, Maddux BL, Tanguay RL. In vivo biodistribution and toxicity depends on nanomaterial composition, size, surface functionalisation and route of exposure. J Exp Nanosci. 2008;3:195–206. | ||
El-Ansary A, Al-Daihan S. On the toxicity of therapeutically used nanoparticles: an overview. J Toxicol. 2009;2009:754810. | ||
Oberdörster G, Oberdörster E, Oberdörster J. Nanotoxicology: an emerging discipline evolving from studies of ultrafine particles. Environ Health Perspect. 2005;113:823–839. | ||
Dusinska M, Dusinska M, Fjellsbø L, et al. Testing strategies for the safety of nanoparticles used in medical applications. Nanomedicine. 2009;4:605–607. | ||
Kroll A, Pillukat MH, Hahn D, Schnekenburger J. Current in vitro methods in nanoparticle risk assessment: limitations and challenges. Eur J Pharm Biopharm. 2009;72:370–377. | ||
Landsiedel R, Kapp MD, Schulz M, Wiench K, Oesch F. Genotoxicity investigations on nanomaterials: methods, preparation and characterization of test material, potential artifacts and limitations – many questions, some answers. Mutat Res. 2009;681:241–258. | ||
Nel A, Xia T, Meng H, et al. Nanomaterial toxicity testing in the 21st century: use of a predictive toxicological approach and high-throughput screening. Acc Chem Res. 2012;46:607–621. | ||
Harris G, Palosaari T, Magdolenova Z, et al. Iron oxide nanoparticle toxicity testing using high-throughput analysis and high-content imaging. Nanotoxicology. 2015;9 Suppl 1:87–94. | ||
George S, Xia T, Rallo R, et al. Use of a high-throughput screening approach coupled with in vivo zebrafish embryo screening to develop hazard ranking for engineered nanomaterials. ACS Nano. 2011;5:1805–1817. | ||
Horak D, Babic M, Jendelová P, et al. D-mannose-modified iron oxide nanoparticles for stem cell labeling. Bioconjug Chem. 2007;18:635–644. | ||
Allen MJ, MacRenaris KW, Venkatasubramanian PN, Meade TJ. Cellular delivery of MRI contrast agents. Chem Biol. 2004;11:301–307. | ||
Zhang Y, Zhang J. Surface modification of monodisperse magnetite nanoparticles for improved intracellular uptake to breast cancer cells. J Colloid Interface Sci. 2005;283:352–357. | ||
Babič M, Horák D, Trchová M, et al. Poly(l-lysine)-modified iron oxide nanoparticles for stem cell labeling. Bioconjug Chem. 2008;19:740–745. | ||
Rueger MA, Muesken S, Walberer M, et al. Effects of minocycline on endogenous neural stem cells after experimental stroke. Neuroscience. 2012;215:174–183. | ||
Horák D, Babič M, Jendelová P, et al. Effect of different magnetic nanoparticle coatings on the efficiency of stem cell labeling. J Magn Magn Mater. 2009;321:1539–1547. | ||
Vinković Vrček I, Pavičić I, Crnković T, et al. Does surface coating of metallic nanoparticles modulate their interferences with in vitro assays? RSC Adv. 2015;5:70787–70807. | ||
Mahmoudi M, Abdelmonem AM, Behzadi S, et al. Temperature: the “ignored” factor at the nanobio interface. ACS Nano. 2013;7:6555–6562. | ||
Griffiths SM, Singh N, Jenkins GJ, et al. Dextran coated ultrafine superparamagnetic iron oxide nanoparticles: compatibility with common fluorometric and colorimetric dyes. Anal Chem. 2011;83:3778–3785. | ||
Kamencic H, Lyon A, Paterson PG, Juurlink BH. Monochlorobimane fluorometric method to measure tissue glutathione. Anal Biochem. 2000;286:35–37. | ||
Chen JC, Zhang X, Singleton TP, Kiechle FL. Mitochondrial membrane potential change induced by Hoechst 33342 in myelogenous leukemia cell line HL-60. Ann Clin Lab Sci. 2004;34:458–466. | ||
Fairless R, Beck A, Kravchenko M, et al. Membrane potential measurements of isolated neurons using a voltage-sensitive dye. PLoS One. 2013;8:e58260. | ||
Huk A, Collins AR, El Yamani N, et al. Critical factors to be considered when testing nanomaterials for genotoxicity with the comet assay. Mutagenesis. 2015;30:85–88. | ||
Collins AR, Dobson VL, Dusinská M, Kennedy G, Stětina R. The comet assay: what can it really tell us? Mutat Res. 1997;375:183–193. | ||
Asharani PV, Mun GL, Hande MP, Valiyaveettil S. Cytotoxicity and genotoxicity of silver nanoparticles in human cells. ACS Nano. 2009;3:279–290. | ||
Lai ZW, Yan Y, Caruso F, Nice EC. Emerging techniques in proteomics for probing nano-bio interactions. ACS Nano. 2012;6:10438–10448. | ||
Sies H. Glutathione and its role in cellular functions. Free Radic Biol Med. 1999;27:916–921. | ||
Xiao GG, Wang M, Li N, Loo JA, Nel AE. Use of proteomics to demonstrate a hierarchical oxidative stress response to diesel exhaust particle chemicals in a macrophage cell line. J Biol Chem. 2003;278:50781–50790. | ||
Ma P, Luo Q, Chen J, et al. Intraperitoneal injection of magnetic Fe3O4-nanoparticle induces hepatic and renal tissue injury via oxidative stress in mice. Int J Nanomedicine. 2012;7:4809–4818. | ||
Wang J, Sun P, Bao Y, Liu J, An L. Cytotoxicity of single-walled carbon nanotubes on PC12 cells. Toxicol in Vitro. 2011;25:242–250. | ||
Bray RC, Cockle SA, Fielden EM, Roberts PB, Rotilio G, Calabrese L. Reduction and inactivation of superoxide dismutase by hydrogen peroxide. Biochem J. 1974;139:43–48. | ||
Lushchak VI. Adaptive response to oxidative stress: bacteria, fungi, plants and animals. Comp Biochem Physiol C Toxicol Pharmacol. 2011;153:175–190. | ||
Krohn AJ, Wahlbrink T, Prehn JH. Mitochondrial depolarization is not required for neuronal apoptosis. J Neurosci. 1999;19:7394–7404. | ||
Ward MW, Huber HJ, Weisová P, Düssmann H, Nicholls DG, Prehn JH. Mitochondrial and plasma membrane potential of cultured cerebellar neurons during glutamate-induced necrosis, apoptosis, and tolerance. J Neurosci. 2007;27:8238–8249. | ||
Sanchez-Alcazar JA, Ault JG, Khodjakov A, Schneider E. Increased mitochondrial cytochrome C levels and mitochondrial hyperpolarization precede camptothecin-induced apoptosis in Jurkat cells. Cell Death Differ. 2000;7:1090–1100. | ||
Zorov DB, Juhaszova M, Sollott SJ. Mitochondrial ROS-induced ROS release: an update and review. Biochim Biophys Acta. 2006;1757:509–517. | ||
Andón FT, Fadeel B. Programmed cell death: molecular mechanisms and implications for safety assessment of nanomaterials. Acc Chem Res. 2013;46:733–742. | ||
Forkink M, Manjeri GR, Liemburg-Apers DC, et al. Mitochondrial hyperpolarization during chronic complex I inhibition is sustained by low activity of complex II, III, IV and V. Biochim Biophys Acta. 2014;1837:1247–1256. | ||
Poburko D, Santo-Domingo J, Demaurex N. Dynamic regulation of the mitochondrial proton gradient during cytosolic calcium elevations. J Biol Chem. 2011;286:11672–11684. | ||
Cao J, Liu Y, Jia L, et al. Curcumin induces apoptosis through mitochondrial hyperpolarization and mtDNA damage in human hepatoma G2 cells. Free Radic Biol Med. 2007;43:968–975. | ||
Gergely P Jr, Niland B, Gonchoroff N, Pullmann R Jr, Phillips PE, Perl A. Persistent mitochondrial hyperpolarization, increased reactive oxygen intermediate production, and cytoplasmic alkalinization characterize altered IL-10 signaling in patients with systemic lupus erythematosus. J Immunol. 2002;169:1092–1101. | ||
Ly JD, Grubb DR, Lawen A. The mitochondrial membrane potential (ΔΨm) in apoptosis. Apoptosis. 2003;8:115–128. | ||
Tait SW, Green DR. Mitochondria and cell death: outer membrane permeabilization and beyond. Nat Rev Mol Cell Biol. 2010;11:621–632. | ||
Liang BC, Miller L, Weller A. Ethyl-nitrosourea transformed astrocytes exhibit mitochondrial membrane hyperpolarization and constrained apoptosis. Apoptosis. 1999;4:89–97. | ||
Nakaya H, Takeda Y, Tohse N, Kanno M. Mechanism of the membrane depolarization induced by oxidative stress in guinea-pig ventricular cells. J Mol Cell Cardiol. 1992;24:523–534. | ||
Stroh A, Tsai HC, Wang LP, et al. Tracking stem cell differentiation in the setting of automated optogenetic stimulation. Stem Cells. 2011;29:78–88. | ||
Xavier JM, Morgado AL, Rodrigues CM, Solá S. Tauroursodeoxycholic acid increases neural stem cell pool and neuronal conversion by regulating mitochondria-cell cycle retrograde signaling. Cell Cycle. 2014;13:3576–3589. | ||
Olguín-Albuerne M, Morán J. ROS produced by NOX2 control in vitro development of cerebellar granule neurons development. ASN Neuro. 2015;7:1–28. | ||
Ott M, Gogvadze V, Orrenius S, Zhivotovsky B. Mitochondria, oxidative stress and cell death. Apoptosis. 2007;12:913–922. | ||
Bhabra G, Sood A, Fisher B, et al. Nanoparticles can cause DNA damage across a cellular barrier. Nat Nanotechnol. 2009;4:876–883. | ||
Sun C, Carpenter C, Pratx G, Xing L. Facile synthesis of amine-functionalized Eu3+-doped La(OH)3 nanophosphors for bioimaging. Nanoscale Res Lett. 2011;6:24–30. | ||
Mahmoudi M, Simchi A, Imani M, Milani AS, Stroeve P. An in vitro study of bare and poly(ethylene glycol)-co-fumarate-coated superparamagnetic iron oxide nanoparticles: a new toxicity identification procedure. Nanotechnology. 2009;20:225104. | ||
Berry CC, Charles S, Wells S, Dalby MJ, Curtis AS. The influence of transferrin stabilised magnetic nanoparticles on human dermal fibroblasts in culture. Int J Pharm. 2004;269:211–225. | ||
Kim JS, Yoon TJ, Yu KN, et al. Toxicity and tissue distribution of magnetic nanoparticles in mice. Toxicol Sci. 2006;89:338–347. |
 © 2016 The Author(s). This work is published and licensed by Dove Medical Press Limited. The
full terms of this license are available at https://www.dovepress.com/terms
and incorporate the Creative Commons Attribution
- Non Commercial (unported, 3.0) License.
By accessing the work you hereby accept the Terms. Non-commercial uses of the work are permitted
without any further permission from Dove Medical Press Limited, provided the work is properly
attributed. For permission for commercial use of this work, please see paragraphs 4.2 and 5 of our Terms.
© 2016 The Author(s). This work is published and licensed by Dove Medical Press Limited. The
full terms of this license are available at https://www.dovepress.com/terms
and incorporate the Creative Commons Attribution
- Non Commercial (unported, 3.0) License.
By accessing the work you hereby accept the Terms. Non-commercial uses of the work are permitted
without any further permission from Dove Medical Press Limited, provided the work is properly
attributed. For permission for commercial use of this work, please see paragraphs 4.2 and 5 of our Terms.