Back to Journals » International Journal of Nanomedicine » Volume 11
Optimizing superparamagnetic iron oxide nanoparticles as drug carriers using an in vitro blood–brain barrier model
Authors Shi D ![]() , Mi G
, Mi G ![]() , Bhattacharya S, Nayar S, Webster TJ
, Bhattacharya S, Nayar S, Webster TJ ![]()
Received 12 March 2016
Accepted for publication 2 July 2016
Published 17 October 2016 Volume 2016:11 Pages 5371—5379
DOI https://doi.org/10.2147/IJN.S108333
Checked for plagiarism Yes
Review by Single anonymous peer review
Peer reviewer comments 2
Editor who approved publication: Professor Carlos Rinaldi
Di Shi,1 Gujie Mi,1 Soumya Bhattacharya,2 Suprabha Nayar,2 Thomas J Webster1,3
1Department of Chemical Engineering, Northeastern University, Boston, MA, USA; 2Materials Science and Technology Division, Council for Scientific and Industrial Research-National Metallurgical Laboratory, Jamshedpur, India; 3Center of Excellence for Advanced Materials Research, King Abdulaziz University, Jeddah, Saudi Arabia
Abstract: In the current study, an optimized in vitro blood–brain barrier (BBB) model was established using mouse brain endothelial cells (b.End3) and astrocytes (C8-D1A). Before measuring the permeability of superparamagnetic iron oxide nanoparticle (SPION) samples, the BBB was first examined and confirmed by an immunofluorescent stain and evaluating the transendothelial electrical resistance. After such confirmation, the permeability of the following five previously synthesized SPIONs was determined using this optimized BBB model: 1) GGB (synthesized using glycine, glutamic acid, and bovine serum albumin [BSA]), 2) GGC (glycine, glutamic acid, and collagen), 3) GGP (glycine, glutamic acid, and polyvinyl alcohol), 4) BPC (BSA, polyethylene glycol, and collagen), and 5) CPB (collagen, polyvinyl alcohol, and BSA). More importantly, after the permeability test, transmission electron microscopy thin section technology was used to investigate the mechanism behind this process. Transmission electron microscopy thin section images supported the hypothesis that collagen-coated CPB SPIONs displayed better cellular uptake than glycine and glutamine acid-coated GGB SPIONs. Such experimental data demonstrated how one can modify SPIONs to better deliver drugs to the brain to treat a wide range of neurological disorders.
Keywords: superparamagnetic iron oxide nanoparticles, blood–brain barrier, permeability
Introduction
Though the discovery of the blood–brain barrier (BBB) can be traced back to more than 100 years ago, it was not until the 1960s when electron microscopes became available in medical research that the role of endothelial cells in the BBB was determined and confirmed.1 Compared to “ordinary” endothelial cells that line blood vessels in the rest of the body, endothelial cells in the brain microvessels exhibit highly extensive tight junctions and, thus, much lower endocytosis or transcytosis activities than peripheral endothelial cells. Tight junctions and adherent junctions are the interconnectors of cerebral endothelial cells.2,3 The presence of these tight barriers on the apical side of cell membranes restricts most water-soluble molecules from crossing the BBB by paracellular aqueous pathways. In addition, on the surface of the endothelial cell membrane, only a few small lipid-soluble agents, such as ethanol, which are smaller than 400 Da and/or are less than eight pairs of hydrogen bonds, and gaseous molecules (such as oxygen and carbon dioxide) can passively diffuse across this regulated interference by transcellular lipophilic pathways.4 Other compounds, including nutrients, are transported by specific transport systems on the membranes.
Due to these highly selective tight cell–cell barriers, more than 98% of hydrophilic agents, including polar drugs, are blocked by the tight junctions. Most of the central nervous system (CNS) drugs penetrate the BBB using either a transcellular lipophilic pathway or one of the transportation routes.5–7 As a result, developing more efficient drug delivery strategies to the CNS remains a concern for current researchers, and one of the promising approaches to deliver pharmaceutical agents to the brain is to use multifunctional magnetic nanoparticles.
Based on evidence showing that small nanoparticles may rapidly cross the BBB, strategies have been developed for designing magnetic nanoparticle-based drug delivery systems to enhance the therapeutic level of drugs to reach the CNS parenchyma and to reduce nanoparticle toxicity in several fields such as magnetic resonance imaging (MRI) imaging. Magnetic nanoparticles, such as superparamagnetic iron oxide nanoparticles (SPIONs), have been extensively studied based on their ability to be controlled by magnetic fields, exhibit superparamagnetism, and locally generate hyperthermia.8–11 Superparamagnetism is a phenomenon that happens when SPIONs are under an external magnetic field. After the magnetic field is removed, they no longer exhibit any residual magnetic interactions. In other words, those SPIONs will present a stronger and faster magnetic response compared to common magnetic iron oxides when subjected to an applied magnetic field.12 This property makes their magnetic susceptibility much larger than that of paramagnets. Also, this superparamagnetic property is size dependent and normally arises when the size of nanoparticles is around 10 nm.13,14 Therefore, SPIONs have been discovered as an excellent contrast agent that can potentially increase image contrast and improve MRI sensitivity and specificity based on their capability to significantly darken in T2-weighted images.15,16
With these properties, SPIONs can thus be used to track brain activity and detect cellular receptors that are presented in numerous brain diseases, such as Alzheimer and Parkinson’s diseases, or use the magnetic field to guide drug-loaded nanoparticles to the active site.17 However, while the use of SPIONs for therapeutic or diagnostic use is very promising, further research is still needed in order to understand what happens to these nanoparticles once they have crossed the BBB. Under normal conditions, magnetic nanoparticles are cleared from the blood by several detoxification and antioxidant mechanisms. But if the SPIONs that cross the BBB are not efficiently cleared, or if their concentration exceeds the maximum amount that can be metabolized by cells of the CNS, the accumulation of these nanoparticles may cause neurodegeneration and may even be harmful for normal brain function in the long-term, even after their sugar or polymer coatings degrade. Hence, generating innovative strategies for facilitating the targeting of nanoparticle agents across the BBB, while developing a reduced toxicity profile for these agents, remains a challenge in the field.18–20 As a result, the objective of the present in vitro study was to investigate the proper modification for SPIONs for nontoxic brain drug delivery by using an optimized BBB model.
Materials and methods
Materials
Five SPION samples were synthesized using polyvinyl alcohol (PVA), glycine, glutamic acid, bovine serum albumin (BSA), collagen, and polyethylene glycol (PEG) based on a patented process “A biomimetic process for the synthesis of aqueous ferrofluids for biomedical applications”. Stability tests were applied at 8,000 rpm for 30 minutes after synthesis and all of the byproducts were then carefully removed by phosphate-buffered saline (PBS) rinses.
For the in vitro BBB model, mouse brain endothelial cells (b.End3, CRL-2299) and astrocytes (C8-D1A, CRL-2541) were purchased from American Type Culture Collection (Manassas, VA, USA). A transendothelial electrical resistance (TEER) device was purchased from World Precision Instruments Inc (Sarasota, FL, USA). A 4′6-diamidino-2-phenylindole nuclear stain and a fluorescein isothiocyanate (FITC)-conjugated anti-ZO1 were purchased from Thermo Fisher Scientific (Waltham, MA, USA). The following items were obtained from Sigma-Aldrich Co. (St Louis, MO, USA): Dulbecco’s Modified Eagle’s Medium (DMEM), fetal bovine serum, poly-D-lysine vented cap flask, 6.5 mm Transwell®-COL collagen-coated 0.4 μm pore polytetrafluoroethylene membrane inserts, corning 24-well plates, black 96-well plate with a clear bottom, Hank’s balanced salt solution, penicillin–streptomycin (P/S), Ferrozine assay kit, FITC-labeled dextran (FITC-dextran), triton X-100, and Dulbecco’s PBS (without CaCl2 and MgCl2).
Material characterization
X-ray diffraction was conducted by X’Pert Powder (PANalytical B.V, Almelo, the Netherlands), and transmission electron microscopy (TEM) images were taken via a JEM-1010 TEM (JEOL, Tokyo, Japan).
Cocultured BBB model
The basic building blocks of the BBB are formed by endothelial cells surrounded by a basal lamina (not shown in Figure 1) and attached by pericytes, astrocytes, and neurons.3 As we can see from Figure 1, the basement membrane of capillaries in the BBB is ensheathed with astrocyte end feet, which is one of a major subtypes of glial cells and plays an important role for providing cellular links to the neurons in the CNS. It is a consensus that all of the components in the BBB are important for its stability and daily function and, in this study, we will focus on two of them, endothelial cells and astrocytes (Figure 2).
 | Figure 1 Cellular components of the blood–brain barrier (cross-sectional view).3 |
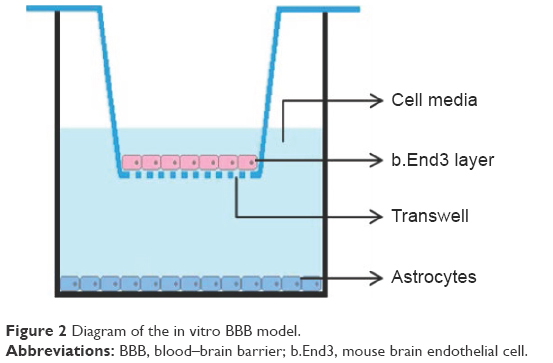 | Figure 2 Diagram of the in vitro BBB model. |
Both b.End3 and C8-D1A were first cultured in complete media (DMEM with 10% fetal bovine serum and 1% P/S) in a flask at 37°C in a humidified incubator with 5% CO2 to reach confluency before being moved to inserts. Next, astrocytes were seeded on the bottom of the 24-well plates at a density of 2×10⁵ cells/cm2. After 24 hours of adhesion, endothelial cells were seeded onto the upper side of the 6.5 mm Transwell®-COL collagen-coated 0.4 μm pore polytetrafluoroethylene membrane inserts at a density of 2×10⁵ cells/cm2 and the inserts were placed in 24-well plates containing astrocytes. The well plates with inserts were incubated, changing medium every day in the outer well until cell confluency was reached. Following the desired confluency, the cell culture medium was replaced with 1:1 DMEM/Ham’s F12 with 1% P/S for the next 96 hours.
FITC-dextran permeability assay
The previously described FITC-dextran assay was used for the current model.21 Briefly, the cells were first transferred from complete medium to Hank’s balanced salt solution. FITC-dextran with a molecular weight of 3 kDa and at a concentration of 10 μg/mL was added to the upper inserts and incubated at 37°C for 2 hours. After 2 hours of incubation, the amount of FITC-dextran flux to the receiving chamber was measured using a fluorescence plate reader (SpectraMAX M3; Molecular Devices, Sunnyvale, CA, USA).
TEER assessment
TEER values were obtained by applying a transendothelial current to the membrane and then testing the membrane potential generated, and finally translating the value into resistance (current, Ohm) multiplied by the area (cm2) of the endothelial monolayer (Ohm·cm2). To optimize the in vitro BBB model, we measured the TEER value for two different BBB models: endothelial cells were cultured with astrocytes on the bottom of the receiving wells and endothelial cells were cultured without astrocytes. All the b.End3 were grown on the inserts and exposed to different culturing conditions for 5 days.
Immunostaining and confocal imaging
Cells seeded on collagen-coated glass cover slips were allowed to grow to reach confluence. Then, the cells were fixed in 4% paraformaldehyde for 10 minutes, permeabilized with 0.1% Triton X-100 for 10 minutes, and blocked with nonspecific antigens with 4% BSA in PBS for at least 1 hour at 4°C. Next, the cells were incubated with FITC-conjugated anti-ZO1 at room temperature for 20 minutes. All of the cells were counterstained with 4′6-diamidino-2-phenylindole for 10 minutes afterward. The cells were then washed with PBS and mounted onto cover slips. Cell staining was finally analyzed with confocal laser scanning microscopy at a 40× oil magnification, and images were processed using ImageJ (National Institutes of Health, Bethesda, MA, USA).
Permeability study
The aforementioned cocultured BBB model was then used to test the permeability of the SPION samples: GGB (ferrofluid synthesized using 0.001% glycine, 0.001% glutamic acid, and 0.01% BSA), GGC (0.001% glycine, 0.001% glutamic acid, and 0.01% collagen), GGP (0.001% glycine, 0.001% glutamic acid, and 0.01% PVA), BPC (0.001% BSA, 0.01% PEG, and 0.01% collagen), and CPB (0.01% collagen, 0.01% PVA, and 0.001% BSA).22,23 Similar to FITC-dextran permeability assay, SPIONs were exposed to the nanoparticles for 2 hours. After 2 hours, the solution was taken from each receiving well and the final iron concentration in the receiving well was measured by a Ferrozine assay kit. Each experiment was conducted in triplicate and differences between mean values were determined using analysis of variance followed by Student’s t-tests.
SPION uptake assay: TEM thin section
TEM was used to visualize the interactions of SPIONs with endothelial cells. For this, the cells that were exposed to SPIONs for 2 hours were fixed with 2.5% glutaraldehyde in 0.1 M sodium cacodylate buffer at a pH of 7.2. Then, the inserts were postfixed with 1.0% osmium tetroxide and rinsed with buffer at a pH of 7.2 after 2 hours. Next, inserts with cells were dehydrated with 30%, 70%, 85%, and 95% ethanol, each for 10–15 minutes, and finally with 100% ethanol for 1 hour. After dehydration, the cells were then infiltrated with 1:1 Spurrs/Quetol resin to 100% ethanol overnight followed by 100% Spurrs/Quetol resin overnight on a mixing turntable. Finally, the inserts were embedded in fresh Spurrs/Quetol resin and were ready for section.
Results and discussion
Material characterization
Results of the present study revealed that the hydrodynamic diameters of the samples ranged from 20 to 200 nm, and the lowest absolute zeta value was 29 mV for BPC and the highest one was 69 mV for GGB (Table 1).21 Previous TEM images also indicated that the iron oxide core ranges from 5–10 nm (Figure 3). Sample X-ray diffraction diffraction peaks matched with iron oxide standard peaks (Figure 4). Using the Scherrer formula, the mean diameter for iron oxide was found to around 8–10 nm, which supported TEM results. According to a publication of one of the coauthors (SB), the presence of different functional groups such as amine (−NH2, −COOH, and −OH) could affect the crystallinity and morphology of the final product.23 However, the iron oxide characteristic peaks of the synthesized SPION samples corresponding to the Bragg planes (220), (311), (400), (422), (511), (440), (620), and (533) remained for all the nanoparticles.
 | Table 1 DLS and zeta potential of five SPION samples |
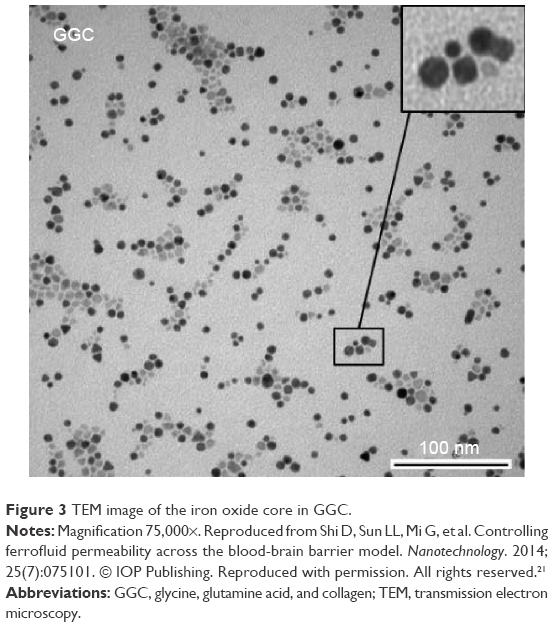 | Figure 3 TEM image of the iron oxide core in GGC. |
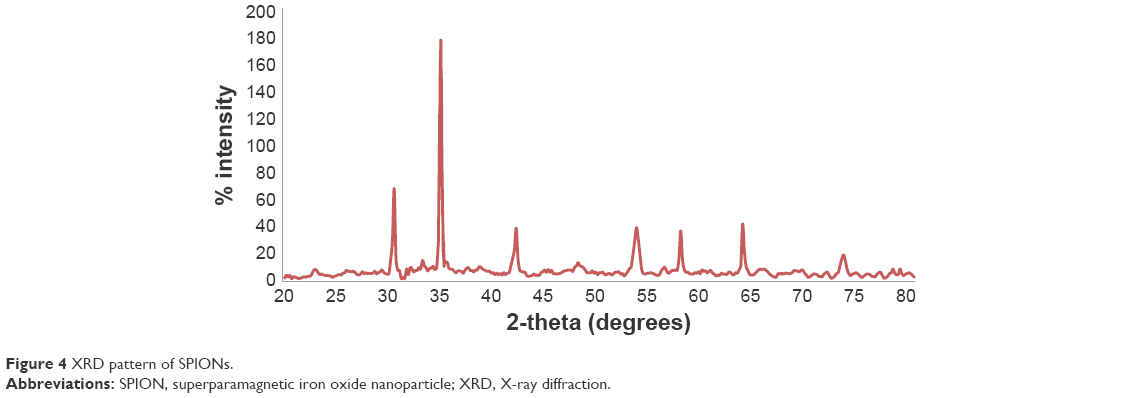 | Figure 4 XRD pattern of SPIONs. |
Effect of astrocyte culture on the in vitro BBB model
FITC-dextran permeability
To assess the effect of astrocytes cocultured in the BBB model, paracellular permeability of 3 kDa FITC dextran was measured for both the endothelial cell-only model and the astrocyte cocultured model on transwell membranes by the following equation:
Permeability = (V/(SA*t))*(CR/CD) |
According to this equation, the volume (V) was 600 μL; the surface area of the insert (SA) was 0.3 cm2; the time (t) was 2 hours; and the concentration of fluid in the donor well (CD) was 10 μg/mL.24–26 As it has been introduced by Bennett et al,25 the decline of permeability with increasing exposure times to serum-free medium indicated the success of the tightening of the blood–barrier model. Results showed that the BBB model with astrocyte cocultures had a permeability of 15% lower than that of the b.End3 monoculture, but this difference was not significant (P>0.1) (Figure 5).21 Therefore, results suggested that both of the BBB models were confirmed yet the cocultured BBB model indicated lower paracellular permeability.
 | Figure 5 Permeability of FITC-dextran across the cocultured BBB model. |
TEER assessments
To assess all of the possibilities, three different culturing conditions were measured. A comparison of endothelial cell monoculture to endothelial cell/astrocyte cocultures indicated that the cocultures tended to have significantly higher TEER values (~120 Ohm.cm2) than monolayers (~105 Ohm·cm2) (Figure 6), which suggested that astrocytes mediated conditions for a tightening effect when compared to endothelial cell monolayers. In addition, higher TEER values were observed in the models with astrocytes cultured on the bottom of the receiving wells, suggesting an optimized culturing condition for the cocultured BBB model. TEER values were measured for 4 days for each model. After 4 days, the TEER value would reach a plateau and the TEER value was stable.
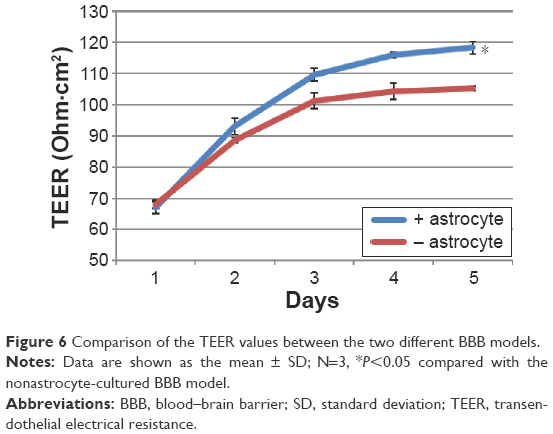 | Figure 6 Comparison of the TEER values between the two different BBB models. |
Immunostaining and confocal imaging
Confocal imaging protocols were administered on the fourth day. The expression of tight junction proteins in the in vitro BBB models was examined by immunostaining. Figure 7 shows images of the tight junction cytoplasmic protein ZO1 expressed in the cell layer. From the images, we can see that the b.End3 formed confluent monolayers on the luminal side of the inserts when cocultured with astrocytes and successfully expressed tight junction proteins.
 | Figure 7 Essential junction proteins expressed by b.End3 when cocultured with astrocytes. |
Permeability and cell uptake study
To test the final iron oxide concentration, iron in the receiving wells was collected and the concentration was measured by an iron assay kit. Basically, iron in the sample was released by the addition of an acidic buffer, then the released iron reacted with a chromagen that would result in a colorimetric (593 nm) product, proportional to the iron presented in the samples. As per the final results shown in Figure 8, the highest permeability resulted from CPB (collagen, PEG, and BSA) and the lowest from GGB (glycine, glutamic acid, and BSA). In addition, to investigate whether the modification of coatings would affect cellular uptake efficiency as well as the general cell uptake mechanism, inserts exposed to SPIONs were fixed and prepared as TEM grids for inspection. As shown in Figure 9A–F, CPB with the highest permeability and GGB with the lowest permeability were chosen. First of all, the images support the hypothesis that SPIONs are taken up by cells, and both of the images indicated that SPIONs were possibly taken up by endosomes. Second, in agreement with the results from the permeability test, cells were inclined to uptake more CPB than GGB, which not only confirmed the aforementioned results but also suggested that the coatings probably facilitated cellular uptake.
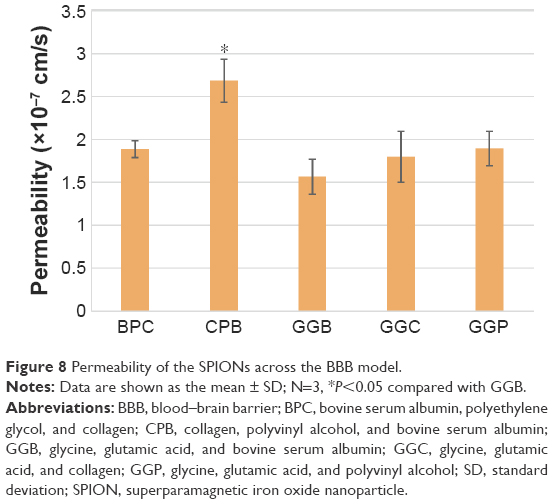 | Figure 8 Permeability of the SPIONs across the BBB model. |
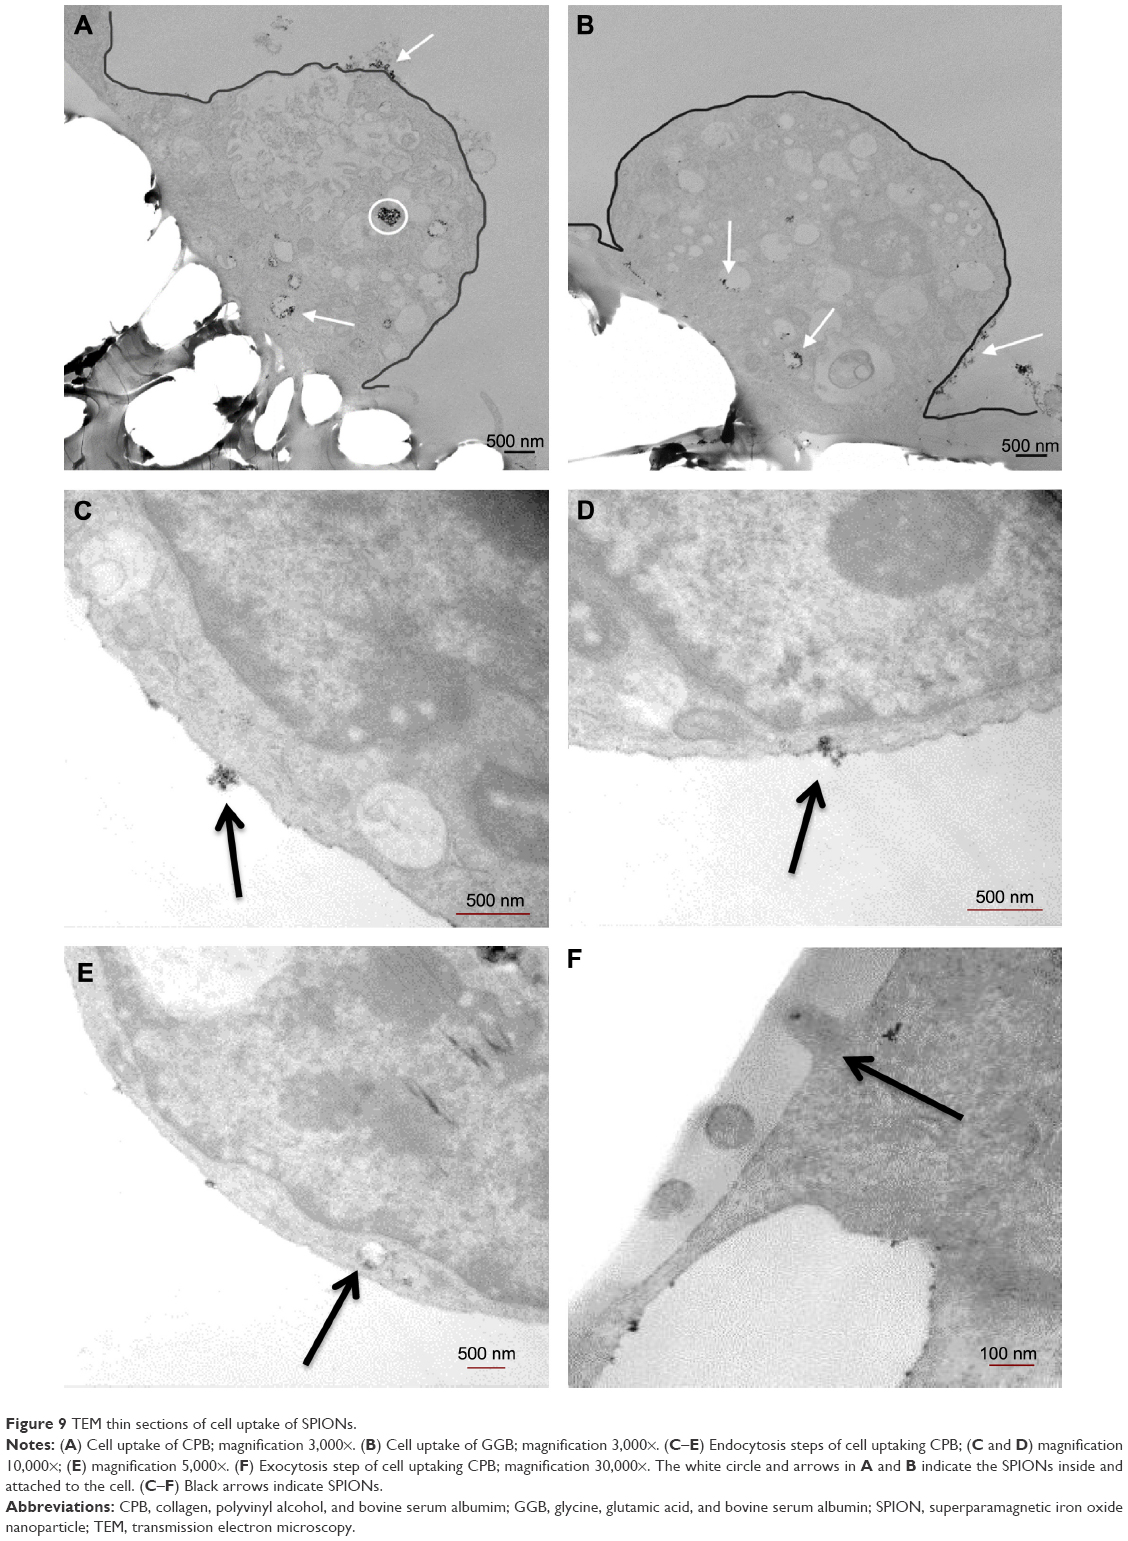 | Figure 9 TEM thin sections of cell uptake of SPIONs. |
To understand whether nanoparticle composition, size, and/or surface potential could be modified in the future studies to regulate their permeability in the in vitro BBB model, a regression study was run between SPIONs’ permeability and their size, and between permeability and their zeta potential (Figures 10 and 11). The four samples were GGB (0.001% glycine, 0.001% glutamic acid, and 0.01% BSA), GGC (0.001% glycine, 0.001% glutamic acid, and 0.01% collagen), GGP (0.001% glycine, 0.001% glutamic acid, and 0.01% PVA), BPC (0.001% BSA, 0.01% PEG, and 0.01% collagen). The only outliner in this experiment was CPB (0.01% collagen, 0.01% PVA, and 0.001% BSA), which showed no correlation with other samples in the regression study and a need to be further investigated. Results agreed with the hypothesis that large particles (eg, GGB for 192 nm) have difficulty passing through the BBB, while smaller nanoparticles like BPC (17 nm) show better permeability. In addition, the correlations suggest that increasing zeta potential (ie, BPC for −28.99 mV) could also be a good way to help nanoparticles to pass across the BBB. Further studies still need to be carried out, as different factors such as surface charge and diameter were changed simultaneously in this study, which make these correlations difficult to define.
 | Figure 10 Permeability of the four SPION samples (GGB, GGC, GGP, and BPC) by hydrodynamic diameter (DLS). |
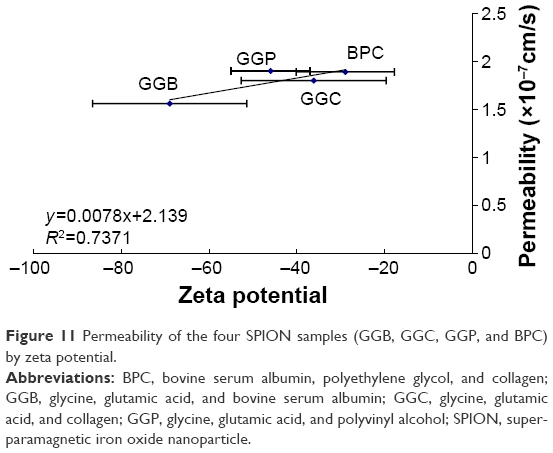 | Figure 11 Permeability of the four SPION samples (GGB, GGC, GGP, and BPC) by zeta potential. |
Cytotoxicity assay
To investigate whether certain amounts of SPIONs had toxic effects on either endothelial cells or astrocytes, MTS assays were used to assess the cytotoxicity of these samples. Results showed greater viability in the presence of SPION samples (Figure 12) and indicated that even with iron oxide concentrations up to 500 μg/mL, SPIONs with bioactive coatings had a similar cell viability compared with controls.
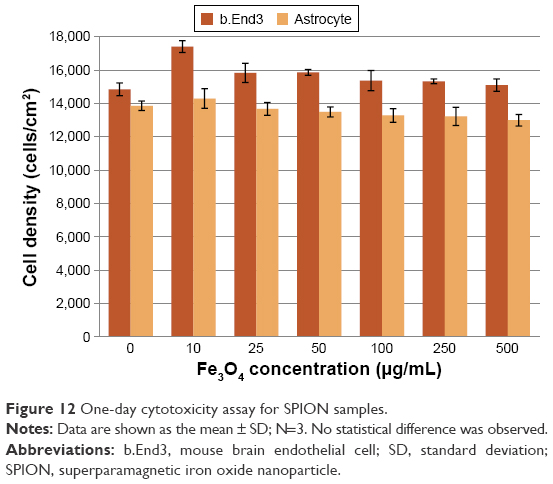 | Figure 12 One-day cytotoxicity assay for SPION samples. |
Conclusion
An in vitro model of the BBB was established by coculturing b.End3 with C8-D1A astrocytes. Measuring FITC-dextran permeability, TEER, and conducting immunostaining procedures confirmed this in vitro BBB model. Data showed that astrocytes played an important role in the in vitro barrier formation and facilitated the formation of tight junctions. With this successfully established BBB model, the permeability of the five SPION samples was examined. The current results suggest a possibility to manipulate SPION penetration across the BBB by creating bioactive coatings. Such data not only lay the foundation for the modification of SPIONs, but also highlight their promising biomedical use, in particular with collagen as well as glycine and glutamine acid as coatings. For instance, as SPIONs with collagen coatings increased BBB passage, they can be used for neural drug delivery applications. On the other hand, SPIONs with glycine and glutamine coatings can be used for whole-body MRI or to minimize neural neurotoxicity because of their limited BBB passage. Thus, results from this study provided significant evidence that a combination of bioactive ligands used during the in situ synthesis of SPIONs determines whether they can cross the BBB.
Acknowledgments
The authors would like to thank Northeastern University for funding this research. SB would like to thank Council of Scientific and Industrial Research (CSIR), Government of India, for providing financial support in the form of Senior Research Fellowship.
Disclosure
The authors report no conflicts of interest in this work.
References
Davson H. History of the blood-brain barrier concept. In: Neuwelt EA, editor. Implications of the Blood-Brain Barrier and Its Manipulation. Vol 1. New York: Plenum Press; 1989:27–52. | ||
Banks WA. Physiology and pathology of the blood-brain barrier: implications for microbial pathogenesis, drug delivery and neurodegenerative disorders. J Neurovirol. 1999;5(6):538–555. | ||
Hawkins BT, Davis TP. The blood-brain barrier/neurovascular unit in health and disease. Pharmacol Rev. 2005;57(2):173–185. | ||
Pardridge WM. The blood-brain barrier: bottleneck in brain drug development. NeuroRx. 2005;2(1):3–14. | ||
Ballabh P, Braun A, Nedergaard M. The blood-brain barrier: an overview: structure, regulation, and clinical implications. Neurobiol Dis. 2004;16(1):1–13. | ||
Pardridge WM. Blood-brain barrier delivery. Drug Discov Today. 2007;12(1–2):54–61. | ||
Abbott NJ, Rönnbäck L, Hansson E. Astrocyte-endothelial interactions at the blood-brain barrier. Nat Rev Neurosci. 2006;7(1):41–53. | ||
Kong SD, Lee J, Ramachandran S, et al. Magnetic targeting of nanoparticles across the intact blood-brain barrier. J Control Release. 2012;164(1):49–57. | ||
Hamilton RD, Foss AJ, Leach L. Establishment of a human in vitro model of the outer blood-retinal barrier. J Anat. 2007;211(6):707–716. | ||
Neuwelt EA, Bauer B, Fahlke C, et al. Engaging neuroscience to advance translational research in brain barrier biology. Nat Rev Neurosci. 2011;12(3):169–182. | ||
Shubayev VI, Pisanic TR, Jin S. Magnetic nanoparticles for theragnostics. Adv Drug Deliv Rev. 2009;61(6):467–477. | ||
Wahajuddin M, Arora S. Superparamagnetic iron oxide nanoparticles: magnetic nanoplatforms as drug carriers. Int J Nanomedicine. 2012;7:3445–3471. | ||
Dave SR, Gao X. Monodisperse magnetic nanoparticles for biodetection, imaging, and drug delivery: a versatile and evolving technology. Wiley Interdiscip Rev Nanomed Nanobiotechnol. 2009;1(6):583–609. | ||
Kodama RH. Magnetic nanoparticles. J Magn Magn Mater. 1999;200(1–3):359–372. | ||
Plank C, Zelphati O, Mykhaylyk O. Magnetically enhanced nucleic acid delivery. Ten years of magnetofection-progress and prospects. Adv Drug Deliv Rev. 2011;63(14–15):1300–1333. | ||
Iannetti GD, Wise RG. BOLD functional MRI in disease and pharmacological studies: room for improvement? Magn Reson Imaging. 2007;25(6):978–988. | ||
Iadecola C. Neurovascular regulation in the normal brain and in Alzheimer’s disease. Nat Rev Neurosci. 2004;5(5):347–360. | ||
Oberdörster G, Sharp Z, Atudorei V, et al. Translocation of inhaled ultrafine particles to the brain. Inhal Toxicol. 2004;16(6–7):437–445. | ||
Kleinman MT, Araujo JA, Nel A, et al. Inhaled ultrafine particulate matter affects CNS inflammatory processes and may act via MAP kinase signaling pathways. Toxicol Lett. 2008;178(2):127–130. | ||
Logothetis NK, Pauls J, Augath M, et al. Neurophysiological investigation of the basis of the fMRI signal. Nature. 2001;412(6843):150–157. | ||
Shi D, Sun LL, Mi G, et al. Controlling ferrofluid permeability across the blood-brain barrier model. Nanotechnology. 2014;25(7):075101. | ||
Nayar S, Sinha A, Pramanick AK, inventors. A biomimetic process for the synthesis of aqueous ferrofluids for biomedical applications. Indian patent number 0672DEL2010. March 22, 2010. | ||
Bhattacharya S, Sheikh L, Tiwari V, et al. Protein-polymer functionalized aqueous ferrofluids showing high T2 relaxivity. J Biomed Nanotechnol. 2014;10(5):811–819. | ||
Hoff D, Sheikh L, Bhattacharya S, Nayar S, Webster TJ. Comparison study of ferrofluid and powder iron oxide nanoparticle permeability across the blood-brain barrier. Int J Nanomedicine. 2013;8:703–710. | ||
Bennett J, Basivireddy J, Kollar A, et al. Blood-brain barrier disruption and enhanced vascular permeability in the multiple sclerosis model EAE. J Neuroimmunol. 2010;229(1–2):180–191. | ||
Brown RC, Morris AP, O’Neil RG. Tight junction protein expression and barrier properties of immortalized mouse brain microvessel endothelial cells. Brain Res. 2007;1130(1):17–30. |
 © 2016 The Author(s). This work is published and licensed by Dove Medical Press Limited. The
full terms of this license are available at https://www.dovepress.com/terms
and incorporate the Creative Commons Attribution
- Non Commercial (unported, 3.0) License.
By accessing the work you hereby accept the Terms. Non-commercial uses of the work are permitted
without any further permission from Dove Medical Press Limited, provided the work is properly
attributed. For permission for commercial use of this work, please see paragraphs 4.2 and 5 of our Terms.
© 2016 The Author(s). This work is published and licensed by Dove Medical Press Limited. The
full terms of this license are available at https://www.dovepress.com/terms
and incorporate the Creative Commons Attribution
- Non Commercial (unported, 3.0) License.
By accessing the work you hereby accept the Terms. Non-commercial uses of the work are permitted
without any further permission from Dove Medical Press Limited, provided the work is properly
attributed. For permission for commercial use of this work, please see paragraphs 4.2 and 5 of our Terms.