Back to Journals » International Journal of Nanomedicine » Volume 11
Optimization, formulation, and characterization of multiflavonoids-loaded flavanosome by bulk or sequential technique
Authors Karthivashan G, Masarudin MJ, Umar Kura A ![]() , Abas F, Fakurazi S
, Abas F, Fakurazi S
Received 4 May 2016
Accepted for publication 25 May 2016
Published 27 July 2016 Volume 2016:11 Pages 3417—3434
DOI https://doi.org/10.2147/IJN.S112045
Checked for plagiarism Yes
Review by Single anonymous peer review
Peer reviewer comments 2
Editor who approved publication: Dr Thomas Webster
Govindarajan Karthivashan,1 Mas Jaffri Masarudin,2 Aminu Umar Kura,1 Faridah Abas,3,4 Sharida Fakurazi1,5
1Laboratory of Vaccines and Immunotherapeutics, Institute of Bioscience, 2Department of Cell and Molecular Biology, Faculty of Biotechnology and Biomolecular Sciences, 3Department of Food Science, Faculty of Food Science and Technology, 4Laboratory of Natural Products, Institute of Bioscience, 5Department of Human Anatomy, Faculty of Medicine and Health Sciences, Universiti Putra Malaysia, Serdang, Selangor, Malaysia
Abstract: This study involves adaptation of bulk or sequential technique to load multiple flavonoids in a single phytosome, which can be termed as “flavonosome”. Three widely established and therapeutically valuable flavonoids, such as quercetin (Q), kaempferol (K), and apigenin (A), were quantified in the ethyl acetate fraction of Moringa oleifera leaves extract and were commercially obtained and incorporated in a single flavonosome (QKA–phosphatidylcholine) through four different methods of synthesis – bulk (M1) and serialized (M2) co-sonication and bulk (M3) and sequential (M4) co-loading. The study also established an optimal formulation method based on screening the synthesized flavonosomes with respect to their size, charge, polydispersity index, morphology, drug–carrier interaction, antioxidant potential through in vitro 1,1-diphenyl-2-picrylhydrazyl kinetics, and cytotoxicity evaluation against human hepatoma cell line (HepaRG). Furthermore, entrapment and loading efficiency of flavonoids in the optimal flavonosome have been identified. Among the four synthesis methods, sequential loading technique has been optimized as the best method for the synthesis of QKA–phosphatidylcholine flavonosome, which revealed an average diameter of 375.93±33.61 nm, with a zeta potential of -39.07±3.55 mV, and the entrapment efficiency was >98% for all the flavonoids, whereas the drug-loading capacity of Q, K, and A was 31.63%±0.17%, 34.51%±2.07%, and 31.79%±0.01%, respectively. The in vitro 1,1-diphenyl-2-picrylhydrazyl kinetics of the flavonoids indirectly depicts the release kinetic behavior of the flavonoids from the carrier. The QKA-loaded flavonosome had no indication of toxicity toward human hepatoma cell line as shown by the 3-(4,5-dimethylthiazol-2-yl)-2,5-diphenyltetrazolium bromide result, wherein even at the higher concentration of 200 µg/mL, the flavonosomes exert >85% of cell viability. These results suggest that sequential loading technique may be a promising nanodrug delivery system for loading multiflavonoids in a single entity with sustained activity as an antioxidant, hepatoprotective, and hepatosupplement candidate.
Keywords: quercetin, kaempferol, apigenin, phytosome, antioxidant, HepaRG cell line
Introduction
For centuries, plant-derived compounds have been evaluated against various clinical conditions and revealed many promising results, thus retaining an influence over numerous clinical/pharmaceutical industries.1 The foremost reasons for their success in medicinal field are their enhanced efficacy, less toxic profile, and minimal side effects compared to conventional synthetic drugs.2 Recently, secondary metabolites such as flavonoids and phenolic compounds from various medicinal plants were under the limelight due to their remarkable pharmaceutical properties against a wide range of clinical conditions with minimal side effects. Flavonoids were reported to possess strong antioxidant activity and other potential pharmacological properties including anti-inflammatory, anticancer, antidiabetic, hepatoprotective, and so on.3 Though numerous plants naturally contain a wide array of flavonoids and antioxidants, Moringa oleifera Lam (MO) leaves were lately claimed to possess the highest antioxidant content among various natural food sources based on oxygen radical absorbent capacity assay by the National Institute of Health.4 Our research team has categorized and reported the bioactive candidates responsible for its elevated antioxidant activity as quercetin (Q), kaempferol (K), and apigenin (A) using high-performance liquid chromatography (HPLC)–diode array detector–electrospray ionization–tandem mass spectrometry (MS/MS).4 Q is the most common bioactive phytoflavonoid and is frequently found in berries, nuts, barks, flowers, tea, vegetables, and leaves.5,6 Being a robust antioxidant, it acts against an extensive range of clinical conditions such as diabetes, cancer, inflammation, ulcer, and microbial activities.7 Subsequently, the molecular mechanism of action of this flavonoid against these clinical conditions has been highly scrutinized and extensively characterized. Q curbs type 2 diabetes mellitus by inducing glucose metabolism via activation of adenosine monophosphate-activated protein kinase in both liver and skeletal muscle.8 It also targets the highly proclaimed proinflammatory signaling pathways, that is, signal transducer and activator of transcription-1, nuclear factor kappa of activated B-cells (NF-κB), and mitogen-activated protein kinases, and thereby inhibits the reactive oxygen species/reactive nitrogen species-mediated inflammatory response.9 Q induces apoptosis in prostate cancer cells by downregulating Hsp90 protein expression (heat shock protein 90) and irreversible cell growth inhibition by arresting the cell cycle in phase S for squamata cells. It also induces cell cycle arrest for HepG2 and breast cancer cell by stimulating p21 and p53 protein expression. Thus, Q plays the anticancer role by either arresting the cell cycle or inducing apoptosis to the cancer cells.10 K is also a well-known polyphenol antioxidant found in fruits and vegetables. It is well documented for its antidiabetic, antiosteoporotic, cardioprotective, and neuroprotective activities and more extensively toward anti-inflammatory and anticancer potential.11 Numerous preclinical studies have established the molecular mechanism of action of K as a potential anti-inflammatory agent. It restricts the tumor necrosis factor alpha-mediated NF-κB activation, p38, c-Jun N-terminal kinases (JNK), and protein kinase B (AKT) phosphorylation via suppression of advanced glycation end products-induced nicotinamide adenine dinucleotide phosphate oxidase in both in vitro and in vivo studies.12,13 Furthermore, K also acts as a potential anticancer agent by modulation of mitogen-activated protein kinases/extracellular signal-regulated kinases (ERK) and phosphoinositide 3-kinase/AKT pathways that represent major signaling routes implicated in cancer development. K plays a highly discriminative role over normal and malignant cells, whereby it induces apoptosis in cancer cells only, while leaving healthy cells unaffected.13–15 A is a notable flavone, highly present in several dietary plants such as parsley, celery, onions, lemon balm, and oranges.16 Comprehensive study reports revealed its potential antioxidant, anti-inflammatory, and anticarcinogenic properties, apparently through its interactions with the signaling molecules in the three major biopathways, that is, ERK, JNK, and p38 in both in vitro and in vivo models.16–18 Recently, our research team reported the presence of these three flavonoids (Q, K, A) from the crude extract of MO leaves. Apparently, they are responsible for its antioxidant4 and hepatoprotective activity against APAP challenged mice model via suppression of cytochromes P450 isoenzymes, regulation of nuclear factor erythroid 2-related factor 2/antioxidant response element system-mediated elevation of antioxidant enzymes, and modulation of inflammatory cytokines.19 Despite their extensive pharmacological properties, these flavonoids show poor water solubility, inadequate permeability, and limited bioavailability due to rapid first past metabolism before entering the systemic circulation, thereby limiting their extensive potential in clinical applications.20,21 In this study, we obtained four solvent fractions using n-hexane, chloroform, ethyl acetate (EA), and n-butanol from the crude MO leaves extract via solvent fractionation technique followed by bioassay-guided compound identification and quantification of the attributed flavonoids. In addition, to enhance bioavailability, to ensure sustained release, and to retain their synergistic outcome, these Q–K–A flavonoids have been successfully loaded in a single phytosomal (can be termed as “flavanosome”) entity. Furthermore, their physicochemical characterization, in vitro antioxidant kinetics, and cytotoxic nature toward human hepatoma cell line (HepaRG) have been evaluated.
Materials and methods
Chemicals
Soybean-derived L-alpha-phosphatidylcholine (PC – purity grade ≥97%), A (purity ≥97%), Q (purity ≥95%), K (purity ≥90%), 1,1-diphenyl-2-picrylhydrazyl (DPPH), n-(1-naphthyl)ethylenediamine dihydrochloride, ammonium molybdate tetrahydrate, insulin from bovine pancreas, and 3-(4,5-dimethylthiazol-2-yl)-2,5-diphenyltetrazolium bromide (MTT) were obtained from Sigma-Aldrich Co. (St Louis, MO, USA). Sodium nitroprusside was purchased from Fluka Chemie AG (Buchs, St Gallen, Switzerland) and sulfanilamide from Friendemann Schmidt (CT Parkwood, Western Australia, Australia). William’s E medium (without phenol red and glutamine) and Glutamax I were purchased from Thermo Fisher Scientific (Waltham, MA, USA). Fetal bovine serum, penicillin-streptomycin, and trypsin were obtained from Nacalai Tesque, Inc. (Kyoto, Japan). Ascorbic acid (AA), hydrocortisone hemisuccinate, and Triton X-100 were obtained from Kollin Chemicals (Malaysia), Santa Cruz Biotechnology Inc. (Dallas, TX, USA), and Alfa Aesar (Heysham, Lancashire, UK), respectively. Dichloromethane (DCM), tetrahydrofuran, dimethylsulfoxide (DMSO), hexane, chloroform, EA, and n-butanol were obtained from EMSURE® (Darmstadt, Germany). All chemical reagents were of analytical grade unless otherwise stated; extraction solvents were of HPLC/LC–MS grade, purchased from EMD Millipore (Billerica, MA, USA).
Plant leaves collection
Fresh and mature MO leaves were harvested from Garden-2, Universiti Putra Malaysia, and have been confirmed with the voucher specimen (SK 1561/08), which has been deposited at IBS Herbarium unit. The collected plant leaves were washed in running tap water, air-dried at room temperature (24°C) for a day, and oven dried for 2 consecutive days at 45°C. The dried leaf materials were grounded using a motorized blender and stored in an airtight container for further process.19
Leaves extract and fractionation design
The powdered MO leaves were macerated profoundly with 90% ethanol in aspirator bottle for 3 consecutive days at room temperature with continuous shaking. The residual extracts were filtered through Whatman filter paper (No 2), and the filtrate was concentrated with a rotary vacuum evaporator at 40°C to obtain dark green slurry residue, which were further freeze-dried, weighed, and stored in capped container with appropriate labeling at −20°C. The freeze-dried extract was dissolved in 300 mL of water, and 300 mL of hexane was added in a separating funnel. The mixture was then partitioned into hexane and aqueous layer. After separation of the hexane layer, 300 mL of chloroform was added to the aqueous layer and partitioned, and the chloroform layer was separated. Using the same procedure, EA and n-butanol fractions were separated. The obtained fractions were concentrated with a rotary vacuum evaporator at 40°C, further freeze-dried, weighed, and stored in capped container with appropriate labeling at −20°C.19,22
Bioassay-guided compound identification and quantification
The DPPH radical scavenging activity, nitric oxide (NO) radical scavenging activity, phosphomolybdenum (PMO) total antioxidant capacity of antioxidant assays were determined according to the method adapted by Karthivashan et al.4
DPPH radical scavenging activity
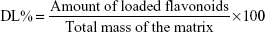
DPPH radical scavenging activity of four MO solvent fractions was determined. Briefly, 150 μL of freeze-dried fraction was added to 50 μL of DPPH solution (0.1 mM in methanol) and kept for 30 minutes at room temperature, and their absorbance was measured at 540 nm. The blank solution consists of 150 μL of methanol and 50 μL of DPPH (control). AA was used as the standard. Results were expressed as a percentage DPPH radical scavenging activity of the fraction and were calculated according to the following equation:
| (1) |
The 50% inhibitory concentration (IC50) values of the extract and standard were determined by plotting radical scavenging activity (%) versus various concentrations of standard/fraction, and all analysis were performed in triplicates and their average is reported.
NO radical scavenging activity
NO radical scavenging activity of the four solvent MO fractions was determined. In brief, the reaction mixture (6 mL) containing sodium nitroprusside (10 mM, 4 mL), phosphate-buffered saline (pH 7.4, 1 mL), and fraction in methanol at various concentrations or standard was incubated at 25°C for 150 minutes. After incubation, 0.5 mL of the reaction mixture containing nitrite ion was removed, 1 mL of sulfanilic acid reagent was added, mixed well, and allowed to stand for 5 minutes for completion of diazotization. Then, 1 mL of n-(1-naphthyl)ethylenediamine dihydrochloride was added, mixed, and allowed to stand for 30 minutes in diffused light. The blank solution was performed by replacing fraction with methanol. The absorbance of these solutions was measured at 540 nm.
PMO total antioxidant capacity
The total antioxidant capacity of various solvent fractions was determined using PMO assay. In brief, to a known aliquot of the fraction dissolved in methanol (0.4 mL) taken in a vial, 4 mL of the reagent solution (0.6 M sulfuric acid, 28 mM sodium phosphate, and 4 mM ammonium molybdate) was added and hatched in a water bath at 95°C for 90 minutes. After cooling the mixture to room temperature, absorbance was measured at 630 nm. The blank solution contained 4 mL of reagent solution and 0.4 mL of methanol; the control solution consisted of 4 mL of reagent and 0.4 mL of various concentrations of AA (50–300 μg/mL). The control and blank solution underwent the same procedure as of sample solution. A calibration curve was prepared using standard solution of AA, and the antioxidant activity was expressed as micrograms of AA equivalent antioxidant capacity per gram of extract.
HPLC – flavonoids determination and quantification
Stock solutions: Individual stock solutions of three standard flavonoids and best fraction of MO were prepared by dissolving 0.5 g of Q, K, A, and MO fraction with 1 mL of methanol. The standard solution for HPLC analysis was prepared by diluting corresponding stock solution. The three standard flavonoids were prepared in various concentrations (100 μg/mL, 75 μg/mL, 50 μg/mL, 25 μg/mL, and 10 μg/mL) by diluting the standard flavonoid stock solution. All reagents and solutions were stored at 4°C prior to use.
Instrumental conditions: Determination of flavonoid aglycones, MO fraction, and various concentrations of diluted standard flavonoid solutions were achieved by an Agilent 1100 HPLC series equipped with binary pump, array detector (diode array detector) (200–600 nm range; 5 nm bandwidth), and auto sampler. The chromatographic separation of flavonoids was achieved through the prepacked LUNA C18 (4×250 mm, 5 μm, Phenomenex) column with gradient elution using a binary mobile phase (phase A: distilled water and phase B: 70:30 [v/v] methanol:distilled water). The gradient elution program was as follows: 0–5 minutes, 100:0 (A:B); 5–10 minutes, 70:30; 10–15 minutes, 50:50; 15–20 minutes, 30:70; and 20–30 minutes, 0:100. Injection volume is set to 20 μL at a flow rate of 1.0 mL/min, and the column temperature was set at 30°C. The appropriate wavelength was selected after scanning. Before injection of the next samples, the column was equilibrated with mobile phase B for 10 minutes.
Analytical validation: The method was validated for linearity and precision. Based on the optimum HPLC conditions with an injection volume of 20 μL, the peak areas of three standard flavonoids (Q, K, A) at each concentration level were obtained. Linear regression equations were obtained by establishing calibration graph with the peak area (y-axis) versus the flavonoid concentration (x-axis). To examine the precision and accuracy, a standard solution inclusive of three flavonoids was injected into the HPLC system, and the procedure was repeated four times. The identification of flavonoid aglycones in the elite MO fraction was carried out by comparing the retention time with standard flavonoids. The amount of flavonoid aglycones in the elite MO fraction was quantified based on the regression equation.
Flavonosomes – formulation design and methodology
The phytosomes incorporated with individual flavonoids were synthesized using a conventional method adapted by Hou et al25 with slight modification. The concentration of flavonoids loaded in phytosome/flavonosome was adjusted approximately equivalent to the content as in EA fraction. The general schema of the synthesis is shown in Figure 1A. In general, flavonoids and soy-derived PC were dissolved in DCM, 1:2 as milligram ratio in a 50 mL round bottomed flask and sonicated at 40°C for 30 minutes. The mixture was refluxed for 2 hours at 40°C using a Buchi-RII rotary evaporator (BUCHI Labortechnik AG, Flawil, Switzerland) equipped with a vacuum pump to obtain a thin film mesh formation of flavonoids and PC complex. The thin film was then dissolved using 10 mL of DCM and added dropwise into 40 mL of distilled water under moderate magnetic stirring at room temperature overnight. Consequently, the DCM phase steadily gets evaporated with stirring overnight, resulting in the formation of flavonoid-loaded phytosomes. The same method was adapted to synthesize individual Q-phytosome, K-phytosome, and A-phytosome as represented in Figure 1B1–B3. To load multiple flavonoids in a single phytosome (termed as “flavonosomes”), we adapted four various formulation methods based on the principles of previous reports23,24 such as bulk co-sonication (M1), serialized co-sonication (M2), bulk co-loading (M3), and sequential co-loading (M4) as illustrated in Figure 2. In terms of co-sonication, the synthesized individual phytosomes were utilized. During bulk co-sonication (M1), the three individual phytosomes were mixed together and sonicated for 2 hours to obtain the resulting M1 flavonosomes (Figure 2A1), whereas in serialized co-sonication, stepwise addition of phytosome is involved such as sonication of Q- and K-phytosomes initially for 2 hours followed by addition and sonication of A-phytosome to the Q–K mixture for another 2 hours to obtain the resulting M2 flavonosomes (Figure 2A2). In terms of bulk co-loading, the three individual flavonoids and PC have been combined together prior to generating thin film layer in milligram ratio at 0.5:2:0.5:6 (Q:K:A:PC), and the same conventional protocol for phytosome has been adapted to obtain the resulting M3 flavonosomes (Figure 2B1), whereas in sequential co-loading, stepwise addition of flavonoids prior to generating thin film layer is involved such as initial addition of Q and K with PC as the milligram ratio at 0.5:2:6 (Q:K:PC) followed by addition of A at 0.5:2:0.5:6 (Q:K:A:PC), to achieve the thin film formulation, and then the conventional protocol for phytosome was used to obtain the resulting M4 flavonosomes (Figure 2B2).
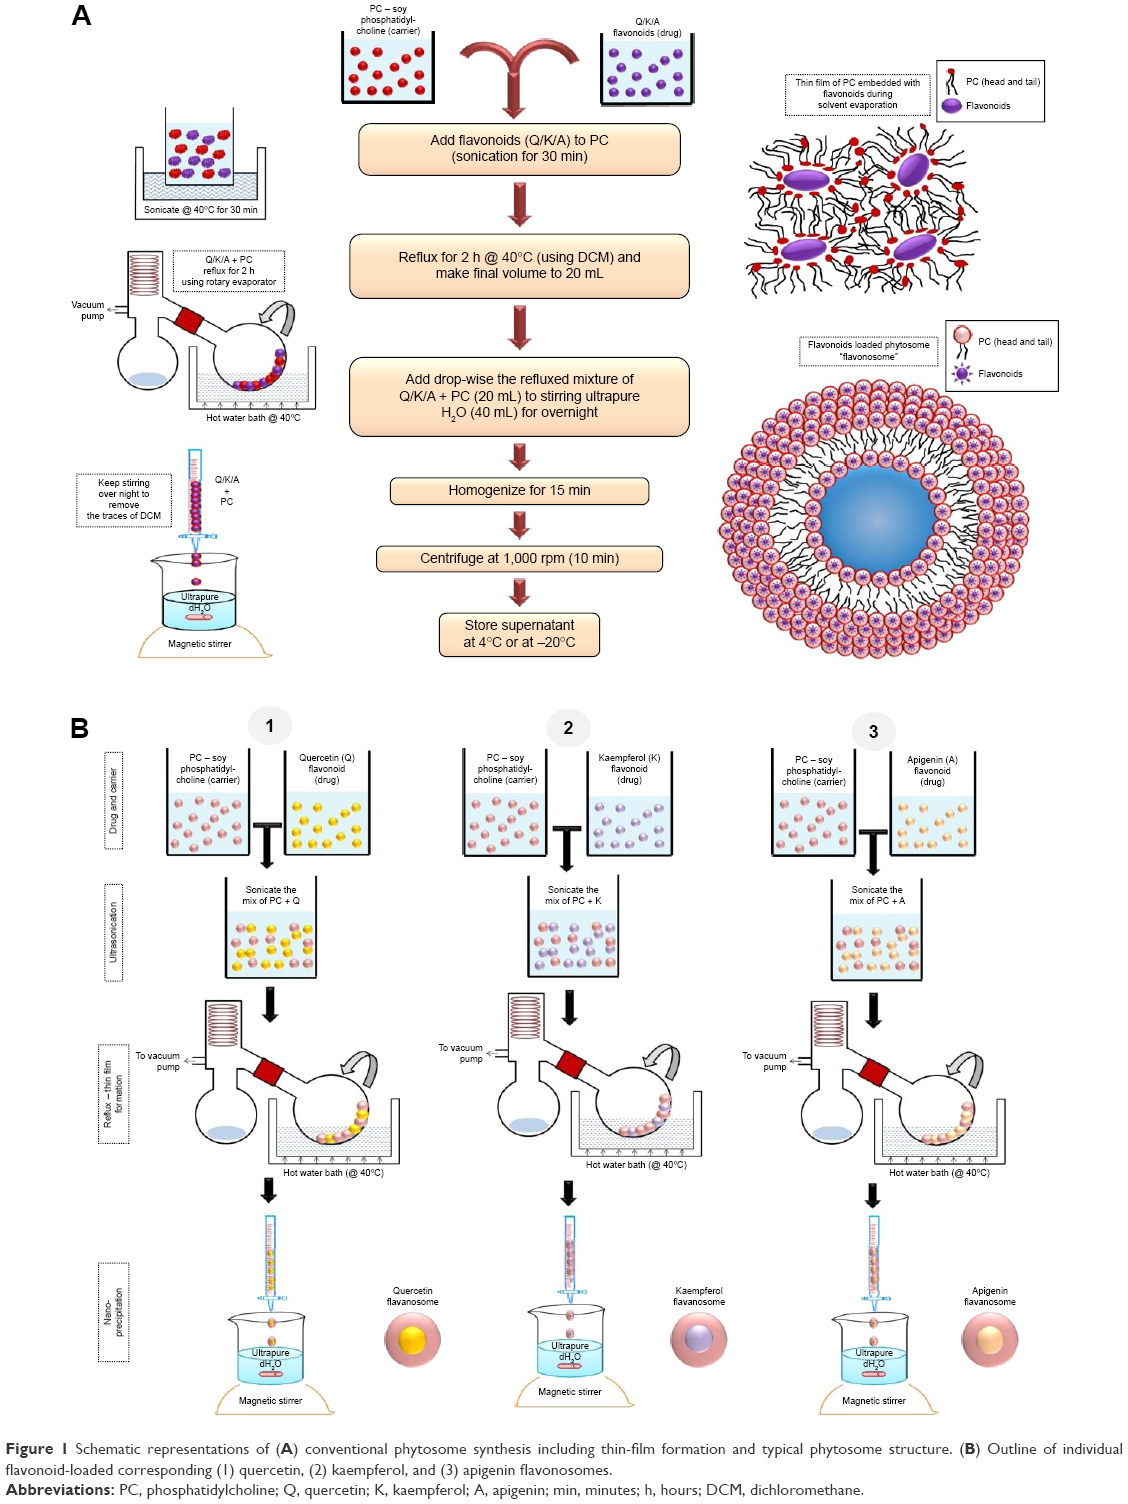 | Figure 1 Schematic representations of (A) conventional phytosome synthesis including thin-film formation and typical phytosome structure. (B) Outline of individual flavonoid-loaded corresponding (1) quercetin, (2) kaempferol, and (3) apigenin flavonosomes. |
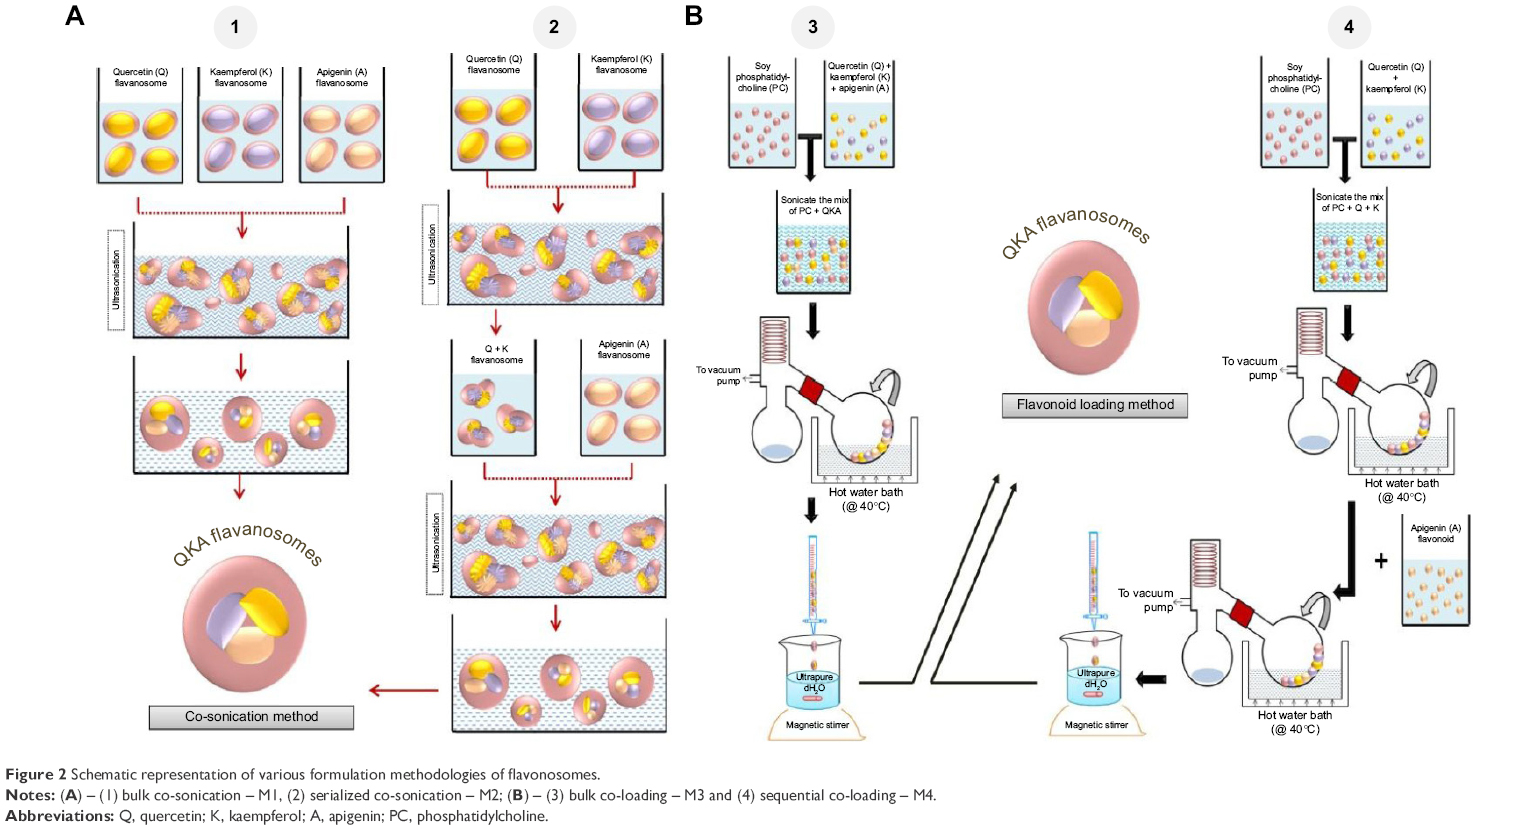 | Figure 2 Schematic representation of various formulation methodologies of flavonosomes. |
Characterization and comparative evaluation of formulated flavonosomes
Morphology
The morphology of the empty carrier (PC), individual flavonoids (Q, K, A), individual phytosomes, and flavonosomes was observed by transmission electron microscopy (TEM) using a Hitachi H-7100 microscope by placing a drop of the diluted dispersion on a copper grid. A thin film of the sample dispersion was obtained by removing excess solution using a filter paper. Negative staining was achieved by adding 2% uranyl acetate for 2 minutes and rinsing off the extra staining solution on the grid using filter paper, further air-dried, and transferred to the TEM for imaging.
Particle size and zeta potential determination
Size distribution and zeta potential of M1, M2, M3, and M4 flavonosomes were measured by a dynamic light scattering method using Zetasizer Nano ZS (Malvern Instruments, Malvern, UK) at a scattering angle of 90°C at 25°C. Prior to size and zeta potential measurements, the flavonosomes were diluted with phosphate-buffered saline, and each sample was measured three times.
Fourier transform infrared spectroscopy
The infrared (IR) spectra for the carrier (PC), QKA alone, physical mixture (QKA + PC), and optimal flavonosome (QKA–PC) were recorded on a Thermo Nicolet Nexus Smart Orbit FTIR (Vernon Hills, IL, USA) over the range of 4,000–500 cm−1.
Simultaneous thermal analysis (TGA/DSC)
Thermogravimetric (TGA) and differential scanning calorimetry (DSC) analyses were carried out in a simultaneous TGA–DSC SDT Q600 (TA Instruments, New Castle, DE, USA). The samples were loaded in standard aluminum pans, and their corresponding thermograms were obtained at a heating rate of 10°C/min with starting and ending temperatures of 25°C and 600°C, respectively.
Entrapment efficiency and drug-loading capacity of optimal formulation
Entrapment efficiency (EE) of the optimal formulation was determined using vivaspin® centrifuge filters (Sartorius AG, Goettingen, Germany) as described previously26 with slight modification. Briefly, 1 mL of the flavonosome was loaded on the top compartment of the vivaspin centrifuge filter membrane (MWCO – 10 kDa) and centrifuged at 3,500 rpm for 15 minutes. The eluent was collected at the lower compartment of vivaspin filter and further analyzed through HPLC to determine the amount of unentrapped flavonoids. Subsequently, equivalent solvent comprising the mixture of Q:K:A:PC was prepared at a ratio similar to that of the same concentration used during the flavonosome formulation and undergone the above-mentioned vivaspin protocol to determine the total drug. Thus, the % of EE was determined using the following formula:26
| (2) |
To determine the drug loading (DL) capacity, 1 mL of the flavonosome was centrifuged at 14,000× g for 1 hour, and the pellet was dissolved in tetrahydrofuran, further air-dried, diluted in acetonitrile, and was subjected to HPLC for the determination of the amount of flavonoids (Q, K, A) loaded in the flavonosomes (LD). Simultaneously, total mass of the carrier (PC) lipid matrix was obtained. Thus the % of DL was determined using the following formula:25,27
| (3) |
In vitro antioxidant DPPH kinetics
In vitro DPPH radical scavenging kinetics of the formulated flavonosomes through various methods were screened in comparison to the carrier (PC), freely mixed flavonoids (QKA), and physical mixture (QKA + PC), according to the protocol adapted from previous reports28,29 with slight modifications. Briefly, 150 μL of formulated flavonosomes or PC or QKA or QKA + PC was mixed with 50 μL of 0.1 mM DPPH solution (methanol with 0.3% Triton X-100 v/v).30 The flavonoids/PC content in carrier, free flavonoids mix, and physical mixture were adjusted to the same concentration as the formulated flavonosomes. Then the solution was incubated at 37°C in the dark for regulated time points at 10 minutes, 30 minutes, 60 minutes, 90 minutes, 150 minutes, 180 minutes, and 240 minutes (individual experimental set for each time point). Distilled water/DMSO mixed with DPPH solution served as a control. DPPH with methanol served as a blank. The absorbance of the samples after incubation was measured at 540 nm. Results were expressed as a percentage DPPH radical scavenging activity of the fraction and were calculated according to the following equation:
| (4) |
The time taken by the samples to achieve 50% of the scavenging activity was determined by plotting radical scavenging activity (%) versus various time points, and all analysis were performed in triplicates and the average activity is reported.
Cell culture and cytotoxicity assay
Human hepatoma (HepaRG) liver cells were purchased from Thermo Fisher Scientific, and the cells were cultured, maintained, and the differentiated cells were obtained as described in the previous studies.31,32,33 In brief, the HepaRG cell line was cultured in Williams’ E medium without phenol red and glutamine, supplemented with Glutamax I (Thermo Fisher Scientific), 10% fetal bovine serum, 100 IU/mL penicillin, and 100 μg/mL streptomycin (Nacalai Tesque, Inc), 5 μg/mL insulin (Sigma-Aldrich Co.), and 50 μM hydrocortisone hemisuccinate (Santa Cruz Biotechnology Inc.). After 2 weeks, the cells were incubated in 2% DMSO-supplemented medium (differentiation medium). The medium was renewed every 2–3 days. The obtained differentiated HepaRG cells were seeded at a density of 1×10⁵ cells/well in 96-well plates and employed for the cytotoxicity assay (MTT) as mentioned in a previous study34 with slight modifications. Briefly, cells were incubated with the formulated flavonosomes at various concentrations ranging from 3.125 μg/mL to 200 μg/mL dissolved in culture medium and incubated for 24 hours. At the end of the incubation time, cultures treated with higher concentrations of flavonosomes were quickly captured by phase-contrast microscopy using an Olympus 1×70, followed by addition of 20 μL of MTT (2.5 mg/mL) dissolved in phosphate-buffered saline solution to each well, and then the plate was further incubated for 3 hours. The solution in each well was discarded by suction and replaced by 100 μL of DMSO and vigorously mixed to dissolve the reacted dye. After 15 minutes of incubation, the absorbance of each well was read at 575 nm using ELISA plate reader. All assays were done in triplicate independently. The cytotoxicity results were expressed as the percentage of cell viability with respect to control cells.
Statistical analysis
The results are expressed as mean ± standard error of the mean. Statistical analysis was performed by using an independent Student’s t-test and analysis of variance with the Tukey’s post hoc test as appropriate. A P-value <0.05 considered as statistically significant.
Results and discussion
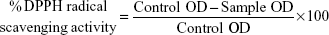
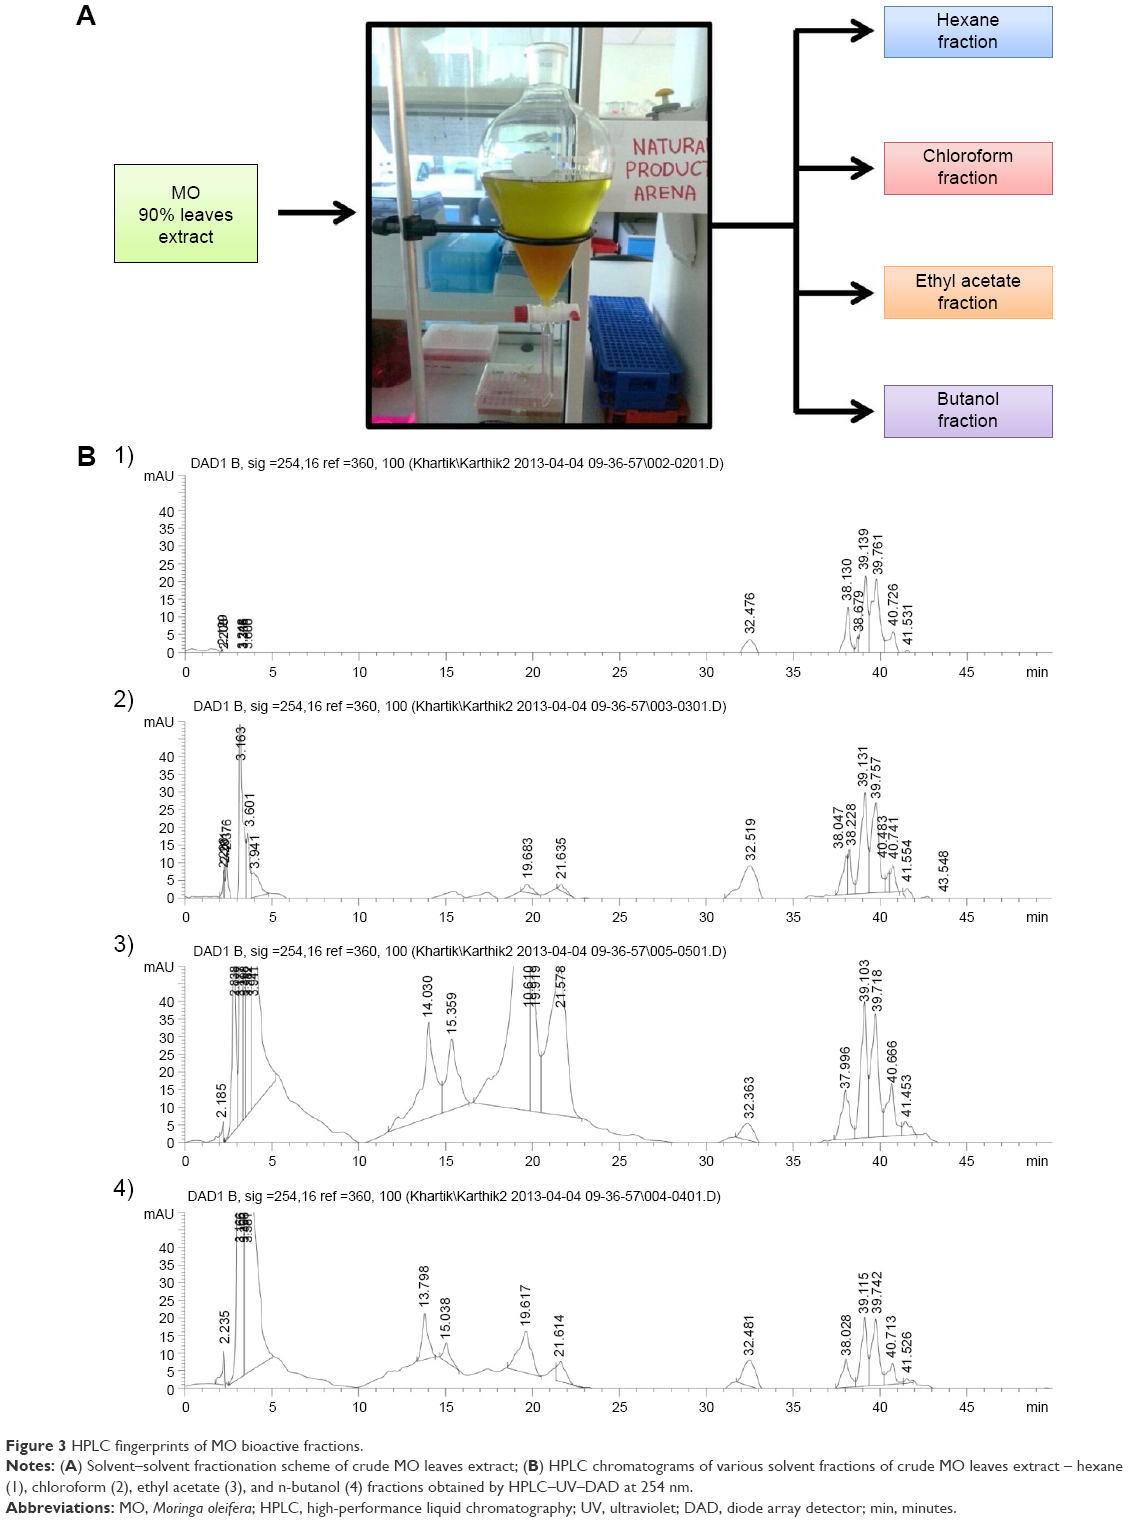
The 90% hydroethanolic MO leaves crude extract was subjected to fractionation using organic solvents in an increasing order of polarity such as n-hexane (Hex), chloroform (Chlor), EA, and n-butanol (But) using separating funnel (Figure 3A). The existence of chemical complexity and myriad compounds of different fractions could lead to diversified results based on the test employed.35 Thus, the obtained fractions were screened through various in vitro antioxidant assays: DPPH, NO radical scavenging assay, and PMO total antioxidant capacity assay, and all the results were compared with a standard antioxidant, AA. The results of the free radical scavenging potential of different fractions tested by DPPH and NO assay were calculated as the percentage inhibition and were presented in Figure 4A and B, respectively. The results indicated that EA fraction significantly exhibited the highest free radical scavenging activity, with the IC50 values of 14.15±1.00 and 15.42±0.15 for DPPH and NO, respectively. This proximates the activity of AA, which exhibited IC50 values of 10.98±0.67 and 12.02±0.51 for DPPH and NO, respectively. The second best was found to be the butanol (But) fraction, with the IC50 values of 28.02±0.49 and 28.15±0.30 for DPPH and NO, respectively. However, relatively the Hex and Chlor fractions exerted lower scavenging activity. For the PMO total antioxidant capacity assay, we determined and compared the capacity of various fractions in reducing phosphomolybdate acid to phosphomolybdate blue (Mo+6 → Mo+5). This was expressed quantitatively in terms of AA equivalent μg/g of extract in Figure 4C. The results were in accordance with the DPPH and NO assay results. EA fraction significantly exhibited higher total antioxidant capacity compared to the other fractions with the value of 73.19±0.85 AA equivalent μg/g of extract, followed by But, Chlor, and Hex fractions with the values of 67.71±1.37, 62.92±1.30, and 44.72±0.32 AA equivalent μg/g of extract, respectively. Overall, EA fraction showed higher radical scavenging activity and antioxidant capacity likely due to its high phenolic and flavonoid content as reported in previous studies.36–38 To further confirm, all these fractions were screened through HPLC analysis. Standard flavonoids were employed to identify and quantify the existence of flavonoids in EA fraction. The HPLC fingerprints of various fractions exhibited similar profile peaks as shown in Figure 3B. Despite, a few peaks were highly expressed during 10–25 minutes retention time of the EA fraction (Figure 3B3) compared to the other fractions. Based on our previous findings,4 those peaks were presumed as phenolic compounds and were further confirmed as flavonoids such as Q, K, and A by comparing the HPLC fingerprints of EA fraction with flavonoid standards and their corresponding retention time as shown in Figure 5A–D. Additionally, the peak areas of the three standard flavonoids (Q, K, A) at each concentration level and associated relative linear regression equations were obtained by establishing calibration graph with the peak area (y-axis) versus the flavonoid concentration (x-axis) as shown in Figure 5E1–E3. The respective flavonoids have been quantified in EA fraction as described previously.39 Following quantification of the HPLC results, the EA fraction of MO leaves was found to acquire higher concentration of K followed by the level of A and Q with the values of 263.86 μg/mg, 82.64 μg/mg, and 66.89 μg/mg in the fraction, respectively (Figure 5E4). Despite the activity observed with the bioassays that we have conducted, the therapeutic outcome of these flavonoids/its enriched active fractions in the in vivo system is still limited due to its physicochemical nature of poor water solubility, deprived intestinal absorbance, and limited bioavailability.40,41 To overcome this obstacle, numerous attempts of delivery systems for individual flavonoids have been established such as phytosome/liposome.42 However, previous reports indicated that isolation and purification of the bioactive constituents result in lessening of pharmacological activities that were previously observed.43,44 Thus in this study, we improved the bioavailability, refined its sustained release capability, and preserved their observed pharmacological activities, by loading these three bioactive flavonoids (Q, K, A) into a single entity termed as flavonosomes. The concentration of the loaded flavonoids was adjusted to be equivalent of those contained in MO-EA fraction.
 | Figure 3 HPLC fingerprints of MO bioactive fractions. |
 | Figure 4 Antioxidant activity of MO bioactive fractions. |
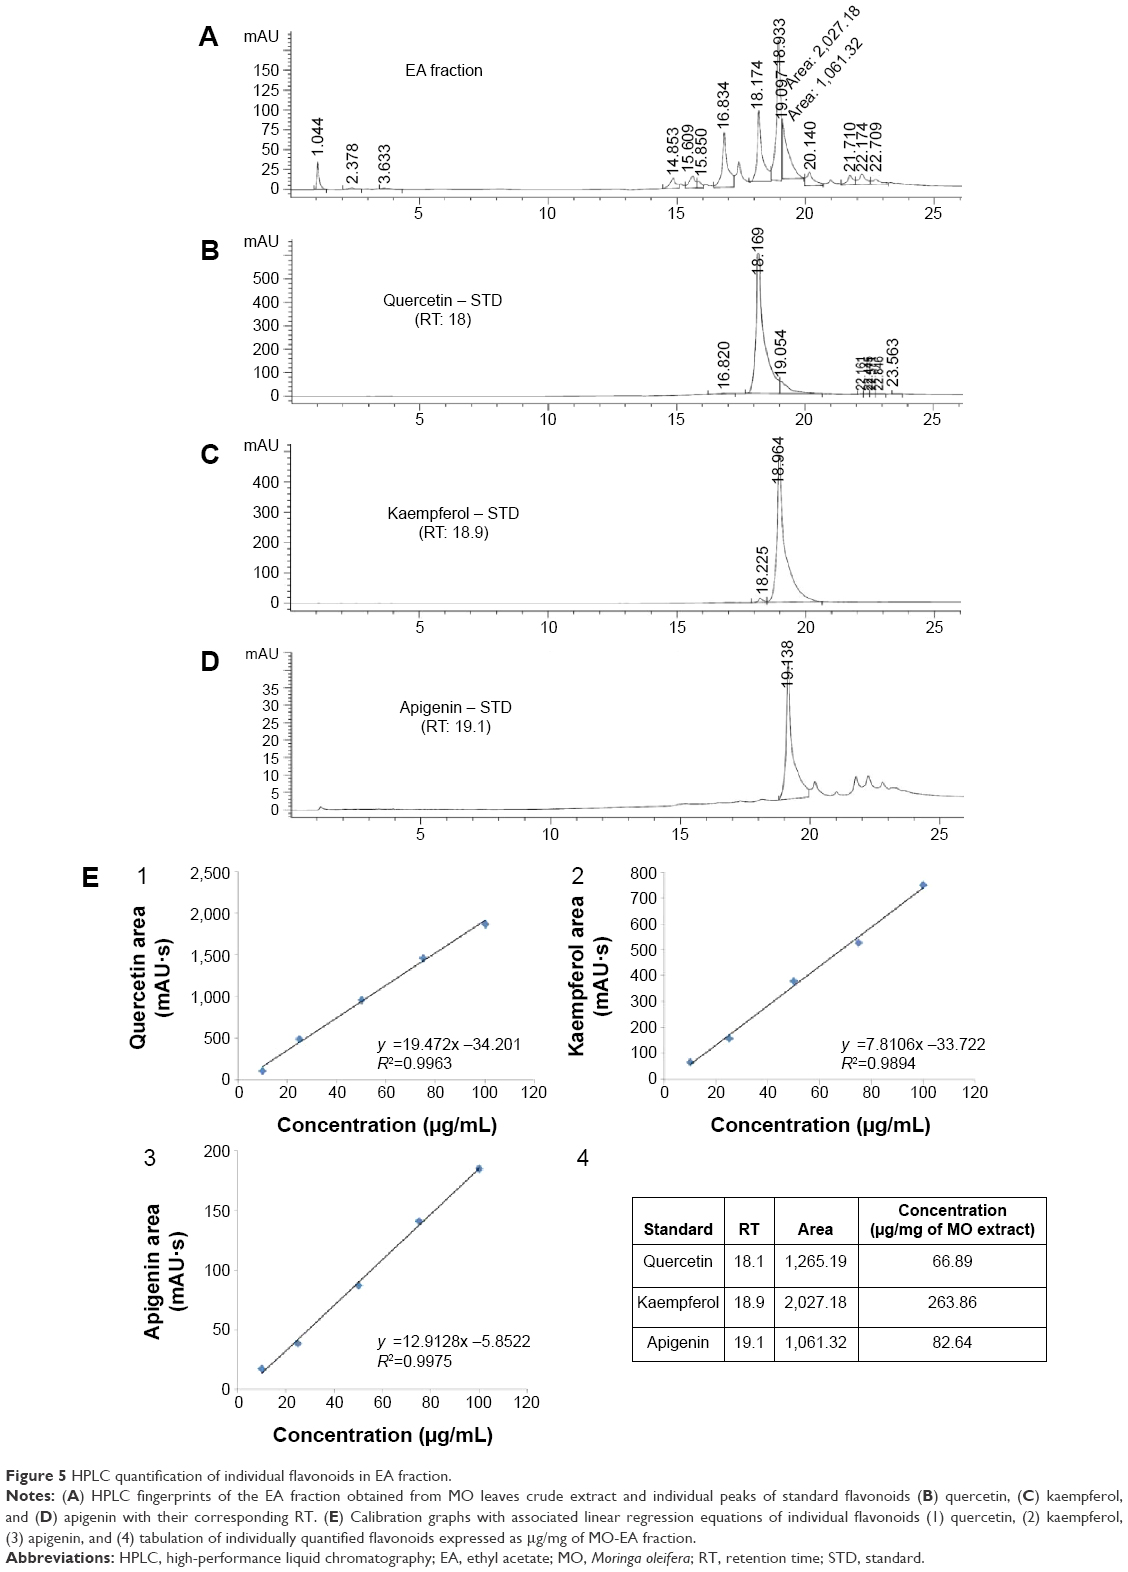 | Figure 5 HPLC quantification of individual flavonoids in EA fraction. |
Primarily, we adapted four various methods to formulate the flavonosomes and optimized the most appropriate method based on its physicochemical characteristics and antioxidant kinetics. Photomicrographs of the preliminarily synthesized individual flavonoid phytosomes were depicted in Figure 6. The impact of refluxed PC with their corresponding flavonoids was stacked in Figure 6 (1), which shows the thin film mesh formation of flavonoids and PC complex. The TEM images of free flavonoids, empty (PC) carriers, and corresponding individual Q, K, and A phytosomes were exhibited in Figure 6 (2–4), respectively. The sizes of the synthesized phytosomes were determined to be in the range of 200–400 nm with well-formed, discrete vesicles.
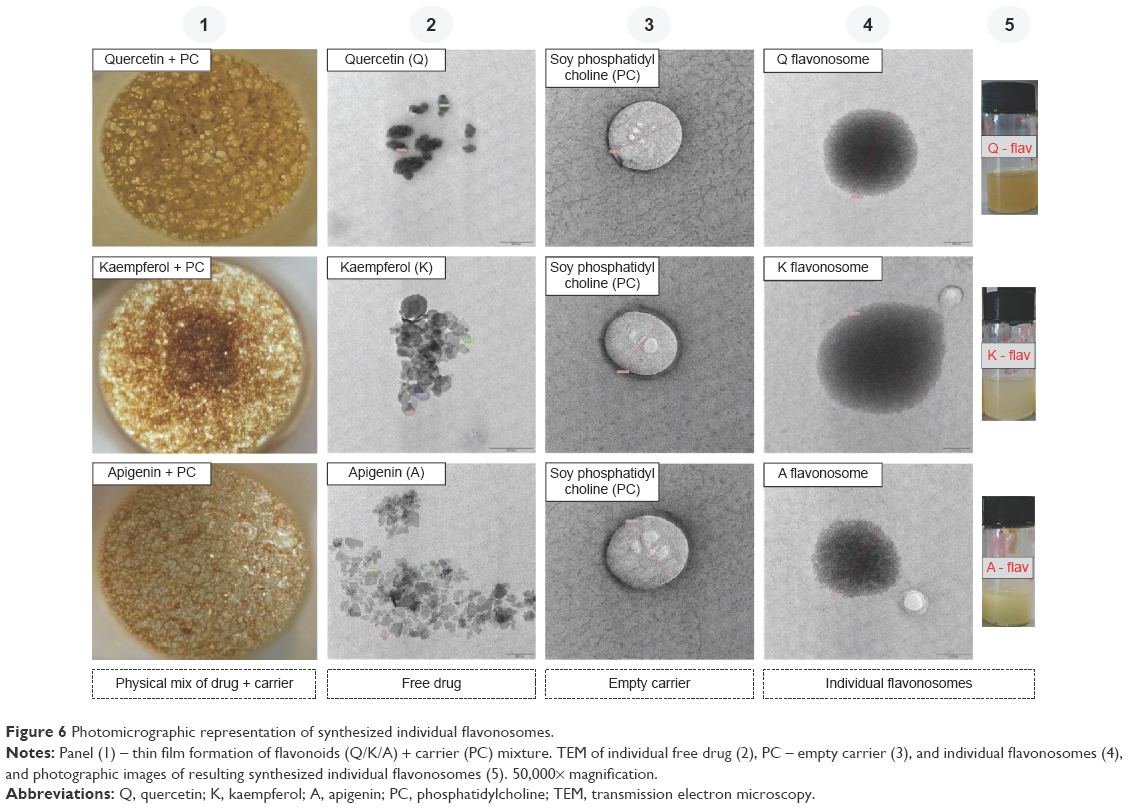 | Figure 6 Photomicrographic representation of synthesized individual flavonosomes. |
The photographic images of freshly synthesized individual phytosomes were displayed in Figure 6 (5) in which Q-phytosome showed a clear suspension with yellowish opalescence, whereas K- and A-phytosomes showed mild yellowish opalescence. The texture of the obtained thin film of flavonoids–PC complex and nature of the synthesized individual phytosomes are in accordance with the previous study reports.25,45 The particle size of a nanodelivery system is strongly associated with its dispersity index and also plays a major role in determining the outcome of the system in drug delivery. In addition, the monodisperse distribution enhances the stability of the vesicles, whereas the zeta potential denotes the surface charge of the suspension, through which the function of the flavonosomes was determined in vivo. The TEM images of formulated flavonosomes M1, M2, M3, and M4 were represented in Figure 7A1–A4, respectively. All the formulated flavonosomes are spherical in shape and comparable with synthesized individual phytosomes. However, the flavonosomes formulated as M1, M2, and M3 presented with larger size of 3,286.58 nm, 1,074.23 nm, and 862.45 nm, respectively, compared to M4, which revealed 361.52 nm. Images showing size, polydispersity index, and zeta potential distribution of the formulated flavonosomes were depicted in Figure 7B1–B5. The average particle size of the formulated flavonosomes was tabulated in Figure 7B5, where M1, M2, and M3 revealed large size of 3,355.33±76.43 nm, 1,036.07±43.12 nm, and 791.50±22.38 nm, respectively, with a wide range of polydispersity index ranging from 0.489 to 0.847. This is probably due to adaptation of conventional bulk loading method and the sonication involved during formulation. Though sonication aids in arranging the lipid molecule into lipid bilayer vesicles,46 the fusion of two or more phytosomes through sonication or bulk loading of compounds (M1, M2, and M3) leads to aggregation of vesicles that results in heterogeneous formulation with the coexistence of small and large unilamellar vesicles.47,48 In contrast, M4 flavonosomes yielded an average particle size of 375.93±33.61 nm with a narrow monodisperse index of 0.286±0.02, most likely due to sequential addition of flavonoids during thin-film hydration followed by direct nanoprecipitation without bulk loading or sonication.
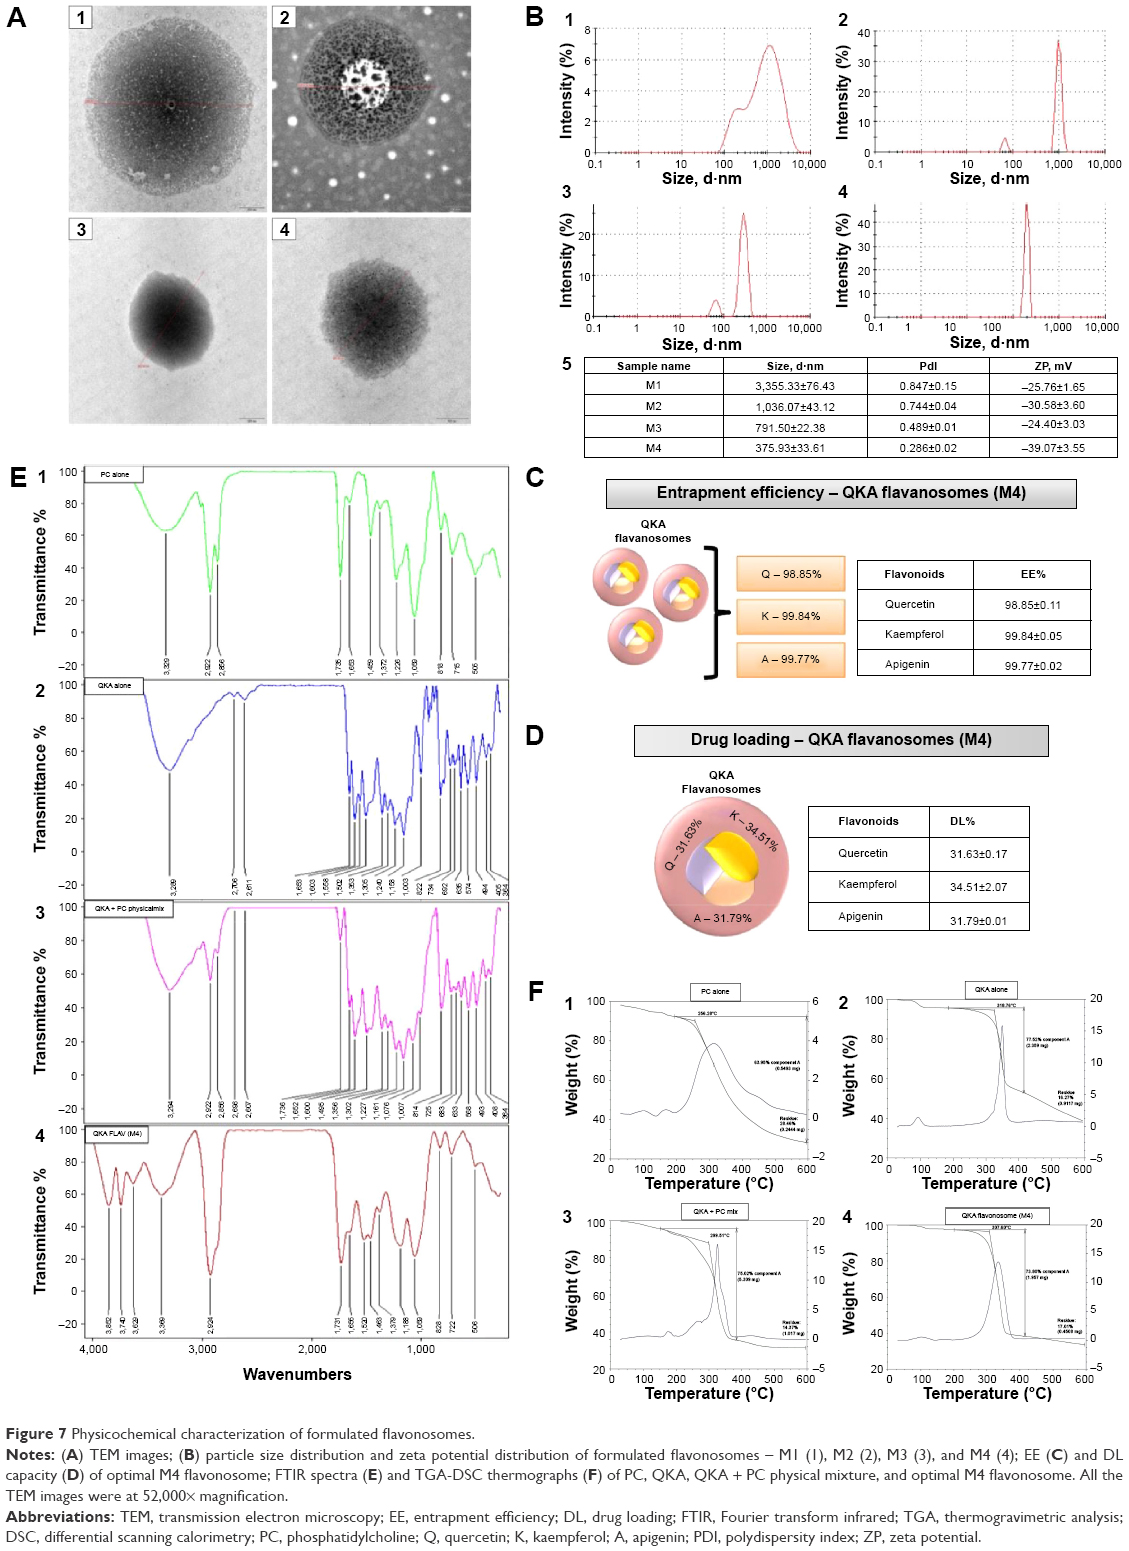 | Figure 7 Physicochemical characterization of formulated flavonosomes. |
The zeta potential value observed for the M4 flavonosome was significantly lower than −30 mV compared to the flavonosomes synthesized by other methods. Indicatively, it exceeds the typical threshold level for attraction and flocculation for repulsion.49 The high negative zeta potential of formulated flavonosomes can be explained by the presence of PC (as major component of the flavonosome); it retains the dynamic stability of the flavonosomes in aqueous state. Overall, M4 flavonosomes revealed small particle size, narrow monodisperse size distribution (low polydispersity index value), and high zeta potential, which indicates the excellent stability among the formulated flavonosomes. Therefore, M4 flavonosome was selected as the optimized formulation for further physicochemical characterization.
The EE and DL capacity of the flavonoids (Q, K, A) loaded in M4 flavonosome have been individually validated, and their corresponding results were depicted in Figure 7C and D, respectively. It has been reported previously that the EE/DL of the formulations depends on the solubility of the drug and its bonding interaction toward carrier in matrix formation.50 In accordance, the interaction among the three flavonoids and PC revealed >98% of EE for all the three flavonoids, while the DL efficiency of Q, K, and A was 31.63%±0.17%, 34.51%±2.07%, and 31.70%±0.01%, respectively. Therefore, our data supported the results from previous studies, where Q, K, and A flavonoids demonstrated higher affinity toward PC and established an intermolecular bonding to retain its specificity and stability.51,52
To investigate further the complex formation between the PC and flavonoids, Fourier transform IR spectroscopy was performed. Figure 7E shows IR spectra of PC alone (PC), flavonoids alone (QKA), physical mixture of flavonoids with carrier (QKA + PC), and M4 flavonosome (M4). The characteristic peaks of PC–hydrophobic tail region was observed (Figure 7E1) at 2,856 cm−1, 2,922 cm−1, and 1,459 cm−1, showing symmetric, antisymmetric C–H stretching band of long fatty acid chain, and CH2 scissoring, respectively. The relatively strong band centered at 1,735 cm−1 corresponds to the stretching vibrations of ester carbonyl groups. The polar head group vibrations are characterized by the spectral bands at 1,226 cm−1 and 1,059 cm−1, representing the aliphatic phosphate P=O stretching vibrations with a partially overlapped band at 1,059 cm−1 of the C–O–P–O–C stretching modes. The IR spectra of assorted QKA flavonoids exhibited cumulative characteristic peaks of phenolic flavonoids (Figure 7E2). A relatively strong band at 3,289 cm−1 indicates the O–H stretching that corresponds to the hydroxyl group of the flavonoids. The band stretching at 1,653 cm−1, 1,353 cm−1, and 1,502 cm−1 represents C-458=O stretching, C–O stretching, and benzene ring vibration, respectively. The spectrum of physical mixture (Figure 7E3) is significantly different compared to the PC and QKA alone, besides the physical mixture revealed an additive effect of PC and QKA. The incorporation of multiflavonoids (QKA) revealed significant changes in the IR spectra, indicating the localization of flavonoids and nature of bonding with the lipid membrane (Figure 7E3). The IR spectra of QKA flavonosome was shown in Figure 7E4. The overall broadening and masking of entire C–H stretching band of PC were observed. This is likely due to the penetration of water into the hydrophobic core of the membrane associated with formation of weak hydrogen bond between C–H groups of alkyl chain and water molecules. The spectral shift of the characteristic band 1,353 cm−1, representing the C–O stretching in the flavonoids, denotes the involvement of polar group of the flavonoids (hydroxyl group) in water binding in the membrane environment. The spectral shift of band representing C=O stretching and broadening of P=O stretching vibrations relatively confirmed the binding of flavonoids to the polar head of the membrane through the oxygen groups of lipid and keto groups of flavonoids. Our results strongly support the previously reported study results,53–55 where majority of the flavonoids bind to the polar heads (C–O–P–O–C stretching) of the PC via hydrogen bonding, thus indicating the localization of flavonoids. Thermal analysis behavior of PC alone (PC), flavonoids alone (QKA), physical mixture of flavonoids with carrier (QKA + PC), and M4 flavonosome (M4) was obtained by DSC and TGA (Figure 7F). The DSC curve of PC exhibited three endothermic peaks. The first peak at 136°C was generated due to the hot movements of the polar PC head. Whereas the second and third endothermal peaks possibly represent phase transitions from a gel like to a liquid crystal state and the melting of PC carbon chain, isomeric or crystal changes. Accordingly, TGA curve produced the first thermal event at the temperature range of 70°C–110°C, associated with a first-order transition in the form of evaporation followed by some water loss. A second and more prominent thermal event was observed between 200°C and 350°C, associated with a mass loss of ~64%. It evidently indicates thermal decomposition of long molecular chains (Figure 7F1).56,57 On the contrary, the DSC curve of flavonoids exhibited two endothermic peaks, the first peak at 90°C attributed to the evaporation of water that has been adsorbed by the surface and pores of the powdered flavonoids, whereas the second endothermic peak at 350°C represents the degradation of the flavonoids. Accordingly, the TGA curve revealed first thermal event at the temperature range of 80°C–110°C, associated with a first-order transition due to evaporation of adsorbed water molecules. The second noticeable thermal event was reported at the temperature range of 225°C–350°C, associated with a mass loss of ~78%, indicatively represent the thermal degradation of flavonoids (Figure 7F2).56,57 The DSC–TGA curves of the physical mixture showed an additive effect of PC and QKA. The shift of first and second endothermic peaks of PC and broadening of peak due to degradation of QKA flavonoids were seen clearly in Figure 7F3.56 However, the characteristic first and second endothermic peaks of PC and QKA in the DSC–TGA curves of the formulated optimal flavonosome (M4) were absent. They were rather replaced by a single broad unique peak. The disappearance of signature peaks of PC and QKA suggests that their original structure has been reformed and depicts the formation of the flavonosome complex due to secondary interactions. It can be concluded that flavonoids (QKA) may interact with PC supposedly through some weak intermolecular interactions, van der Waals forces, or hydrogen bonding, singly or in combination, based on previous study reports.58
Kinetic studies of DPPH radical scavenging activity of various formulated flavonosomes have been compared with the activities of PC alone, flavonoids alone (QKA), and physical mixture of flavonoids with carrier (Q–A + PC), corresponding to various time points. Free DPPH radical at a concentration of 0.1 mM dissolved in methanolic solution with 0.3% Triton X-100 v/v was stable for up to 16 hours in the reaction medium.30 Thus, it allows the compounds to be evaluated in that time range. In this study, we have evaluated the scavenging activity for up to 4 hours at various time points by using individual experimental set for each time point. The results of the DPPH antioxidant kinetics were shown in Figure 8A. Based on time taken by the samples to achieve a steady state, the reaction kinetics can be classified as rapid, intermediate, slow, and very slow kinetics.59 The results indicated that QKA alone, QKA + PC, and M1 and M2 flavonosomes exhibit rapid kinetic behavior by achieving almost 80% of scavenging activity within 30 minutes. This can be explained as the flavonoids alone or mixture of flavonoids with PC are readily available to scavenge free radical; however, the formulations M1 and M2 exhibit a typical burst release of flavonoids supposedly due to the method of their formulation (large size and poor stability), whereas PC alone exhibit relatively lower and slow kinetics activity possibly due to minimal antioxidant potential of PC compared to the flavonoids. On the contrary, M3 and M4 flavonosomes exhibit intermediate kinetics by achieving ~35%–45% of scavenging activity within 30 minutes and further exhibit persistent activity until 90 minutes. This can be explained as the M3 and M4 were optimally formulated to have smaller size and higher zeta potential; thus, exhibited a sustained release of flavonoids with extended scavenging activity up to 90 minutes. However, among the two formulations, M3 reached steady state after 90 minutes, whereas M4 revealed persistent activity even up to 240 minutes. This ultimately indicates a higher sustained release nature of M4 apparently due to the hydrogen bonding of flavonoids with the PC in accordance with the Fourier transform IR results.
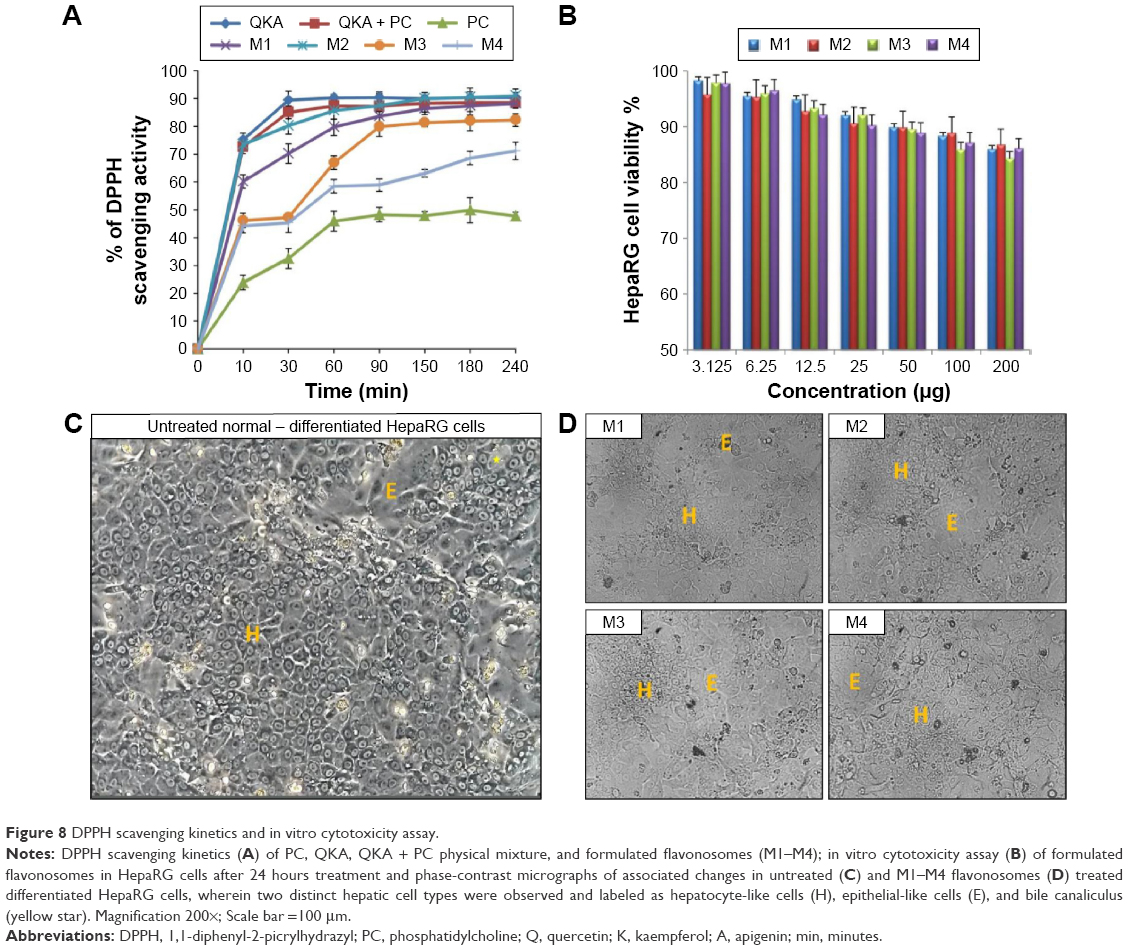 | Figure 8 DPPH scavenging kinetics and in vitro cytotoxicity assay. |
Though naturally derived phytocompounds show minimal toxicity toward normal cell line, but additives such as synthetic carriers or usage of certain organic solvents during the synthesis might enhance the toxicity of final product.60 Thus, it is often suggested the screening of the synthesized nanoparticles for toxicity potential through preliminary in vitro assay. Besides, this will also help in understanding the toxicity mechanism and cellular uptake of the nanoparticle at cellular level.61 Thus, in this study, the cytotoxic activity of formulated flavonosomes against human hepatoma HepaRG cell line was evaluated at various concentrations ranging from 3.125 μg/mL to 200 μg/mL and is depicted in Figure 8B. The cytotoxicity results of the four formulated flavonosomes show a dose–dependent activity. An increase in flavonosomes concentration from low to high causes a reduction of ~8%–10% cell viability. However, even at higher concentration of 200 μg/mL, the percentage viability of HepaRG cells for all the four formulations was >85%, thereby indicating the noncytotoxic nature of the formulated flavonosomes. These data are in agreement with previous studies concerning the noncytotoxic nature of the carrier (PC) and loaded flavonoids.62,63 The microscopic images of HepaRG cells treated with higher concentration (200 μg/mL) of flavonosomes were shown in Figure 8C and D. The images support the obtained cytotoxicity results, whereby after 24 hours treatment with the various formulated flavonosomes revealed no signs of toxicity, which was confirmed by the absence of intracytoplasmic vesicles formation as reported in previous studies;31,64,65 in contrast, the flavonosome treated HepaRG cells inclusive of both hepatocyte-like cells (H) and epithelium-like cells (I) remain healthy and intact similar to the morphology and architecture of untreated control cells (Figure 8C and D). This strongly suggests that flavonosomes could play an effective hepatosupplemental/hepatoprotective role.
Conclusion
The flavonoids (QKA) liable for pharmacological activity of the bioactive MO-EA fraction have been determined, quantified, and loaded at an equivalent proportion in PC via adapting various formulation methods. Conclusively, we established sequential loading (M4) of flavonoids as the optimal method to load these multiple phenolic-flavonoids in a single entity and have been termed as flavonosomes. M4 flavonosomes showed enhanced formulation characteristics including smaller size, narrow size distribution, higher zeta potential, pronounced EE, and associated evident QKA–PC bonding. The in vitro DPPH antioxidant kinetics of M4 flavonosomes exhibited an outstanding sustained release of antioxidants, proportionate to the free radical scavenging kinetics. All the formulated flavonosomes exhibited negligible cytotoxicity toward human hepatoma HepaRG cells even at higher concentrations. The antioxidant potential, sustained release kinetics of loaded flavonoids, and scanty toxicity toward HepaRG cells remarkably suggest M4 formulation synthesized via sequential co-loading method as a promising nanodrug delivery system. Nevertheless, more detailed investigation, on its therapeutic potential, actual release kinetics, biodistribution, and pharmacokinetics, is crucial to understand the therapeutic effect of flavonosomes.
Acknowledgment
This research work was supported by research grants from Universiti Putra Malaysia, project numbers GP-IPB/2013/9425802 and GP-IPS/2013/9397300.
Disclosure
The authors report no conflicts of interest in this work.
References
Tabatabaei-Malazy O, Larijani B, Abdollahi M. A systematic review of in vitro studies conducted on effect of herbal products on secretion of insulin from Langerhans islets. J Pharm Pharm Sci. 2012;15(3):447–466. | ||
Bonifacio BV, Silva PB, Ramos S, Silveira Negri KM, Bauab TM, Chorilli M. Nanotechnology-based drug delivery systems and herbal medicines: a review. Int J Nanomedicine. 2014;9:1–15. | ||
Kumar S, Pandey AK. Chemistry and biological activities of flavonoids: an overview. Sci World J. 2013;2013:16. | ||
Karthivashan G, Tangestani Fard M, Arulselvan P, Abas F, Fakurazi S. Identification of bioactive candidate compounds responsible for oxidative challenge from hydro-ethanolic extract of Moringa oleifera leaves. J Food Sci. 2013;78(9):C1368–C1375. | ||
Dai W, Gao Q, Qiu J, Yuan J, Wu G, Shen G. Quercetin induces apoptosis and enhances 5-FU therapeutic efficacy in hepatocellular carcinoma. Tumour Biol. 2016;37(5):6307–6313. | ||
Rezaei-Sadabady R, Eidi A, Zarghami N, Barzegar A. Intracellular ROS protection efficiency and free radical-scavenging activity of quercetin and quercetin-encapsulated liposomes. Artif Cells Nanomed Biotechnol. 2016;44(1):128–134. | ||
Mukhopadhyay P, Prajapati AK. Quercetin in anti-diabetic research and strategies for improved quercetin bioavailability using polymer-based carriers–a review. RSC Adv. 2015;5:97547–97562. | ||
Eid HM, Nachar A, Thong F, Sweeney G, Haddad PS. The molecular basis of the antidiabetic action of quercetin in cultured skeletal muscle cells and hepatocytes. Pharmacogn Mag. 2015;11(41):74–81. | ||
Fürst R, Zündorf I. Plant-derived anti-inflammatory compounds: hopes and disappointments regarding the translation of preclinical knowledge into clinical progress. Mediat Inflamm. 2014;2014. | ||
Hertzogi D, Tica O. Molecular mechanism underlying the anticancerous action of flavonoids. Cur Health Sci J. 2012;38:145–149. | ||
Calderon-Montano JM, Burgos-Morón E, Pérez-Guerrero C, López-Lázaro M. A review on the dietary flavonoid kaempferol. Mini Rev Med Chem. 2011;11(4):298–344. | ||
Park S, Sapkota K, Kim S, Kim H, Kim S. Kaempferol acts through mitogen-activated protein kinases and protein kinase B/AKT to elicit protection in a model of neuroinflammation in BV2 microglial cells. Br J Pharmacol. 2011;164(3):1008–1025. | ||
Chen AY, Chen YC. A review of the dietary flavonoid, kaempferol on human health and cancer chemoprevention. Food Chem. 2013;138(4):2099–2107. | ||
Hong J-T, Yen J-H, Wang L, Lo Y-H, Chen Z-T, Wu M-J. Regulation of heme oxygenase-1 expression and MAPK pathways in response to kaempferol and rhamnocitrin in PC12 cells. Toxicol Appl Pharmacol. 2009;237(1):59–68. | ||
Luo H, Rankin GO, Li Z, DePriest L, Chen YC. Kaempferol induces apoptosis in ovarian cancer cells through activating p53 in the intrinsic pathway. Food Chem. 2011;128(2):513–519. | ||
Mohammad Nabavi S, Habtemariam S, Daglia M, Fazel Nabavi S. Apigenin and breast cancers: from chemistry to medicine. Anticancer Agents Med Chem. 2015;15:728–735. | ||
Venigalla M, Gyengesi E, Münch G. Curcumin and Apigen–n – novel and promising therapeutics against chronic neuroinflammation in Alzheimer’s disease. Neural Regen Res. 2015;10(8):1181–1185. | ||
Ha SK, Lee P, Park JA, et al. Apigenin inhibits the production of NO and PGE2 in microglia and inhibits neuronal cell death in a middle cerebral artery occlusion-induced focal ischemia mice model. Neurochem Int. 2008;52(4–5):878–886. | ||
Karthivashan G, Arulselvan P, Tan SW, Fakurazi S. The molecular mechanism underlying the hepatoprotective potential of Moringa oleifera leaves extract against acetaminophen induced hepatotoxicity in mice. J Funct Foods. 2015;17:115–126. | ||
Wiczkowski WA, Nèmeth K, Buciñski A, Piskula M. Bioavailability of quercetin from flesh scales and dry skin of onion in rats. Pol J Food Nutr Sci. 2003;12(suppl 1):95–99. | ||
Mohan S, Nandhakumar L. Role of various flavonoids: hypotheses on novel approach to treat diabetes. J Med Hypotheses Ideas. 2014;8:1–6. | ||
Lee S-C, Kim J-H, Jeong S-M, Ha J-U, Nam K, Ahn D. Antioxidant activity of organic solvent extracts from far infrared treated rice hulls. Food Sci Biotechnol. 2004;13(2):172–175. | ||
Yu B, Lee RJ, Lee LJ. Microfluidic methods for production of liposomes. Methods Enzymol. 2009;465:129–141. | ||
Ohtani R, Inukai M, Hijikata Y, et al. Sequential synthesis of coordination polymersomes. Angew Chem Int Ed Engl. 2015;54(4):1139–1143. | ||
Hou Z, Li Y, Huang Y, et al. Phytosomes loaded with mitomycin C-soybean phosphatidylcholine complex developed for drug delivery. Mol Pharm. 2013;10(1):90–101. | ||
Patlolla RR, Chougule M, Patel AR, Jackson T, Tata PN, Singh M. Formulation, characterization and pulmonary deposition of nebulized celecoxib encapsulated nanostructured lipid carriers. J Control Release. 2010;144(2):233–241. | ||
Zeng S, Ye M, Qiu J, et al. Preparation and characterization of genipin-cross-linked silk fibroin/chitosan sustained-release microspheres. Drug Des Devel Ther. 2015;9:2501–2514. | ||
Tan C, Xue J, Abbas S, Feng B, Zhang X, Xia S. Liposome as a delivery system for carotenoids: comparative antioxidant activity of carotenoids as measured by ferric reducing antioxidant power, DPPH assay and lipid peroxidation. J Agric Food Chem. 2014;62(28):6726–6735. | ||
Savatović SM, Ćetković GS, Čanadanović-Brunet JM, Đilas SM. Kinetic behaviour of the DPPH radical-scavenging activity of tomato waste extracts. J Serb Chem Soc. 2012;77:1381–1389. | ||
Nicklisch SC, Waite JH. Optimized DPPH assay in a detergent-based buffer system for measuring antioxidant activity of proteins. MethodsX. 2014;1:233–238. | ||
Aninat C, Piton A, Glaise D, et al. Expression of cytochromes P450, conjugating enzymes and nuclear receptors in human hepatoma HepaRG cells. Drug Metab Dispos. 2006;34(1):75–83. | ||
Josse R, Aninat C, Glaise D, et al. Long-term functional stability of human HepaRG hepatocytes and use for chronic toxicity and genotoxicity studies. Drug Metabolism and Disposition. 2008;36:1111–1118. | ||
Anthérieu S, Chesné C, Li R, et al. Stable expression, activity, and inducibility of cytochromes P450 in differentiated HepaRG cells. Guguen-Guillouzo. Drug Metabolism and Disposition. 2010;38:516–525. | ||
Atienzar F, Gerets H, Tilmant K, Toussaint G, Dhalluin S. Evaluation of impedance-based label-free technology as a tool for pharmacology and toxicology investigations. Biosensors (Basel). 2013;3(1):132–156. | ||
Sannigrahi S, Mazuder UK, Pal DK, Parisa S, Jain S. Antioxidant potential of crude extract and different fractions of Enhydra fluctuans Lour. Iran J Pharm Res. 2010;9(1):75–82. | ||
Unuigbe CA, Okeri HA, Erharuyi O, Oghenero EE, Obamedo DA. Phytochemical and antioxidant evaluation of Moringa oleifera (Moringaceae) leaf and seed. J Pharm Bioresour. 2015;11:51–57. | ||
Vongsak B, Sithisarn P, Gritsanapan W. Simultaneous HPLC quantitative analysis of active compounds in leaves of Moringa oleifera Lam. Journal of Chromatographic Science. 2013, bmt093. | ||
N. Kooltheat N, Sranujit RP, Chumark P, et al. An ethyl acetate fraction of Moringa oleifera Lam. Inhibits human macrophage cytokine production induced by cigarette smoke. Nutrients. 2014;6: 697–710. | ||
Khan RA, Bibi M, Yousuf S, et al. Synthesis of some potent immunomodulatory and anti-inflammatory metabolites by fungal transformation of anabolic steroid oxymetholone. Chem Cent J. 2012;6(1):153. | ||
Thilakarathna SH, Rupasinghe H. Flavonoid bioavailability and attempts for bioavailability enhancement. Nutrients. 2013;5(9):3367–3387. | ||
Bilia AR, Isacchi B, Righeschi C, Guccione C, Bergonzi MC. Essential oils loaded in nanosystems: a developing strategy for a successful therapeutic approach. Evid Based Complement Alternat Med. 2014;2014:651593. | ||
Gurley B. Emerging technologies for improving phytochemical bioavailability: benefits and risks. Clin Pharmacol Ther. 2011;89(6):915–919. | ||
Tirupathi RG, Suresh BK, Kumar JU, Sujana P, Rao AV, Sreedhar A. Anti-microbial principles of selected remedial plants from Southern India. Asian Pac J Trop Biomed. 2011;1(4):298–305. | ||
Dai J, Mumper RJ. Plant phenolics: extraction, analysis and their antioxidant and anticancer properties. Molecules. 2010;15(10):7313–7352. | ||
Freag MS, Elnaggar YS, Abdallah OY. Lyophilized phytosomal nanocarriers as platforms for enhanced diosmin delivery: optimization and ex vivo permeation. Int J Nanomedicine. 2013;8:2385–2397. | ||
Maherani B, Arab-tehrany E, Kheirolomoom A, Reshetov V, Stebe MJ, Linder M. Optimization and characterization of liposome formulation by mixture design. Analyst. 2012;137(3):773–786. | ||
Traïkia M, Warschawski DE, Recouvreur M, Cartaud J, Devaux PF. Formation of unilamellar vesicles by repetitive freeze-thaw cycles: characterization by electron microscopy and 31P-nuclear magnetic. Eur Biophys J. 2000;29(3):184–195. | ||
Lee J-H, Choi SU, Jang SP, Lee SY. Nanoscale Research Letters. 2012;7:1–7. | ||
Bonincontro A, Falivene M, La Mesa C, Risuleo G, Ruiz Peña M. Dynamics of DNA adsorption on and release from SDS-DDAB cat-anionic vesicles: a multitechnique study. Langmuir. 2008;24(5):1973–1978. | ||
Tiwari A. Advanced Healthcare Materials. New York City, NY: John Wiley & Sons; 2014. | ||
Hendrich AB. Flavonoid-membrane interactions: possible consequences for biological effects of some polyphenolic compounds. Acta Pharmacol Sin. 2006;27(1):27–40. | ||
Kidd P, Head K. A review of the bioavailability and clinical efficacy of milk thistle phytosome: a silybin-phosphatidylcholine complex (Siliphos). Altern Med Rev. 2005;10(3):193–203. | ||
Pawlikowska-Pawlęga B, Misiak LE, Zarzyka B, Paduch R, Gawron A, Gruszecki WI. FTIR, (1)H NMR and EPR spectroscopy studies on the interaction of flavone apigenin with dipalmitoylphosphatidylcholine liposomes. Biochim Biophys Acta. 2013;1828(2):518–527. | ||
Zhang K, Gu L, Chen J, et al. Preparation and evaluation of kaempferol-phospholipid complex for pharmacokinetics and bioavailability in SD rats. J Pharm Biomed Anal. 2015;114:168–175. | ||
Pawlikowska-Pawlęga B, Dziubińska H, Król E, et al. Characteristics of quercetin interactions with liposomal and vacuolar membranes. Biochim Biophys Acta. 2014;1838(1 pt B):254–265. | ||
Yu D-G, Yang J-H, Wang X, Tian F. Liposomes self-assembled from electrosprayed composite microparticles. Nanotechnology. 2012;23(10):105606. | ||
Słota R, Dyrda G, Hofer M, Mele G, Bloise E, Sole RD. Novel lipophilic lanthanide bis-phthalocyanines functionalized by pentadecylphenoxy groups: synthesis, characterization and UV-photostability. Molecules. 2012;17(9):10738–10753. | ||
Lúcio M, Bringezu F, Reis S, Lima JL, Brezesinski G. Binding of nonsteroidal anti-inflammatory drugs to DPPC: structure and thermodynamic aspects. Langmuir. 2008;24(8):4132–4139. | ||
Kansci G, Dongo E, Genot C. 2,2-diphenyl-1-picrylhydrazyl (DPPH*) test demonstrates antiradical activity of Dorstenia psilurus and Dorstenia ciliata plant extracts. Nahrung. 2003;47(6):434–437. | ||
Martins S, Sarmento B, Ferreira DC, Souto EB. Lipid-based colloidal carriers for peptide and protein delivery – liposomes versus lipid nanoparticles. Int J Nanomedicine. 2007;2(4):595–607. | ||
Alkilany AM, Murphy CJ. Toxicity and cellular uptake of gold nanoparticles: what we have learned so far? J Nanopart Res. 2010;12(7):2313–2333. | ||
Diaz C, Vargas E, Gatjens-Boniche O. Cytotoxic effect induced by retinoic acid loaded into galactosyl-sphingosine containing liposomes on human hepatoma cell lines. Int J Pharm. 2006;325(1–2):108–115. | ||
Li H, Lee J-H, Kim SY, et al. Phosphatidylcholine induces apoptosis of 3T3-L1 adipocytes. J Biomed Sci. 2011;18:1–7. | ||
Bachour-El Azzi P, Sharanek A, Abdel-Razzak Z, et al. Impact of inflammation on chlorpromazine-induced cytotoxicity and cholestatic features in HepaRG cells. Drug Metabolism and Disposition. 2014;42:1556–1566. | ||
Coulter JA, Jain S, Butterworth KT, et al. Cell type-dependent uptake, localization, and cytotoxicity of 1.9 nm gold nanoparticles. Int J Nanomedicine. 2012;7. |
 © 2016 The Author(s). This work is published and licensed by Dove Medical Press Limited. The
full terms of this license are available at https://www.dovepress.com/terms
and incorporate the Creative Commons Attribution
- Non Commercial (unported, 3.0) License.
By accessing the work you hereby accept the Terms. Non-commercial uses of the work are permitted
without any further permission from Dove Medical Press Limited, provided the work is properly
attributed. For permission for commercial use of this work, please see paragraphs 4.2 and 5 of our Terms.
© 2016 The Author(s). This work is published and licensed by Dove Medical Press Limited. The
full terms of this license are available at https://www.dovepress.com/terms
and incorporate the Creative Commons Attribution
- Non Commercial (unported, 3.0) License.
By accessing the work you hereby accept the Terms. Non-commercial uses of the work are permitted
without any further permission from Dove Medical Press Limited, provided the work is properly
attributed. For permission for commercial use of this work, please see paragraphs 4.2 and 5 of our Terms.