Back to Journals » International Journal of Nanomedicine » Volume 12
Optical coding of fusion genes using multicolor quantum dots for prostate cancer diagnosis
Authors Lee H, Kim C, Lee D, Park JH ![]() , Searson PC, Lee KH
, Searson PC, Lee KH ![]()
Received 27 March 2017
Accepted for publication 13 May 2017
Published 12 June 2017 Volume 2017:12 Pages 4397—4407
DOI https://doi.org/10.2147/IJN.S138081
Checked for plagiarism Yes
Review by Single anonymous peer review
Peer reviewer comments 3
Editor who approved publication: Dr Thomas Webster
Hyojin Lee,1,* Chloe Kim,2,* Dongjin Lee,1,3,* Jea Ho Park,1,2 Peter C Searson,2 Kwan Hyi Lee1,3
1Center for Biomaterials, Biomedical Research Institute, Korea Institute of Science and Technology (KIST), Seoul, Republic of Korea; 2Department of Materials Science and Engineering, 3Department of Biomedical Engineering, Korea University of Science and Technology (UST), Daejeon, Republic of Korea
*These authors contributed equally to this work
Abstract: Recent studies have found that prostate cancer expresses abnormal genetic markers including multiple types of TMPRSS2–ERG fusion genes. The expression level of different TMPRSS2–ERG fusion genes is correlated to pathologic variables of aggressive prostate cancer and disease progression. State-of-the-art methods for detection of TMPRSS2–ERG fusion genes include reverse transcription polymerase chain reaction (RT-PCR) with a detection limit of 1 fmol at urinary condition. RT-PCR is time consuming, costly, and inapplicable for multiplexing. Ability to identify multiple fusion genes in a single sample has become important for diagnostic and clinical purposes. There is a need for a sensitive diagnostic test to detect multiple TMPRSS2–ERG fusion genes for an early diagnosis and prognosis of prostate cancer. Here, we propose to develop an assay for prostate cancer diagnosis using oligonucleotide-functionalized quantum dot and magnetic microparticle for optical detection of rearranged TMPRSS2–ERG fusion genes at a low concentration in urine. We found that our assay was able to identify three different types of fusion gene with a wide detection range and detection limit of 1 fmol (almost the same level of the RT-PCR result reported). Here, we show detection of multiple TMPRSS2–ERG fusion genes using color-coded oligonucleotides in cell lysate and urine.
Keywords: fusion genes, prostate cancer, quantum dots, multiplexed assay, optical detection
Introduction
Chromosome abnormalities have gained much attention as a factor for initiation of carcinogenesis.1 Although the presence of various fusion genes has been correlated with specific cancers, the pathogenic significance remains under discussion.2 Therefore, a method to determine and differentiate types of fusion genes in patient samples is required to understand the function of abnormal genes in cancer. Specifically, prostate cancer expresses several characteristic genes with high frequency. Fifty percent of patients with positive prostate-specific antigen tests show overexpression of fusion genes of transmembrane protease serine 2 (TMPRSS2) and erythroblastosis virus E26 transformation-specific (ETS) transcription factor family, such as TMPRSS2–ERG (v-ets erythroblastosis virus E26 oncogene homology)3,4 (Figure 1A). Fusion of TMPRSS2 and ERG loci at the chromosomal level and subsequent overexpression of the TMPRSS2–ERG transcript and truncated ERG protein product are essentially 100% specific for the presence of prostate cancer in tissue-based studies.4,5 Recent studies have found that the expression level of different TMPRSS2–ERG fusion genes is correlated to pathologic variables associated with the progression of aggressive prostate cancer.6,7 The isoform of the fusion gene exon 1 of TMPRSS2 combined with exon 4 of ERG is the most common type of fusion gene in prostate cancer. Other isoforms, such as exon 1 and exon 1+2 of TMPRSS2 with exon 2 of ERG, are mildly active transcripts that are found in more aggressive prostate cancers.7
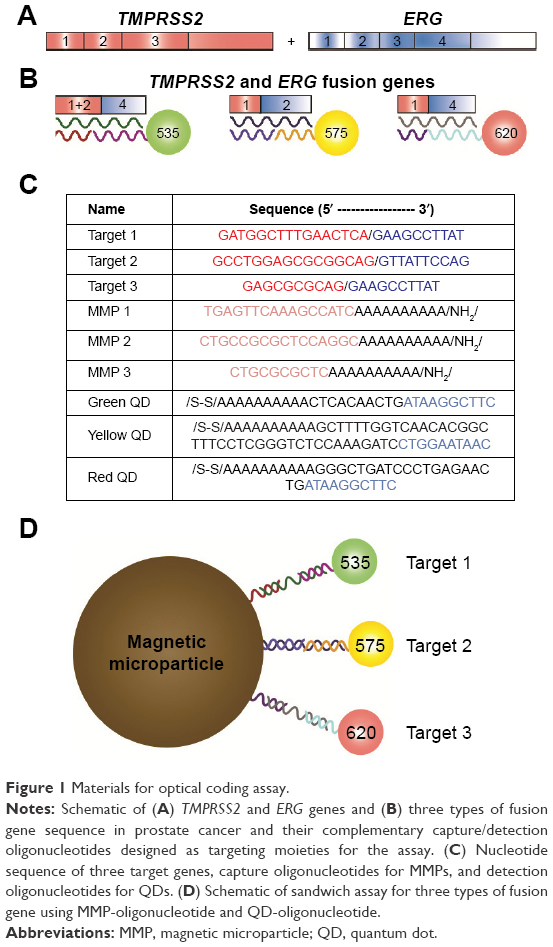 | Figure 1 Materials for optical coding assay. |
Currently, the most commonly used method to detect TMPRSS2–ERG fusion genes in clinical and research laboratories is reverse transcription polymerase chain reaction (RT-PCR), which has a detection limit of about 1 fmol.8 However, RT-PCR is time consuming, costly, and inapplicable for multiplexing. In addition, the ability to identify multiple fusion genes in a single sample has become important for diagnostic and clinical purposes.9 The challenges with RT-PCR (or other enzyme-based amplification techniques) include complications in designing accurate quantification methods.9,10 The aim of this study is to provide an effective and rapid test with high sensitivity and specificity to target genes in low concentration that offers quantitative results and allows multiplexing. Multicolor quantum dots enable visualization of various biomolecules over a wide range of emission wavelengths and are capable of optically detecting many biomarkers simultaneously.11–13 Here we present an assay for prostate cancer diagnosis using magnetic microparticles (MMPs) for efficient capture of TMPRSS2 and oligonucleotide-functionalized multicolor quantum dots (QDs) for optical coding of rearranged TMPRSS2–ERG fusion genes (Figure 1B, C and D). Our assay enables relatively fast and accurate detection of prostate cancer-specific fusion genes at a low concentration in buffer, urine, and prostate cancer cells (LNCaP and NCI-H660 cell lines).
Materials and methods
Cell culture
All cell lines were purchased from American Type Culture Collection (Manassas, VA, USA). LNCaP cells were grown in Roswell Park Memorial Institute (RPMI)-1640 (Thermo Fisher Scientific, Waltham, MA, USA) supplemented with 10% fetal bovine serum (Thermo Fisher Scientific) and 1% antibiotic–antimycotic solution (Thermo Fisher Scientific). NCI-H660 cells were grown in RPMI-1640 supplemented with 5% fetal bovine serum, 1% antibiotic–antimycotic solution, 5 μg/mL of insulin, 10 nM of hydrocortisone, 10 μg/mL of transferrin, 30 nM of sodium selenite, 10 nM of β-estradiol, and 2 mM of L-glutamine. All cell lines were grown at 37°C in the presence of 5% CO2.
Oligonucleotides for capture and detection
Oligonucleotides were synthesized by Integrated DNA Technologies (Coralville, IA, USA). A primary amine group was added to the 3′ position of sequences to conjugate to carboxylated MMPs. For QD probes, a thiol group was added to the 5′ position of sequences (Figure 1B and C). All DNA strands were resuspended in deionized water at a final concentration of 100 μmol/L.
Oligonucleotide conjugation of MMPs
Carboxylic acid-functionalized, 2.8 μm diameter MMPs (Dynabeads® M-270 carboxylic acid; Thermo Fisher Scientific) were briefly vortexed and separated by using magnetic separation rack (OZ Biosciences, San Diego, CA, USA) to remove the supernatant for 1 minute. The MMPs were then washed twice with 25 mM 2-(N-morpholino)ethanesulfonic acid (Sigma-Aldrich, St Louis, MO, USA) buffer at pH 5. Then, 10 nmol of amine-terminated oligonucleotides (capture DNAs), complementary to different regions of TMPRSS2, were prepared in 2-(N-morpholino)ethanesulfonic acid buffer, mixed with MMPs, and shaken moderately at room temperature for 30 minutes. The capture DNAs and the MMPs were cross-linked with each other by adding 100 mg/mL of N-(3-dimethylaminopropyl)-N′-ethylcarbodiimide hydrochloride (Sigma-Aldrich) at room temperature. After 3 hours of shaking and magnetic separation, the supernatant was removed, and the absorbance of the supernatant was then measured at 260 nm using a UV–Vis spectrophotometer (SCINCO, Seoul, Republic of Korea) to calculate the amount of the capture DNAs conjugated to MMPs. The MMPs were washed with 50 mM Tris-HCl buffer, pH 7.4 (Thermo Fisher Scientific) for 10 minutes with shaking, and this washing step was repeated twice. Finally, DNA-conjugated MMPs were resuspended in phosphate-buffered saline (PBS), pH 7.4 (Thermo Fisher Scientific) at a final concentration of 30 mg/mL.
QD synthesis and lipid functionalization
CdSe QDs were synthesized from CdO and Se in trioctylphosphine oxide and hexadecylamine and passivated with a Cd/ZnS shell, as described previously.13,14 The core/shell QDs with diameters of 6.5, 7.2, and 8.2 nm have emission peaks at 535, 575, and 620 nm, respectively. The concentration of the QDs in chloroform was determined from the absorbance at 350 nm using Beer’s Law (A=εlc) and an extinction coefficient ε=1.44×10²×r3 (cm2/mol).
The QDs in chloroform were water solubilized by forming an outer lipid layer consisting of a single acyl chain lipid, 1-myristoyl-2-hydroxy-sn-glycero-3-phosphocholine (MHPC; Avanti Polar Lipids, Inc., Alabaster, AL, USA), a double acyl chain phospholipid with a terminal polyethylene glycol (PEG) group, 1,2-distearoyl-sn-glycero-3-phosphoethanolamine-N-[methoxy(polyethylene glycol)-2000] (DSPE-PEG2K; Avanti Polar Lipids, Inc.), and a double acyl chain phospholipid with a terminal maleimide, DSPE-PEG2K-maleimide (Avanti Polar Lipids, Inc.), for oligonucleotide conjugation.
One nanomole of QDs and a 7-fold molar excess of lipids in chloroform were mixed and the chloroform was evaporated off using nitrogen gas. The excess was calculated based on an average footprint of 0.6 nm2 for MHPC and an average footprint of 0.7 nm2 for DSPE-PEG2K lipids, and taking the QD diameter with a trioctylphosphine oxide/hexadecylamine inner leaflet. One milliliter of water (pH 5.5) was added and vortexed until the solution turned clear. The resulting solution was passed through a syringe filter with a 100 nm polytetrafluoroethylene membrane to remove any aggregates. Red-emitting QDs (QD620) were lipid-coated with 80:10:10 molar ratio of MHPC:DSPE-PEG2K:DSPE-PEG2K-maleimide, yellow-emitting QDs (QD575) were lipid-coated with 70:15:15 molar ratio, and green-emitting QDs (QD535) were lipid-coated with 60:20:20 molar ratio.
Oligonucleotide functionalization of QDs (Barcode DNA-QD) for color-coding
Maleimide-functionalized QDs were conjugated to thiol-terminated detection oligonucleotides that are complementary to different regions of ERG. Disulfide-oligonucleotide sequences were mixed with a 1000-fold excess of 1,4-dithiothreitol (Sigma-Aldrich) for 60 minutes at room temperature to reduce the disulfide bonds. Then, the mixture was run in an illustra™ NAP™-5 Column (Sigma-Aldrich) to isolate the reduced oligonucleotides and to remove any excess reagents. Typically, 500 pmol of QDs were mixed for 1 hour at room temperature, and the QD–oligonucleotide mixture was centrifuged using Amicon® Ultra-0.5 centrifugal filter tubes (EMD Millipore, Temecula, CA, USA) to remove unbound oligonucleotides. The optical density (OD260) of the supernatant was measured using a UV–Vis spectrophotometer to determine how many oligonucleotides were conjugated to each QD (Figure S1).
Fusion gene detection assay in buffer
MMP-DNA and QD-DNA conjugates formed sandwich complex with the complementary fusion genes. We performed assays to detect from 100 pmol to 100 amol of three synthetic fusion genes in 1 M NaCl solution. MMP-DNA and QD-DNA were incubated with the target sequence for 3 minutes at 80°C for initial dehybridization and cooled down to allow DNA hybridization. The total assay time was 30 minutes. After washing with 1 M NaCl and magnetic separation, sandwiched MMP-target-QD complex was resuspended in deionized water. Next, QDs were released from the complex by heating above the melting temperature of the target fusion gene. The fluorescence intensity of the released QDs was measured using Infinite® F200 Pro (Tecan, Zürich, Switzerland), and the signal intensity values were normalized by subtracting the value of negative control which does not contain any target. The measurements for each target were performed under the same equipment setting.
Urine tests
One hundred picomoles of synthetic target oligonucleotides was spiked in 100 μL of normal human urine (Lee Biosolutions, Maryland Heights, MO, USA), and 10 μL (300 μg) of MMP probes and 10 pmol of QD probes were added to allow the formation of MMP-target-QD sandwich complex. After 30 minutes of incubation on a rotator, the supernatant was discarded by magnetic separation and the remaining MMP-target-QD sandwich complexes were washed with 1 M NaCl solution, and this washing step was repeated. The mixture was then incubated at 80°C for 3 minutes for DNA dehybridization to separate the QDs from the MMPs. After magnetic separation, QDs released from the sandwich complex were transferred to a new tube to measure the fluorescence. The fluorescence intensity of the released QDs was measured using Infinite F200 Pro (Tecan), and the fluorescence intensity values were displayed as a signal-to-noise ratio.
Cell targeting
For optical coding of cellular RNAs, total cellular RNAs were isolated using Trizol reagent (Thermo Fisher Scientific) following the manufacturer’s protocol. Then, 2.5 μg of the isolated cellular RNAs, 10 μL (300 μg) of MMP probes, and 10 pmol of QDs were mixed in 100 μL of 1 M NaCl solution. After 30 minutes of incubation on a rotator, the supernatant was discarded by magnetic separation and the remaining MMP-target-QD sandwich complexes were washed twice with 1 M NaCl solution. The mixture was then incubated at 80°C for 3 minutes for the dehybridization of nucleotides to separate the QDs from the sandwich complex. After magnetic separation, the QDs eluted were transferred to a new tube and fluorescence was measured.
Reverse transcription polymerase chain reaction
Total cellular RNA was isolated using Trizol reagent (Thermo Fisher Scientific) according to the manufacturer’s protocol. Reverse transcription was performed using PrimeScript first strand complementary DNA (cDNA) Synthesis Kit (TaKaRa, Otsu, Japan) following the manufacturer’s protocol. PCR analysis of TMPRSS2–ERG expression was performed using a program with 35 cycles of 98°C for 10 seconds, 68°C for 30 seconds, and 72°C for 45 seconds.
The PCR products were electrically mobilized in a 1.5% agarose gel and the DNA bands were visualized using gel documentation system (Scinomics, Daejeon, Republic of Korea). The DNA band intensity was analyzed as an unsaturated image using ImageJ software. The RT-PCR results were additionally confirmed by DNA sequencing. The sequences of used primers for RT-PCR and sequencing are as follows: TMPRSS2–ERG forward, 5′-CAGGAGGCGGAGGCGGA-3′; TMPRSS2–ERG reverse, 5′-GGCGTTGTAGCTGGGGGTGAG-3′.
Results and discussion
QD-DNA conjugation and characterization
Barcode DNA was conjugated to QDs using the maleimide–thiol “click” reaction.14 DSPE-PEG2K-maleimide lipids provide a binding site for 5′-SH-barcode DNAs at neutral pH. After the reaction, QD-DNA conjugates were separated from free, unbound DNA. From mass balance, we determined an average 10 barcode DNAs immobilized on each QD. Additionally, we used dynamic light scattering to monitor the size of QDs before and after the DNA functionalization. Dynamic light scattering analysis result showed that there was a 27–39 nm increase in the diameter of QDs after DNAs were immobilized (Figure 2A).
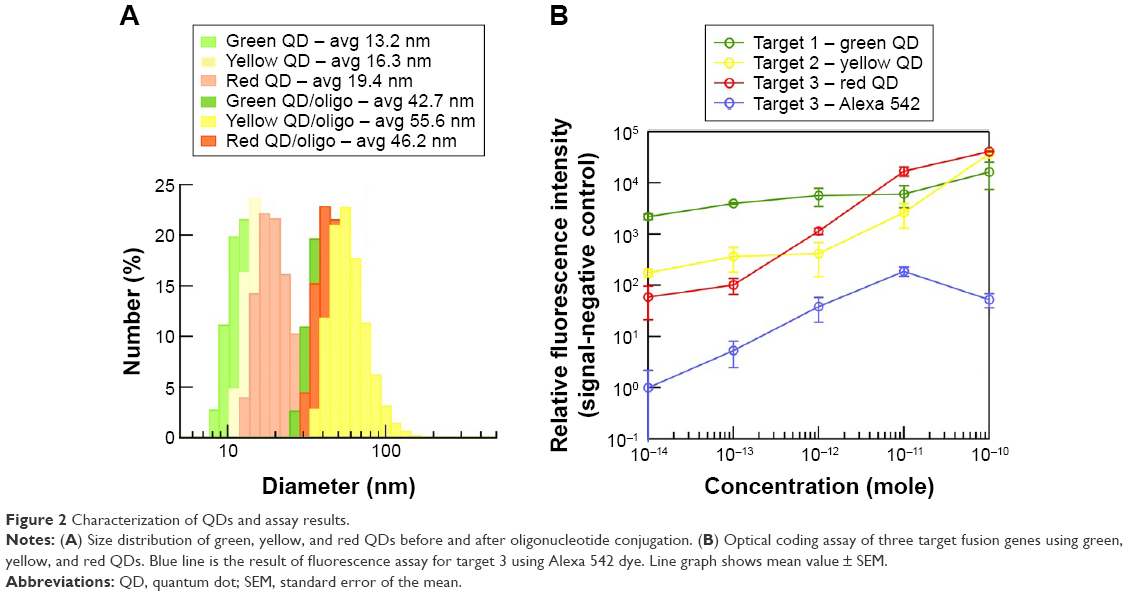 | Figure 2 Characterization of QDs and assay results. |
Detection of target fusion genes in buffer condition
We prepared MMP conjugates with three capture oligonucleotides and three different color QDs conjugated to three detection oligonucleotides for optical coding of fusion genes. Known concentrations of fusion genes were suspended in phosphate buffer and the optical coding assay was performed in triplicate (Figure 2B). The fluorescence of the QDs was measured using filter cubes with excitation 360 nm and emission 535 nm for green, 570 nm for yellow, and 620 nm for red QDs. Here, we report the fluorescence signal as a signal intensity with background subtracted of an individual set of assay, since the collected emission intensities were in relative fluorescence units at an optimized optical setting for individual experiments. The background intensity was defined as the fluorescence intensity in a control assay with no target. Our MMP-QD assay could optically code from 10 fmol to 100 pmol of three target fusion genes using different color QDs (Figure 2B). As a comparison, commercially available dyes, Alexa Fluor 488 (Alexa 488) and Alexa Fluor 595 (Alexa 595), conjugated oligonucleotides were used for detection. The MMP-Alexa assay could not identify the amount of target fusion genes that MMP-QD could (Figure 2B). This shows the advantage of using QDs that have no photobleaching, a brighter emission, and a higher signal-to-noise ratio compared with organic dyes (Figures 2B and S2).
Assay in urine
Urine contains various elements including proteins, dissolved ions, water, and salts. These urinary elements often nonspecifically bind to biomolecules, surfaces, and other components of an assay, which compromise the performance and sensitivity. Detection of target molecules in urine is very challenging. TMPRSS2–ERG fusion genes are known to exist in both blood and urine.7 Therefore, development of an assay for determination of fusion genes in urine would be particularly useful for noninvasive diagnosis. In this regard, we tested whether our platform could be used for urinary tests. We prepared four pooled normal urine samples spiked with 100 pmol of each target fusion gene and a negative control which did not contain any target fusion gene. Using green QDs (target 1 probe), yellow QDs (target 2 probe), red QDs (target 3 probe), and MMPs, we performed the assay and measured the fluorescence intensities at three different emission wavelengths (535, 570, and 620 nm with excitation at 360 nm). The results showed that the MMP-green QD and MMP-yellow QD effectively detected target 1 and target 2, with over 2-fold increase in the signal compared to the control. Also, no significant change in specificity was observed in the presence of other targets (Figure 3). Similarly, the MMP-red QD successfully detected target 3 with a nearly 25-fold larger signal than that of the control. Difference in quantum yield% (30%–40% for green and yellow QDs, >85% for red QDs) and a number of photons emitted at 360 nm excitation could alter the range of fluorescence intensity compared to the control. These results validate performance of the optical coding in urine with a good specificity and selectivity.
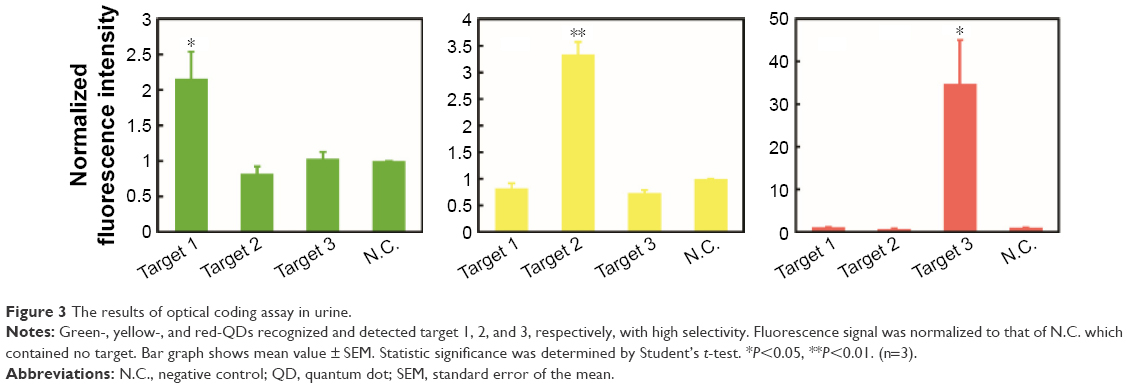 | Figure 3 The results of optical coding assay in urine. |
Test in prostate cancer cells
To confirm that our optical coding assay can be used for detection of fusion genes expressed by the prostate cancer cells, we collected the total RNA from NCl-H660 cells. NCl-H660 cells are known to highly express target 1 and target 3 sequences.15 We also selected another cell line, LNCaP, that does not express the target gene.16 Although the LNCaP and NCI-H660 cell lines were derived from the same metastatic lesions (lymph node), they showed significant differences in ERG gene expression.17,18 Moreover NCI-H660 is androgen receptor-negative cell line, therefore it has been considered as a hormone-refractory prostate cancer.15
After culturing cells in a complete media, we lysed the cells and isolated the total RNA. The purified RNAs were quantified and used for the optical coding assay and RT-PCR. Our optical coding assay results showed that target 3 was highly expressed in NCl-H660 cells, with an elevated red-QD signal (about 3-fold) compared to that of LNCaP. Additionally, target 1 was moderately expressed in NCI-H660, with about 1.4-fold higher green-QD signal than for LNCaP. However, target 2 was not detected from both cell lines (Figure 4). To verify the selectivity of the assay, the expression of target 1 and 3 fusion genes from NCI-H660 and LNCaP cells was analyzed by RT-PCR, and the result agrees quite well with the optical coding assay (Figure 5A). The result from a gel electrophoresis of PCR products showed that only NCI-H660 lysate presented the desired bands (at around 600 bp for target 3 and 700 bp for target 1). Additionally, we confirmed that the DNA bands corresponded to each target fusion gene by DNA sequencing analysis (Figures S3–S5). The relative expression level of TMPRSS2–ERG was also analyzed in a semi-quantitative manner (Figure 5B). Interestingly, the trend of normalized TMPRSS2–ERG expression level was in a good accordance with the result of the optical coding assay. In conclusion, these experiments support the result of our optical coding assay, which indicates that our assay can specifically detect fusion genes in various biologic samples.
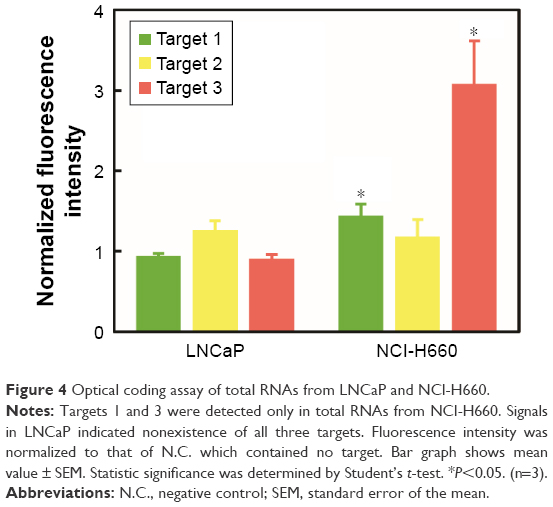 | Figure 4 Optical coding assay of total RNAs from LNCaP and NCl-H660. |
 | Figure 5 RT-PCR analysis of TMPRSS2–ERG in total RNAs from LNCaP and NCI-H660 cell lines. |
Conclusion
Our assay was able to identify three different types of fusion gene with a wide detection range and detection limit of 1 fmol. Here we showed simultaneous detection of multiple TMPRSS2–ERG fusion genes using color-coded oligonucleotides in a single assay. The assay required 60 minutes incubation to selectively and optically detect three different fusion genes at various concentrations. We verified diagnostic applications of QD-based assay in various biologic solutions (buffer, cell lysate, and urine). QDs exhibit unique optical properties such as high quantum yield, minimal photobleaching, and narrow emission peaks, which are ideal for multiplexing. We anticipate that QD-based assay for genetic biomarker can provide a new set of tools that are available to biologists and biomedical engineers.
Acknowledgments
This research was supported by the Bio & Medical Technology Development Program of the National Research Foundation of Korea (NRF) funded by the Korean government, Ministry of Science, ICT and Future Planning (NRF-2015M3A9E2029265). H Lee was supported by Basic Science Research Program through the NRF funded by the Ministry of Education (NRF-2016R1A6A3A04009677).
Disclosure
The authors report no conflicts of interest in this work.
References
Mitelman F, Johansson B, Mertens F. The impact of translocations and gene fusions on cancer causation. Nat Rev Cancer. 2007;7(4):233–245. | ||
Mertens F, Johansson B, Fioretos T, Mitelman F. The emerging complexity of gene fusions in cancer. Nat Rev Cancer. 2015;15(6):371–381. | ||
Demichelis F, Fall K, Perner S, et al. TMPRSS2:ERG gene fusion associated with lethal prostate cancer in a watchful waiting cohort. Oncogene. 2007;26(31):4596–4599. | ||
Tomlins SA, Bjartell A, Chinnaiyan AM, et al. ETS gene fusions in prostate cancer: from discovery to daily clinical practice. Eur Urol. 2009;56(2):275–286. | ||
Tomlins SA, Aubin SM, Siddiqui J, et al. Urine TMPRSS2:ERG fusion transcript stratifies prostate cancer risk in men with elevated serum PSA. Sci Transl Med. 2011;3(94):94ra72. | ||
Setlur S, Mertz K, Hoshida Y, et al. TMPRSS2-ERG fusion prostate cancer is a molecularly distinct estrogen-sensitive subclass of aggressive prostate cancer. Cancer Res. 2008;68(9 Suppl):4567. | ||
Wang J, Cai Y, Ren C, Ittmann M. Expression of variant TMPRSS2/ERG fusion messenger RNAs is associated with aggressive prostate cancer. Cancer Res. 2006;66(17):8347–8351. | ||
Lu B, Maqsodi B, Yang W, et al. Detection of TMPRSS2-ERG fusion gene expression in prostate cancer specimens by a novel assay using branched DNA. Urology. 2009;74(5):1156–1161. | ||
Bustin SA, Nolan T. Pitfalls of quantitative real-time reverse-transcription polymerase chain reaction. J Biomol Techn. 2004;15(3):155–166. | ||
Shiao YH. A new reverse transcription-polymerase chain reaction method for accurate quantification. BMC Biotechnol. 2003;3(1):22. | ||
Smith AM, Dave S, Nie S, True L, Gao X. Multicolor quantum dots for molecular diagnostics of cancer. Expert Rev Mol Diagn. 2006;6(2):231–244. | ||
Kim C, Searson PC. Magnetic bead-quantum dot assay for detection of a biomarker for traumatic brain injury. Nanoscale. 2015;7(42):17820–17826. | ||
Bilan R, Fleury F, Nabiev I, Sukhanova A. Quantum dot surface chemistry and functionalization for cell targeting and imaging. Bioconjug Chem. 2015;26(4):609–624. | ||
Northrop BH, Frayne SH, Choudhary U. Thiol-maleimide “click” chemistry: evaluating the influence of solvent, initiator, and thiol on the reaction mechanism, kinetics, and selectivity. Polym Chem. 2015;6(18):3415–3430. | ||
Mertz KD, Setlur SR, Dhanasekaran SM, et al. Molecular characterization of TMPRSS2-ERG gene fusion in the NCI-H660 prostate cancer cell line: a new perspective for an old model. Neoplasia. 2007;9(3):200–206. | ||
Zammarchi F, Boutsalis G, Cartegni L. 5′ UTR control of native ERG and of Tmprss2:ERG variants activity in prostate cancer. PLoS One. 2013;8(3):e49721. | ||
Horoszewicz JS, Leong SS, Kawinski E, et al. LNCaP model of human prostatic carcinoma. Cancer Res. 1983;43(4):1809–1818. | ||
Beltran H, Rickman DS, Park K, et al. Molecular characterization of neuroendocrine prostate cancer and identification of new drug targets. Cancer Discov. 2011;1(6):487–495. |
Supplementary materials
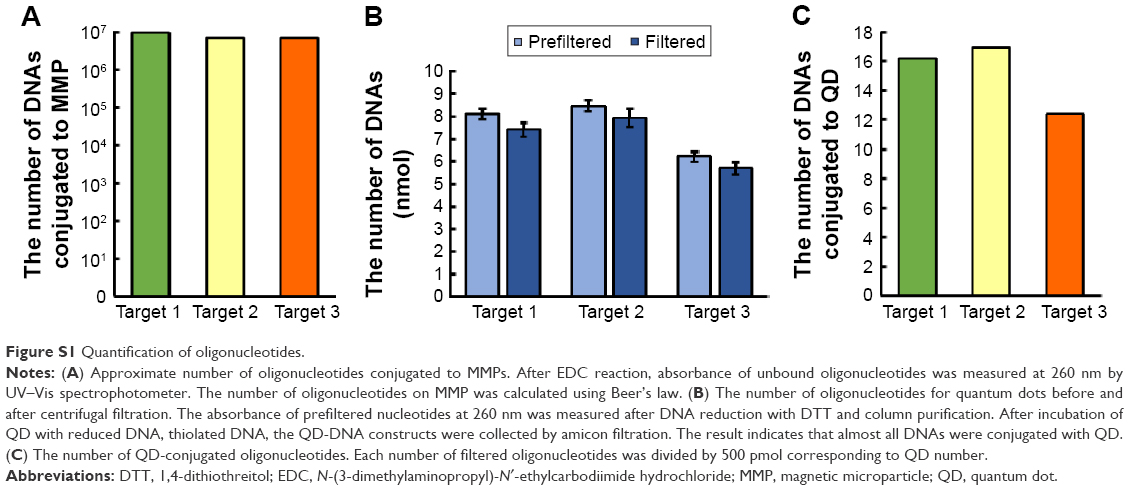 | Figure S1 Quantification of oligonucleotides. |
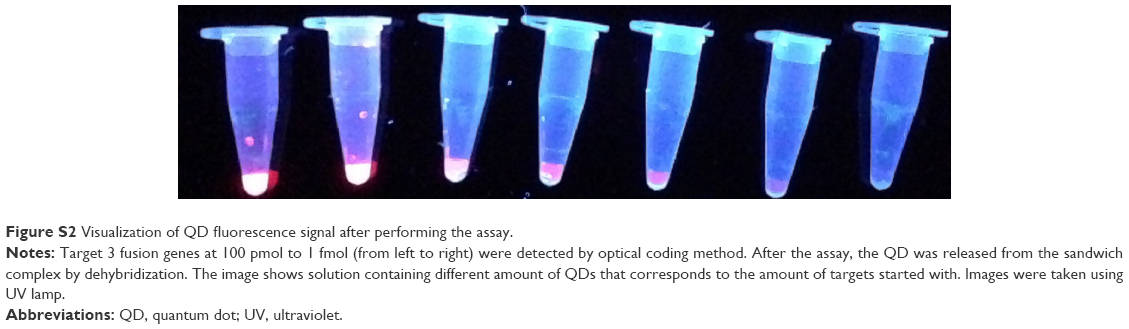 | Figure S2 Visualization of QD fluorescence signal after performing the assay. |
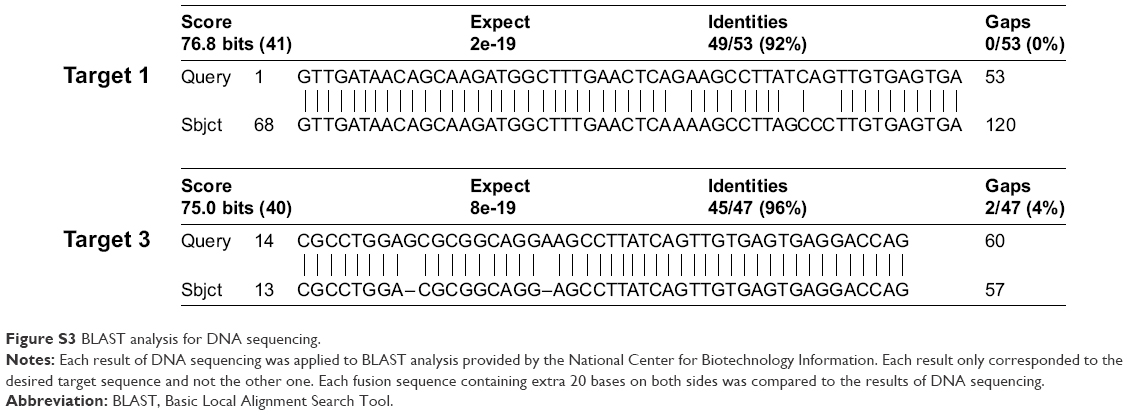 | Figure S3 BLAST analysis for DNA sequencing. |
 | Figure S4 DNA sequencing result of NCI-H660 cell PCR product for target 1. |
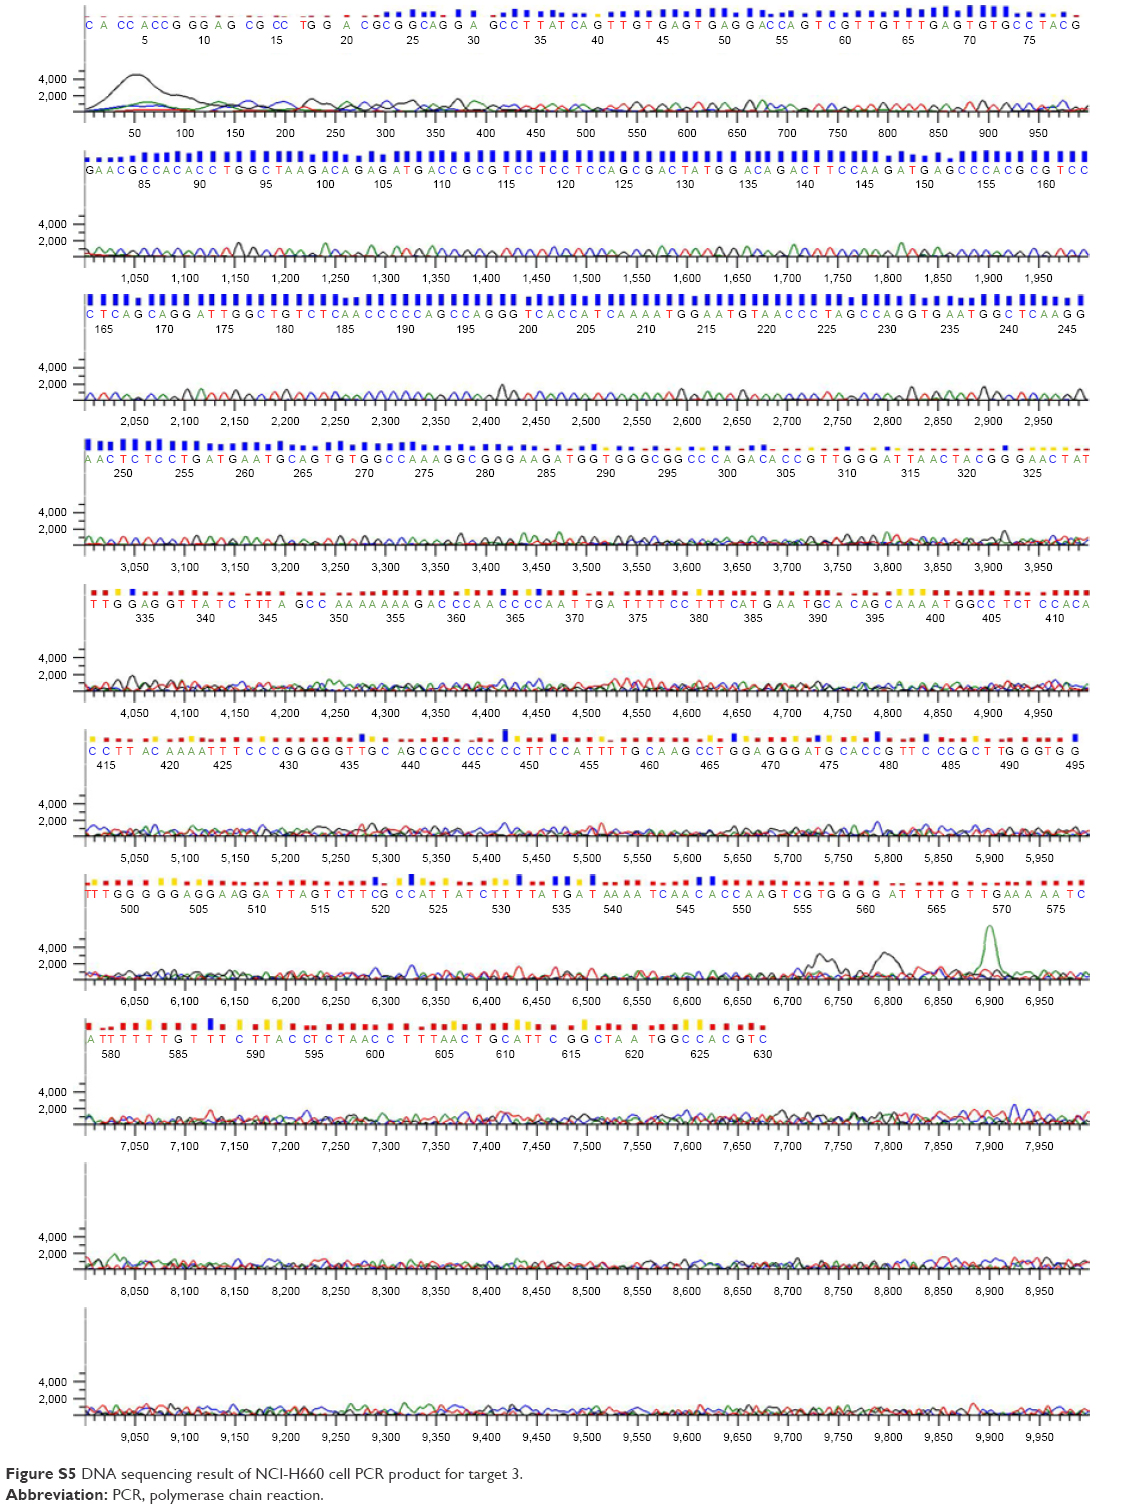 | Figure S5 DNA sequencing result of NCI-H660 cell PCR product for target 3. |
 © 2017 The Author(s). This work is published and licensed by Dove Medical Press Limited. The
full terms of this license are available at https://www.dovepress.com/terms
and incorporate the Creative Commons Attribution
- Non Commercial (unported, 3.0) License.
By accessing the work you hereby accept the Terms. Non-commercial uses of the work are permitted
without any further permission from Dove Medical Press Limited, provided the work is properly
attributed. For permission for commercial use of this work, please see paragraphs 4.2 and 5 of our Terms.
© 2017 The Author(s). This work is published and licensed by Dove Medical Press Limited. The
full terms of this license are available at https://www.dovepress.com/terms
and incorporate the Creative Commons Attribution
- Non Commercial (unported, 3.0) License.
By accessing the work you hereby accept the Terms. Non-commercial uses of the work are permitted
without any further permission from Dove Medical Press Limited, provided the work is properly
attributed. For permission for commercial use of this work, please see paragraphs 4.2 and 5 of our Terms.