Back to Archived Journals » Current Biomarker Findings » Volume 4
Obesity is associated with higher 4E-BP1 expression in endometrial cancer
Authors Falk Libby E, Azrad M, Novak L, Vazquez AI, Wilson TR, Demark-Wahnefried W
Received 25 August 2013
Accepted for publication 29 October 2013
Published 15 January 2014 Volume 2014:4 Pages 1—7
DOI https://doi.org/10.2147/CBF.S53530
Checked for plagiarism Yes
Review by Single anonymous peer review
Peer reviewer comments 3
Emily Falk Libby,1,* Maria Azrad,1,* Lea Novak,2 Ana I Vazquez,3 Tamara R Wilson,1 Wendy Demark-Wahnefried1
1Department of Nutrition Sciences, 2Department of Pathology, 3Department of Biostatistics, University of Alabama at Birmingham, Birmingham, AL, USA
*These authors contributed equally to this work
Purpose: Obesity is associated with risk and prognosis of endometrial cancer (EC), and the mammalian target of rapamycin complex 1 (mTORC1) pathway may play an instrumental role. We sought to explore the associations between cellular proliferation, Akt, and 4E binding protein-1 (4E-BP1) (a downstream target of mTORC1), in obese and nonobese women with and without EC.
Methods: Archival tissue-specimens from endometrial biopsies were grouped into two broad categories based on the observed disease behavior and similarities in tissue staining patterns: benign/hyperplasia (without cytologic atypia) (n=18) versus atypia (complex hyperplasia with cytologic atypia)/carcinoma (n=25). The characteristics of the study population, including height and weight to determine body mass index (BMI: kg/m2), were abstracted from medical records. Immunohistochemistry was used to assess the phosphorylated (p)Akt, p4E-BP1, and antigen Ki67.
Results: Cytoplasmic and nuclear pAkt were significantly associated with cytoplasmic p4E-BP1 (ρ=+0.48, ρ=+0.50) (P<0.05) and nuclear p4E-BP1 (ρ=+0.40, ρ=+0.44) (P<0.05); cytoplasmic and nuclear p4E-BP1 were significantly associated with Ki67 (ρ=+0.46, ρ=+0.59) (P<0.05). Compared with the benign/hyperplasia group, the women with atypia/carcinoma had significantly higher cytoplasmic and nuclear p4E-BP1 and Ki67. This staining pattern was similar in obese women; however, in nonobese women, neither cytoplasmic nor nuclear p4E-BP1staining differed between benign/hyperplasia versus atypia/carcinoma.
Conclusion: The activation of 4E-BP1 was higher in the obese women with EC. Adiposity may be a key factor to consider in future studies investigating the role of 4E-BP1 as a biomarker and therapeutic target in EC.
Keywords: mTORC1, immunohistochemistry, gynecologic malignancy, corpus uterine, BMI, biomarker
Introduction
Endometrial cancer (EC) is the most common gynecologic cancer in the United States. This year, approximately 47,000 American women will be diagnosed with this malignancy.1 EC was among the first malignancies to be linked with obesity, and there is consensus that excess adiposity is a major risk factor for the disease.2 Overweight and obese women are two to three times more likely to develop EC compared with women of normal weight.3 Given that 64% of American women are overweight or obese and therefore, at risk for EC, there is a critical need to better understand the molecular mechanisms and associated biomarkers linking excess adiposity with this prevalent disease.4
Obesity alters the hormonal milieu in ways that can promote the development of EC. The higher concentrations of estrogen seen in overweight and obese postmenopausal women are recognized as a major risk factor for developing precancerous and cancerous lesions of the uterus.3 The results of several recent laboratory and epidemiological studies suggest that other endocrine-related mechanisms associated with adiposity may also be linked with EC.5 Insulin and leptin stimulate the proliferation of EC cells in vitro6,7 and positively correlate with endometrial cell proliferation rates in the normal tissue of women who are normal weight, overweight, and obese.8 In contrast, adiponectin, which is typically reduced with excess adiposity,9 may be protective against EC, by inducing cell cycle arrest and apoptosis.10
The hormonal disturbances associated with obesity can mediate cell proliferation via intracellular signaling pathways. At the molecular level, insulin and leptin both phosphorylate and activate Akt, which in turn activates the mammalian target of rapamycin (mTOR) complex 1 (mTORC1), a key pathway that links growth factors, hormones, and energy balance with cell proliferation.11 Conversely, adiponectin has been shown to inhibit mTORC1, partly through dephosphorylation of Akt via the activation of adenosine monophosphate (AMP)-activated protein kinase (AMPK).12 One of the downstream targets of mTORC1 is the eukaryotic initiation factor 4E (elF4E)/eukaryotic initiation factor 4E binding protein-1 (4E-BP1) complex. When phosphorylated by mTORC1, 4E-BP1 releases eIF4E, a key mediator of messenger ribonucleic acid (mRNA) translation and protein synthesis, resulting in increased cell growth and proliferation.13 Thus, the upstream phosphorylation of Akt by growth factors and the downstream phosphorylation of 4E-BP1 are biomarkers, not only of mTORC1 activity, but also of cell growth and proliferation.11
Previous studies have shown that activation of the Akt/mTOR pathway is involved in EC and that this pathway is a potential therapeutic target for the disease.14–16 Further, the activation of 4E-BP1 has been linked to poorer EC prognosis, rendering it a plausible candidate for biomarker development.17–19 However, the role that obesity, a modifiable risk factor for EC, plays in mTORC1 signaling is unclear. Thus, we performed an exploratory study to examine the associations between phosphorylated (p)Akt, phosphorylated 4E-BP1 (p4E-BP1), and cellular proliferation rates (indicated by the cell marker antigen Ki67), in women with and without disease, seeking to determine whether there were differences between obese and nonobese women. In addition, we used data available from The Cancer Genome Atlas (TCGA)20 to test whether there were differences in the gene expression of Akt and 4E-BP1, between obese and nonobese women.
Methods
Study population
This study was approved by the University of Alabama at Birmingham (UAB) Institutional Review Board and conforms to the Code of Ethics of the World Medical Association (Declaration of Helsinki). Women who underwent endometrial biopsy at UAB Hospital between 2009 and 2010 were identified via medical records. Their histological diagnoses were obtained from the surgical pathology reports. Patients with normal endometrium (benign), hyperplasia without cytologic atypia, complex hyperplasia with cytologic atypia (CAH), and type 1 endometriod EC, International Federation of Gynecology and Obstetrics (FIGO) stage I–III were identified. A UAB gynecologic pathologist (LN) reviewed all the hematoxylin and eosin-stained (H&E) slides for concordance with the surgical pathology reports. All the patients diagnosed with CAH or cancer elected hysterectomy. The surgical pathology reports and H&E slides were obtained from hysterectomy tissues to confirm biopsy diagnoses. The women who had recurrent EC or diagnoses of other cancers were excluded.
Height, weight, race, age, menstrual history, parity, medication use, and comorbid conditions were abstracted from the medical records. Height and weight were used to calculate body mass index (BMI) (kg/m2).
Immunohistochemistry
First, 4–5 μm sections were cut from formalin-fixed paraffin-embedded tissue blocks. All the slides were labeled with a study identification number to protect patient identity. The slides were warmed at 60°C for 2 hours, cooled to room temperature, and submerged in three baths of laboratory grade xylene and graded alcohols, for 5 minutes each. The antigen retrieval was performed in a pressure cooker, in citric acid pH 6 for the phosphoproteins and in ethylenediaminetetraacetic acid (EDTA) buffer pH 9 for the Ki67. The endogenous peroxidases were quenched with 3% H2O2, and nonspecific antigen binding was blocked with 3% goat serum. Cell proliferation was determined with anti-Ki67 (Catalog number: PIMA515690; Thermo Fisher Scientific Inc, Waltham, MA, USA). The antibody was diluted 1:2000 in phosphate-buffered saline with 1% bovine serum albumin, 1 mM EDTA, and 1.5 mM sodium azide, pH 7.6 (PBE), applied to the slides and incubated for 1 hour at room temperature. The activation of Akt and 4E-BP1 was determined using antibodies specific for pAkt (Phospho-Akt [Ser473] [D9E] XP® Rabbit mAb #4060; Cell Signaling Technology Inc, Danvers, MA, USA) and p4E-BP1 (Phospho-4E-BP1 [Thr37/46] [236B4] Rabbit mAb #2855; Cell Signaling Technology Inc). The antibodies for the pAkt and p4E-BP1 were diluted 1:50 and 1:1000 in PBE, respectively, and incubated overnight at 4°C. A rabbit horseradish peroxidase conjugated secondary antibody diluted 1:200 was applied for 40 minutes at room temperature, and diaminobenzidine tetrahydrochloride was used to develop a brown stain to indicate the antigen–antibody complex. The sections were counterstained with hematoxylin, and the slides were subject to graded alcohol and xylene baths and then cover-slipped. For each case, a quality control or “delete slide” was processed without primary antibody but following the same procedure as above to confirm the nonspecific binding of the secondary antibody and background staining.
Evaluation of slides
The slides were evaluated and graded by a gynecologic pathologist (LN). For Ki67, the percentage of cells that stained positive was determined. For the cytoplasmic and nuclear staining of p4E-BP1 and pAkt, semiquantitative immunostaining scores were calculated. In this scoring method, the intensity of the staining (on a scale of 0–3, where 0= no staining and 3= highest intensity) and the proportion of cells stained were determined. The percentage of cells at each intensity was multiplied by the corresponding intensity value, and the scores were added together to obtain overall mean immunostaining scores.
Statistical and gene expression analyses
Like others who have found that the presence of atypia is a defining characteristic that cosegregates with more aggressive disease,21 we too observed that the tissue biomarker staining was more similar in the slides of women diagnosed with CAH and EC than with normal endometrium or hyperplasia without cytologic atypia. Therefore, we proceeded with an analysis of two groups: benign/hyperplasia (without cytologic atypia) and hyperplasia with cytological atypia/carcinoma. The between-group differences in the characteristics of the study sample were tested with independent t-tests, Fisher exact tests, or chi-square tests. Spearman correlation coefficients were used to assess the associations between the tissue biomarkers. Wilcoxon rank-sum tests were used to compare the biomarkers according to lesion type. Additionally, we used unpaired t-tests on data from TCGA to determine whether the gene expression of 4E-BP1 and Akt differed between overweight and obese women.20 Using the Illumina® Genome Analyzer IIx (Illumina Inc, San Diego, CA, USA) for RNA sequencing,22 level 3 gene expression data were available from the primary tumors of 228 subjects diagnosed with stage I–III endometrioid adenocarcinoma. Data analyses were performed using SAS version 9.3 (Cary Institute Inc, Cary, NC, USA). A P-value <0.05 was considered statistically significant.
Results
This study included 43 women with a mean age of 56.7±12.21 years who underwent endometrial biopsy as part of standard clinical care for abnormal uterine bleeding. The tumor characteristics and the characteristics of the study population are shown inTables 1 and 2, respectively. Overall, there were no significant differences in the study characteristics between the benign/hyperplasia (N=18) and atypia/carcinoma (N=25) groups.
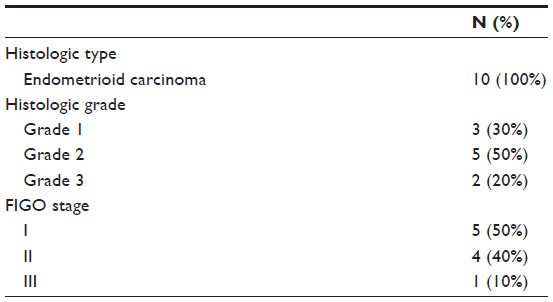 | Table 1 Tumor clinicopathologic characteristics |
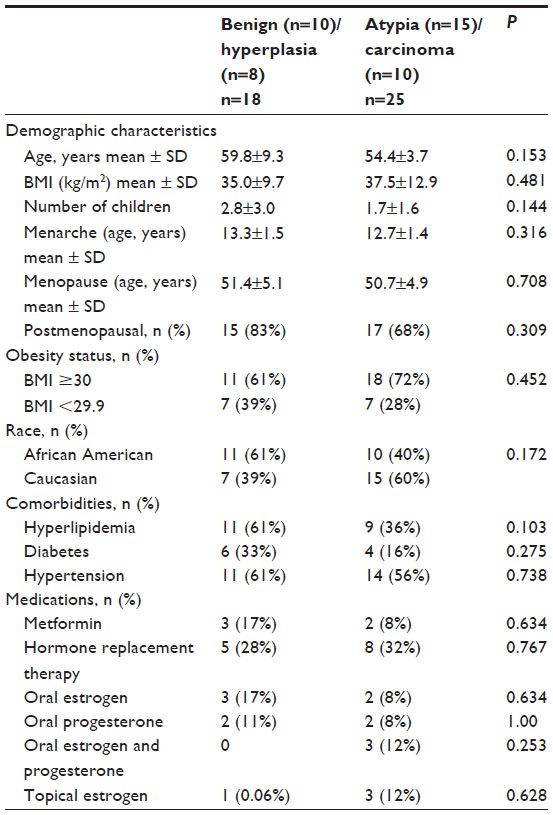 | Table 2 Characteristics of the study population |
Table 3 shows the Spearman correlation coefficients for the tissue biomarkers. Overall, cytoplasmic pAkt and nuclear pAkt were highly correlated, and both were significantly and positively correlated with cytoplasmic and nuclear p4E-BP1. Cytoplasmic p4E-BP1 and nuclear p4E-BP1 were highly correlated, and both were significantly and positively correlated with cellular proliferation as indicated by Ki67 staining.
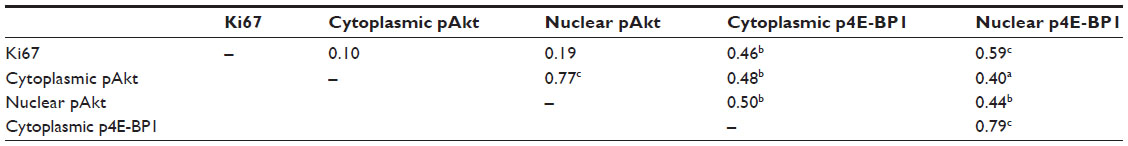 | Table 3 Overall Spearman correlation coefficients for tissue biomarkers |
As shown in Table 4, Ki67 and the nuclear and cytoplasmic p4E-BP1 were significantly higher in the atypia/carcinoma cases compared with the benign/hyperplasia cases. We observed no differences in pAkt between the groups. When stratified by BMI status, this same trend continued, with the obese women with atypia/carcinoma having significantly higher Ki67, and cytoplasmic and nuclear p4E-BP1. In the nonobese women, Ki67 also was significantly higher in the atypia/carcinoma group compared with the benign/hyperplasia group; however, unlike the obese women, no statistically significant differences in p4E-BP1 were found between the benign/hyperplasia versus atypia/carcinoma groups.
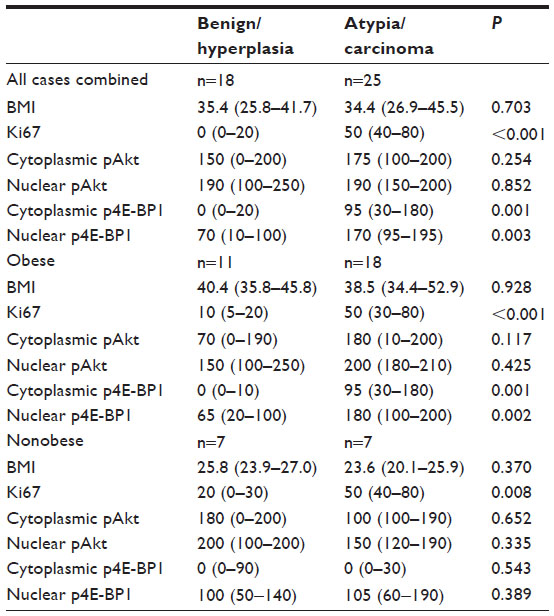 | Table 4 Overall and BMI-stratified comparison of Ki67, p4E-BP1 and pAkt between benign/hyperplasia versus atypia/carcinoma |
The roles of menopause and diabetes status on the marker expression levels are presented in Table 5. Ki67, and nuclear and cytoplasmic p4E-BP1 were significantly higher in postmenopausal and in nondiabetic women with atypia/carcinoma than in the women with benign/hyperplasia.
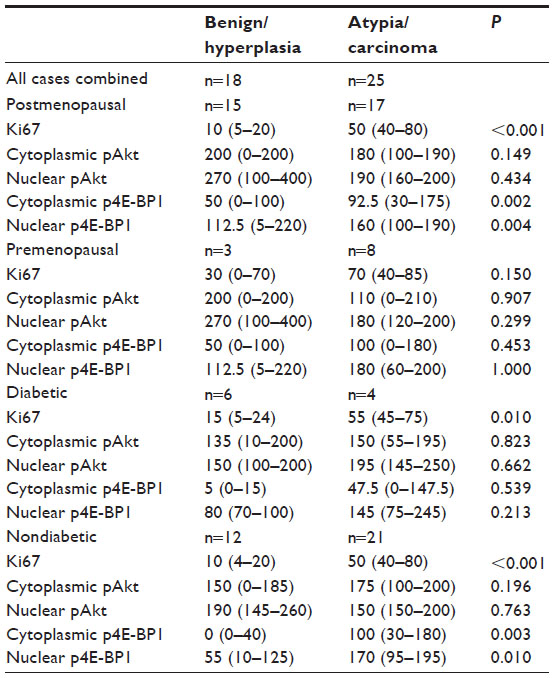 | Table 5 Menopause and diabetes-stratified comparison of Ki67, p4E-BP1 and pAkt between benign/hyperplasia versus atypia/carcinoma |
No differences in gene expression of 4E-BP1 and Akt were observed between overweight versus obese women in the dataset available through TCGA (data not shown). Similarly, no differences in the expression of these genes were observed in the analyses after excluding the pre- and perimenopausal women or when the women were stratified by race.
Discussion
This exploratory study provides evidence that the EC-related expression level of p4E-BP1, a downstream target of mTORC1, may differ between obese and nonobese women. To our knowledge, these findings are among the first to implicate obesity as a factor associated with higher activation of the mTORC1 signaling pathway in situ in EC. These results suggest that adiposity should be considered in future studies evaluating the utility of p4E-BP1 as an EC biomarker. Given that the mTORC1 pathway is currently considered an important therapeutic target for EC treatment14–16 and that there are several clinical trials currently underway to test the effectiveness of mTORC1 inhibitors in EC treatment (NCT01420081, NCT00703807, and NCT01205672),23–25 these results also suggest that adiposity is a potential modulating factor in the inhibition of 4E-BP1. Notably, the effect of obesity on the mTORC1 pathway appears to occur at the posttranslational level, through phosphorylation, and not at the gene expression level, as indicated by our results, using data from TCGA.
Overall, we found strong positive correlations between pAkt, p4E-BP1, and Ki67. Our data support previous findings that the phosphoinositide 3-kinase (PI3k)/Akt/mTORC1 pathway is a critical intracellular signaling pathway in EC cells.26,27 Over 80% of type 1 endometrioid ECs, which account for the preponderance of EC cases (70%–80%),28 are characterized by one or multiple alterations influencing this pathway.8 PI3k/Akt/mTORC1 signaling is less dominant in the other EC tumor subgroup, type 2 nonendometrial EC, in which p53 mutation, human epidermal growth factor receptor 2 (Her2)/neu overexpression, and p16 inactivation are most frequent.29 Nonetheless, it is noteworthy that mTORC1 activity has been linked to aggressive disease and poorer prognosis, regardless of the carcinoma type,17 suggesting that genetic alteration is not the only factor behind EC-associated mTORC1 signaling. Interestingly, we observed that Akt was not directly associated with Ki67, nor was it higher in the atypia/carcinoma versus the benign/hyperplasia group. These findings differ from those of Abe et al who reported that nuclear pAkt was higher in EC versus normal endometrium and hyperplasia, and that nuclear pAkt was higher in well-differentiated carcinoma versus moderately and poorly differentiated cancer.26 In contrast, another study, among patients with advanced EC, found that pAkt was positively correlated with Ki67 and reduced survival.27 The discrepancy between our findings and these other studies may be due to differences in sample characteristics. For instance, our study sample was comprised of both pre- and postmenopausal women with early-stage disease, whereas other studies were conducted primarily on premenopausal women and those with advanced EC.26,27 Thus, tissue biomarkers may vary across populations due to the hormonal fluctuations associated with menstruation, adiposity, and/or stage of disease.
The activation of both cytoplasmic and nuclear Akt was highly correlated with p4E-BP1. p4E-BP1 was significantly higher in atypia/carcinoma versus benign/hyperplasia and was significantly correlated with Ki67. It is thus plausible that the activation of Akt stimulates mTORC1 signaling and the activation of 4E-BP1, resulting in increased cellular proliferation. Similar to the findings by Castellvi et al, we observed high cytoplasmic p4E-BP1 staining in atypia/carcinoma and light staining in benign/hyperplasia.17 We also observed positive nuclear staining for p4E-BP1 in both benign/hyperplasia and atypia/carcinoma, although it was significantly higher in atypia/carcinoma. When stratified by weight status, as expected, we observed that obese women diagnosed with atypia/carcinoma had significantly higher cytoplasmic and nuclear p4E-BP1 than did obese women with benign/hyperplasia. However, in nonobese women, we did not observe significant differences in either cytoplasmic or nuclear p4E-BP1staining between women with atypia/carcinoma compared with benign/hyperplasia. This observation is particularly notable given that both obesity30 and the activation of 4E-BP117–19 are factors linked with poor EC prognosis. Based on these findings, we speculate that the biological factors associated with obesity, such as hormonal disturbances, may be a driving force in the activation of 4E-BP1 in obese women with EC and that such forces are absent in the nonobese. However, given our results that 4E-BP1 expression levels also differed by menopause and diabetes status in the women with atypia/carcinoma versus benign/hyperplasia, we cannot rule out the possibility that diabetes, a consequence of obesity, or menopause-related hormonal changes, which may alter mTORC1 signaling, underlie this relationship.
We acknowledge that a main limitation of this study was its relatively small sample size. Given that we had difficulty discovering patients who were not overweight or obese, this was particularly so in the normal body weight group. Thus, our ability to detect differences was likely underpowered and precluded subgroup analyses. Relatedly, we categorized the diagnosis at endometrial biopsy into two groups, benign/hyperplasia and atypia/carcinoma, whereas a larger study population would have allowed for analysis of each diagnosis separately. However, atypia and carcinoma was a logical pairing grounded in previous work21 and our own observations of similarities in tissue biomarker staining. In addition, while we chose to analyze the p4E-BP1 expression level based on the literature indicating that this form of the protein is, not only highly correlated to mTOR pathway activity,31 but also associated with EC aggressiveness17,19 and survival,17 the characterization of total 4E-BP1 protein or mRNA would be of interest in future study. Due to the retrospective design of our study, a further limitation was that we were unable to obtain additional, potentially useful data, such as the stage of menstrual cycle at biopsy, for the premenopausal women in our study population. We also acknowledge that the archival tissue specimens could be subject to variations in processing and storage, thus potentially affecting marker expression. However, we believe that using clinical biopsy tissue specimens that were directly submerged into formalin fixative and then embedded in paraffin adequately preserved the tissue and biomarkers of interest, and there was no suggestion that data were affected by the length of storage. Further, we used tissue samples from within a 2-year period to reduce the potential that time and storage could cause alterations in biomarkers. To preserve the immunoreactivity of the tissue, sections were cut a maximum of 24 hours before the staining.
Conclusion
Overall, a key strength of this study is its novelty, as it is among the first to consider obesity status as a factor associated with mTORC1 signaling in situ. Our findings confirm that activation of 4E-BP1 is higher in preneoplastic and neoplastic lesions, and suggest that an elevated activation of 4E-BP1 is more characteristic of obese versus nonobese women with these lesions. Larger samples sizes and further investigation is necessary as additional insight into these associations may provide new opportunities for prevention, treatment, and control of EC.
Acknowledgments
The authors would like to acknowledge Douglas R Hurst for his helpful comments and discussion, and the following funding sources: R25 CA047888 and P30 CA13148.
Disclosure
The authors report no conflicts of interest in this work.
References
seer.cancer.gov [homepage on the Internet]. SEER stat fact sheets: endometrial cancer. National Cancer Institute; 2013 [cited August 21, 2013]. Available from: http://seer.cancer.gov/statfacts/html/corp.html. Accessed November 7, 2013. | |
Renehan AG, Tyson M, Egger M, Heller RF, Zwahlen M. Body-mass index and incidence of cancer: a systematic review and meta-analysis of prospective observational studies. Lancet. 2008;371(9612):569–578. | |
Fader AN, Arriba LN, Frasure HE, von Gruenigen VE. Endometrial cancer and obesity: epidemiology, biomarkers, prevention and survivorship. Gynecol Oncol. 2009;114(1):121–127. | |
Flegal KM, Carroll MD, Ogden CL, Curtin LR. Prevalence and trends in obesity among US adults, 1999–2008. JAMA. 2010;303(3):235–241. | |
Crosbie EJ, Zwahlen M, Kitchener HC, Egger M, Renehan AG. Body mass index, hormone replacement therapy, and endometrial cancer risk: a meta-analysis. Cancer Epidemiol Biomarkers Prev. 2010;19(12):3119–3130. | |
Nagamani M, Stuart CA. Specific binding and growth-promoting activity of insulin in endometrial cancer cells in culture. Am J Obstet Gynecol. 1998;179(1):6–12. | |
Sharma D, Saxena NK, Vertino PM, Anania FA. Leptin promotes the proliferative response and invasiveness in human endometrial cancer cells by activating multiple signal-transduction pathways. Endocr Relat Cancer. 2006;13(2):629–640. | |
Villavicencio A, Aguilar G, Argüello G, et al. The effect of overweight and obesity on proliferation and activation of AKT and ERK in human endometria. Gynecol Oncol. 2010;117(1):96–102. | |
Kern PA, Di Gregorio GB, Lu T, Rassouli N, Ranganathan G. Adiponectin expression from human adipose tissue: relation to obesity, insulin resistance, and tumor necrosis factor-alpha expression. Diabetes. 2003;52(7):1779–1785. | |
Cong L, Gasser J, Zhao J, Yang B, Li F, Zhao AZ. Human adiponectin inhibits cell growth and induces apoptosis in human endometrial carcinoma cells, HEC-1-A and RL95 2. Endocr Relat Cancer. 2007;14(3):713–720. | |
Zoncu R, Efeyan A, Sabatini DM. mTOR: from growth signal integration to cancer, diabetes and ageing. Nat Rev Mol Cell Biol. 2011;12(1):21–35. | |
Kim KY, Baek A, Hwang JE, et al. Adiponectin-activated AMPK stimulates dephosphorylation of AKT through protein phosphatase 2A activation. Cancer Res. 2009;69(9):4018–4026. | |
Gingras AC, Kennedy SG, O’Leary MA, Sonenberg N, Hay N. 4E-BP1, a repressor of mRNA translation, is phosphorylated and inactivated by the Akt(PKB) signaling pathway. Genes Dev. 1998;12(4):502–513. | |
Korets SB, Czok S, Blank SV, Curtin JP, Schneider RJ. Targeting the mTOR/4E-BP pathway in endometrial cancer. Clin Cancer Res. 2011;17(24):7518–7528. | |
Hanna RK, Zhou C, Malloy KM, et al. Metformin potentiates the effects of paclitaxel in endometrial cancer cells through inhibition of cell proliferation and modulation of the mTOR pathway. Gynecol Oncol. 2012;125(2):458–469. | |
Slomovitz BM, Coleman RL. The PI3K/AKT/mTOR pathway as a therapeutic target in endometrial cancer. Clin Cancer Res. 2012;18(21):5856–5864. | |
Castellvi J, Garcia A, Ruiz-Marcellan C, et al. Cell signaling in endometrial carcinoma: phosphorylated 4E-binding protein-1 expression in endometrial cancer correlates with aggressive tumors and prognosis. Hum Pathol. 2009;40(10):1418–1426. | |
Rice LW, Stone RL, Xu M, et al. Biologic targets for therapeutic intervention in endometrioid endometrial adenocarcinoma and malignant mixed müllerian tumors. Am J Obstet Gynecol. 2006;194(4):1119–1126; discussion 1126–1128. | |
Darb-Esfahani S, Faggad A, Noske A, et al. Phospho-mTOR and phospho-4EBP1 in endometrial adenocarcinoma: association with stage and grade in vivo and link with response to rapamycin treatment in vitro. J Cancer Res Clin Oncol. 2009;135(7):933–941. | |
tcga-data.nci.nih.gov [homepage on the Internet]. TCGA data portal overview. National Cancer Institute; 2013 [updated November 6, 2013; cited October 7, 2013]. Available from: https://tcga-data.nci.nih.gov/tcga/tcgaHome2.jsp. Accessed November 7, 2013. | |
Montgomery BE, Daum GS, Dunton CJ. Endometrial hyperplasia: a review. Obstet Gynecol Surv. 2004;59(5):368–378. | |
illumina.com [homepage on the Internet]. Genome Analyzer IIx. Illumina, Inc; 2013 [cited October 7, 2013]. Available from: http://www.illumina.com/systems/genome_analyzer_iix.ilmn. Accessed November 7, 2013. | |
Pfizer. A study of two dual PI3K/mTOR inhibitors, PF-04691502 and PF-05212384 in patients with recurrent endometrial cancer. Available from: http://www.clinicaltrials.gov/ct2/show/NCT00265317.” \t “_blank” http://clinicaltrials.gov/show/NCT01420081. NLM identifier: NCT01420081. Accessed November 20, 2013. | |
Yale University. Study of the weekly oral RAD001 in combination with oral Topotecan in patients with advanced or recurrent endometrial cancers. Available from http://clinicaltrials.gov/ct2/show/NCT00703807?term=NCT00703807&rank=1. NLM identifier NCT00703807. Accessed November 20, 2013. | |
M.D. Anderson Cancer Center. Metformin and endometrial cancer. Available from http://clinicaltrials.gov/ct2/show/NCT01205672?term=NCT01205672&rank=1. NLM identifier NCT00703807. Accessed. | |
Abe N, Watanabe J, Tsunoda S, Kuramoto H, Okayasu I. Significance of nuclear p-Akt in endometrial carcinogenesis: rapid translocation of p-Akt into the nucleus by estrogen, possibly resulting in inhibition of apoptosis. Int J Gynecol Cancer. 2011;21(2):194–202. | |
Uegaki K, Kanamori Y, Kigawa J, et al. PTEN-positive and phosphorylated-Akt-negative expression is a predictor of survival for patients with advanced endometrial carcinoma. Oncol Rep. 2005;14(2):389–392. | |
Cheung LW, Hennessy BT, Li J, et al. High frequency of PIK3R1 and PIK3R2 mutations in endometrial cancer elucidates a novel mechanism for regulation of PTEN protein stability. Cancer Discov. 2011;1(2):170–185. | |
O’Hara AJ, Bell DW. The genomics and genetics of endometrial cancer. Adv Genomics Genet. 2012;2012(2):33–47. | |
McTiernan A, Irwin M, Vongruenigen V. Weight, physical activity, diet, and prognosis in breast and gynecologic cancers. J Clin Oncol. 2010;28(26):4074–4080. | |
Dudkin L, Dilling MB, Cheshire PJ, et al. Biochemical correlates of mTOR inhibition by the rapamycin ester CCI-779 and tumor growth inhibition. Clin Cancer Res. 2001;7(6):1758–1764. |
 © 2014 The Author(s). This work is published and licensed by Dove Medical Press Limited. The
full terms of this license are available at https://www.dovepress.com/terms
and incorporate the Creative Commons Attribution
- Non Commercial (unported, 3.0) License.
By accessing the work you hereby accept the Terms. Non-commercial uses of the work are permitted
without any further permission from Dove Medical Press Limited, provided the work is properly
attributed. For permission for commercial use of this work, please see paragraphs 4.2 and 5 of our Terms.
© 2014 The Author(s). This work is published and licensed by Dove Medical Press Limited. The
full terms of this license are available at https://www.dovepress.com/terms
and incorporate the Creative Commons Attribution
- Non Commercial (unported, 3.0) License.
By accessing the work you hereby accept the Terms. Non-commercial uses of the work are permitted
without any further permission from Dove Medical Press Limited, provided the work is properly
attributed. For permission for commercial use of this work, please see paragraphs 4.2 and 5 of our Terms.