Back to Journals » Clinical Ophthalmology » Volume 14
Morphologic Classifications and Locations of Microaneurysms and Clinical Relevance in Branch Retinal Vein Occlusion
Authors Esaki Y, Hirano Y ![]() , Kurobe R
, Kurobe R ![]() , Yasuda Y, Tomiyasu T, Suzuki N, Yasukawa T
, Yasuda Y, Tomiyasu T, Suzuki N, Yasukawa T ![]() , Yoshida M
, Yoshida M ![]() , Ogura Y
, Ogura Y
Received 26 April 2020
Accepted for publication 15 June 2020
Published 6 July 2020 Volume 2020:14 Pages 1909—1919
DOI https://doi.org/10.2147/OPTH.S258958
Checked for plagiarism Yes
Review by Single anonymous peer review
Peer reviewer comments 4
Editor who approved publication: Dr Scott Fraser
Yuya Esaki, Yoshio Hirano, Ryo Kurobe, Yusuke Yasuda, Taneto Tomiyasu, Norihiro Suzuki, Tsutomu Yasukawa, Munenori Yoshida, Yuichiro Ogura
Department of Ophthalmology & Visual Science, Nagoya City University Graduate School of Medical Sciences, Nagoya, Japan
Correspondence: Yoshio Hirano
Department of Ophthalmology & Visual Science, Nagoya City University Graduate School of Medical Sciences, 1-Kawasumi, Mizuho-Cho, Mizuho-Ku, Nagoya 467-8601, Japan
Tel +81 52-8538251
Fax +81 52-8419490
Email [email protected]
Purpose: To classify microaneurysms (MAs) and investigate the relationships with retinal edema in eyes with branch retinal vein occlusion (BRVO).
Study Design: Retrospective, observational, consecutive case series.
Methods: Eyes with MAs due to BRVO that underwent optical coherence tomography angiography (OCTA) were enrolled. MAs on OCTA images were morphologically classified into six types: focal bulge, saccular, fusiform, mixed (saccular/fusiform), pedunculated, and irregular. The frequency, size, location, and relationships with retinal edema also were investigated.
Results: Twenty-four eyes of 23 patients (12 men, 11 women; mean age, 68.0 years) were enrolled. A total of 244 MAs were detected on the OCTA images. The focal bulge and saccular types accounted for over 70% of all MAs. Smaller MAs such as the focal bulge or saccular type also were detected both at the edge of the nonperfused areas (NPAs) and in collateral vessels. In contrast, larger MAs such as the pedunculated or irregular types tended to form at the edges of the NPAs. Older age, the presence of MAs in the collateral vessels, and the absence of pedunculated type were independent predictive factors for retinal edema but not the MA size, or presence in the retinal deep capillary plexus. After treatment, the mean retinal thickness decreased significantly, but the mean MA size remained unchanged.
Conclusion: OCTA enables morphologic classification, three-dimensional analysis, and investigation of the longitudinal changes of MAs with noninvasive volumetric quantification, leading to a better understanding of the pathology of MAs in eyes with BRVO.
Keywords: microaneurysm, morphology, macular edema, optical coherence tomography angiography, branch retinal vein occlusion
Introduction
We previously reported that microaneurysms (MAs) can cause refractory macular edema in patients with branch retinal vein occlusion (BRVO).1 Leakage from MAs was reported to be refractory to ranibizumab therapy.2 Additionally, the manifestations of leaking MAs were reported to lead to an increased number of intravitreal injections of ranibizumab (IVR) needed to sustain resolution of macular edema.3 Therefore, leaky MAs were treated by direct application of retinal laser photocoagulation (PC).1,4 It is also important to investigate which type of MAs can be leaked and require treated.
Fluorescein angiography (FA) has been the gold standard for examining microvascular abnormalities in various retinal diseases. FA can identify not only the presence of MAs but also leakage from the MAs. In fact, Dubow et al reported the classification of human retinal MAs using adaptive optics scanning light ophthalmoscopy (AOSLO) FA.5 However, FA provides incomplete information about the deep retinal capillary network.6,7 In addition, dense retinal hemorrhages and/or severe macular edema make interpretation of FA images difficult because of blocked or pooled fluorescein dye.6 Indocyanine green angiography (ICGA) also can detect MAs in several retinal diseases8,9 and provide more information about the deeper retinal capillary network than FA. However, MAs appear as dot-shaped hyperfluorescent spots on conventional FA and ICGA. It is difficult to classify the MAs morphologically using FA and/or ICGA because of the limited resolution and leakage from the MAs. In addition, FA and ICGA require dye injection, which makes clinicians hesitate to perform frequent examinations. In contrast, optical coherence tomography angiography (OCTA) enables morphologic classification of MAs as previously reported10 and three-dimensional analysis.6,10 OCTA can be performed frequently because it is a noninvasive procedure6,11 and enables longitudinal imaging of MAs.
The presence of MAs in the diabetic retinopathies is well known and has been studied in various ways. In contrast, MAs in eyes with BRVO are not well studied, although MA formation can cause refractory macular edema in eyes with BRVO.1–3 In the current study, we investigated the morphologic classification, location, and longitudinal changes of MAs after treatment and sought to identify any associations with retinal thickening, leading to a better understanding of the clinical significance and pathology of MAs in eyes with BRVO.
Methods
Study Design and Setting
The current was a retrospective, observational, consecutive case series conducted in an institutional setting. The Institutional Review Board of Nagoya City University approved the study protocol (No. 60180149). The clinical trial was registered in the University Hospital Medical Information Network Clinical Trials Registry (UMIN-ID, UMIN000033595). The research methods and analysis adhered to the tenets of the Declaration of Helsinki. This study was conducted at Nagoya City University Hospital between October 1, 2014, and November 30, 2017. The inclusion criteria were patients with BRVO and eyes with MAs. The exclusion criteria were patients whose images were too poor in quality to be analyzed because of ocular movements or cataracts, eyes with thick retinal hemorrhages or severe macular edema, or other retinal diseases. All participants provided written informed consent. We do not intend to share individual deidentified participant data.
Assessments
All patients underwent a complete ophthalmic examination including indirect ophthalmoscopy, fundus photography, OCT (RS-3000 Advance, Nidek, Gamagori, Japan), OCTA (RTVue XR Avanti, AngioVue, Optovue Inc., Fremont, CA), and FA and/or ICGA. OCTA Figures 3 x 3 mm in area centered on the fovea were analyzed. FA/ICGA was performed using a wide-field laser ophthalmoscope (Optos California, Nikon, Tokyo, Japan) and/or confocal SLO (Heidelberg Retina angiograph 2, Heidelberg Engineering, Heidelberg, Germany).
Two experienced retinal specialists (YE and YH) judged the MAs on the FA and OCTA images in a masked fashion. MAs were defined as hyperfluorescent dots on the FA images (Figure 1) and visible aneurysms on the OCTA images (Figure 1). The MAs on the OCTA images then were classified as focal bulge, saccular, fusiform, mixed saccular/fusiform, pedunculated, and irregular types (Figure 2) as previously reported.5 The presence or absence of leakage of the MAs was determined on the OCT and/or FA images. The three-dimensional MA location was investigated as follows. Regarding the vertical location, we checked the OCTA slabs of superficial and deep capillary layer and the B scans and determined the location (superficial, deep, or both). The superficial and deep capillary layer on the OCTA system was defined from internal limiting membrane to inner plexiform layer and from inner plexiform layer to outer plexiform layer, respectively. Regarding the horizontal location, we divided into three subtypes, ie, in the collaterals, at the edge of nonperfused areas (NPAs), or both.6,12,13 Collateral vessels were defined as dilated and tortuous capillaries occurring in pre-existing capillary beds and linking the obstructed vessel with the nearest patent vessel.12,14,15 The MAs in the collateral vessels were defined as the hyperfluorescent dots in the collateral vessels on FA images. The MAs at the edge between NPAs and perfused areas were defined as located at the edge of NPAs. The MAs in collateral vessels and at the edge of NPAs were defined as located in both.
 |
Figure 1 MAs in eye with BRVO. (A) Early-phase FA. (B) OCTA. The MAs (yellow circles in panel A) appear as dot-shaped hyperfluorescent spots on the FA image. It is difficult to classify the MAs morphologically using FA. In contrast, OCTA enables morphologic analysis of MAs (yellow circles in panel B). |
 |
Figure 2 Morphologic classification of MAs and their frequency in eyes with BRVO. (A) The morphologic classification of MAs using OCTA. (B) A circulate graph shows the percentage of each MA type. The respective numbers of each MA type are: focal bulge (n=101, 41.4%), saccular (n=71, 29.1%), mixed saccular/fusiform (n=36, 14.8%), pedunculated (n=15, 6.1%), fusiform (n=12, 4.9%), and irregular (n=9, 3.7%). (C) The mean size of each MA type. The focal bulge type is the smallest and the irregular type the largest of the six types. The irregular type is significantly larger than the other types. The focal bulge and saccular types are significantly (**P < 0.01, *P<0.05, respectively) smaller than the pedunculated type. |
OCT color maps were obtained using the RS-3000 Advance OCT system (Nidek Technologies). Thirty-three points covering the central 5 degrees were set (Figure 3), and the retinal thickness at each point was measured using software provided by Nidek. The retinal thickness of the nearest point to the MA location then was used as the one affected by the MA (Figure 3).
 |
Figure 3 MA classifications and their relationship with retinal edema. (A) OCTA. The yellow circle indicates a MA. (B) An OCT color map. Thirty-three points (white circles) covering the central 5 degrees were set and the retinal thickness of each point measured. (C) The mean retinal thickness around each MA type. There are no significant differences among the six types. (D) The percentages of each MA affecting the retinal thickness exceeding 350 µm. There are no significant differences among the six types. (E) The relation between the MA size and retinal thickness is not significant (r=0.002, P=0.977). (F and H) OCTA. (G and I) An OCT color map. Numerous small MAs (yellow circles in panels F and H) have formed in a limited area and caused macular edema (G and I), but one large MA (blue circle in panel H) does not (I). NS, not significant. |
We also measured the size of each MA using ImageJ software (version 1.50i, provided in the public domain by the National Institutes of Health, Bethesda, MD)16 before and after treatment. First, the 3 x 3-mm- area OCTA images were dragged and dropped into the software. The actual distance in pixels then was determined by measuring the side of the OCTA image. Thereafter, 3 mm on the image was set as 603 pixels. The MAs on the images were manually surrounded by a single examiner (YE) using “Polygon Selections” to calculate the size of the MAs, which were compared before and after treatment. More than 5 times measurements were performed and then averaged.
Two retinal specialists (YE and YH) in determined the BRVO subtype (major or macular BRVO) on the FA and/or OCTA images in a masked fashion. Major BRVO was defined as major branch retinal vein occlusion and macular BRVO as macular venule occlusion as previously described.17 NPAs exceeding 5 disc diameters were defined as the ischemic type and the others as the nonischemic type as previously described.18–20 Macular edema was defined as a central subfield retinal thickness exceeding 300 μm and retinal edema due to MA was defined as a retinal thickness exceeding 350 μm because MAs are located outside of the central subfield area and the parafoveal retinal thickness often exceeds 300 μm even if there is no macular edema.
Treatments
IVR (Lucentis, Novartis International AG, Basel, Switzerland) was the initial therapy for macular edema. Patients with a history of cerebral and/or myocardial infarction or those not wishing an IVR were treated with a sub-Tenon’s capsule injection of triamcinolone acetonide (STTA) (MaQaid, Wakamoto Pharmaceutical, Co., Ltd., Tokyo, Japan). All patients were followed monthly from the initial visit for longer than 6 months. Additional IVR injections were administered if the eyes had macular edema with a central subfield retinal thickness exceeding 300 μm. Retinal direct laser PC was applied to the leaky MAs causing the macular edema; retinal scatter PC was applied if retinal neovascularization was evident but was not applied for widespread NPAs.
Statistical Analysis
Statistical analyses were performed using EZR version 1.40 (Jichi Medical University, Saitama Medical Center, Saitama, Japan) and the significance level was set at P < 0.05. The post hoc Bonferroni correction was used to compare the MA size and changes after treatment and the retinal thickness around the MA. The independent χ2 test was used to compare the percentages of the MAs affecting the retinal thickening and the location of the MAs. Spearman’s rank correlation coefficient was used to evaluate the correlation between the MA size and retinal thickness. The paired t-test was used to compare the MA size and retinal thickness before and after treatment. Multiple regression analysis was performed to detect independent factors predictive of retinal edema. Specifically, the retinal thickness before treatment was set as an objective variable, and age, morphologic classification of the MA, MA size, and MA location before treatment were set as explanatory variables.
Results
Patients
Twenty-four eyes of 23 patients (11 men, 12 women; mean age, 68.0 years; range, 42–83 years) were enrolled. The patient characteristics are shown in Table 1. Macular and major BRVO were seen in seven and 17 eyes, respectively, and ischemic and nonischemic BRVO in eight and 16 eyes, respectively.
 |
Table 1 Demographics of the Study Population with Branch Retinal Vein Occlusion |
MA Classification
Two hundred forty-four MAs were identified and classified into six categories according to a previous report.5 The numbers of MAs in each classification were as follows: focal bulge (n=101, 41.4%), saccular (n=71, 29.1%), mixed saccular/fusiform (n=36, 14.8%), pedunculated (n=15, 6.1%), fusiform (n=12, 4.9%), and irregular (n=9, 3.7%) (Figure 2). The focal bulge and saccular types accounted for over 70% of all MAs. The focal bulge type was the smallest, and the irregular type was the largest (Figure 2). The irregular type was significantly larger than the other types. The focal bulge and saccular types were significantly smaller than the pedunculated type (Figure 2).
MA Classification and Relationship to Retinal Edema
No significant differences were seen among the mean retinal thicknesses in the six types (Figure 3). The numbers of MAs affecting the retinal thickness exceeding 350 µm were as follows: focal bulge (n=25, 24.8%), saccular (n=15, 21.1%), mixed saccular/fusiform (n=4, 11.1%), pedunculated (n=3, 20.0%), fusiform (n=4, 33.3%), and irregular (n=2, 22.2%) types (Figure 3). The MA size was not correlated significantly (r=0.002, P=0.977) with the retinal thickness (Figure 3). However, numerous small MAs, ie, the focal bulge or saccular types, formed in limited areas and did cause macular edema (Figure 3), but one large MA did not (Figure 3).
MA Locations and Relationships with Retinal Edema
Of the 244 MAs, 50 and 155 MAs, respectively, were in the retinal superficial capillary plexus and deep capillary plexus; 39 MAs extended between the superficial and deep capillary plexus. The details of the vertical locations are shown in Table 2. Seventy-nine MAs were at the edges of the NPAs, 62 MAs in the collateral vessels, and 103 MAs were both at the edge of NPAs and in the collateral vessels (Figure 4). The percentages of each horizontal location indicated that relatively small MAs such as the focal bulge or saccular types were similarly observed both at the edges of the NPAs and in the collateral vessels (Figure 4). In contrast, large MAs such as the pedunculated, fusiform, or irregular types were seen more frequently at the edges of the NPAs and rarely in the collateral vessels (Figure 4), although there were no significant differences among the six types (Figure 4). Alternatively, there were significant differences between the retinal thicknesses affected by the collateral vessels and NPAs (Figure 4).
 |
Table 2 Vertical Location of Microaneurysm in Each Type |
 |
Figure 4 The locations of MAs, frequency, and their relationship with retinal thickening. (A) OCTA shows the MA locations. The yellow circles indicate MAs. (B) The percentages of each location of each MA type. Relatively small MAs such as the focal bulge or saccular types are similarly observed both at the edges of the NPAs and in collateral vessels. In contrast, larger MAs such as the pedunculated, fusiform, or irregular types are seen more frequently at the edges of the NPAs and rarely in the collateral vessels, but there are no significant differences among the six types. (C) A comparison of the mean retinal thicknesses. Significant differences are seen between the collateral vessels and NPAs (**P=0.004), and between both of those and the NPAs (*P=0.013). Both indicates both at the edge of the NPAs and in the collateral vessels; NS, not significant. |
Changes in Size or Morphologies of MAs and Retinal Thicknesses Around the MAs Before and After Treatment
Longitudinal OCTA images of the MAs showed several changes in size or morphology of the MAs (Figure 5). However, there was no significant (P=0.972) difference in the mean size of the MAs before and after the treatments (Figure 5). In the current study, each eye received several therapies, ie, STTA, IVR, direct PC, and PC to treat the NPAs (Table 3). Therefore, the effect of each treatment on the changes in the MA size was not investigated. A morphologic analysis showed that only the focal bulge type of MA became significantly (*P=0.025) smaller after the treatments (Figure 5); the other types did not change significantly in size. Although there were no significant differences in the MA sizes before and after treatments, the mean retinal thicknesses around the MAs decreased significantly (**P=0.002) after treatment (Figure 5).
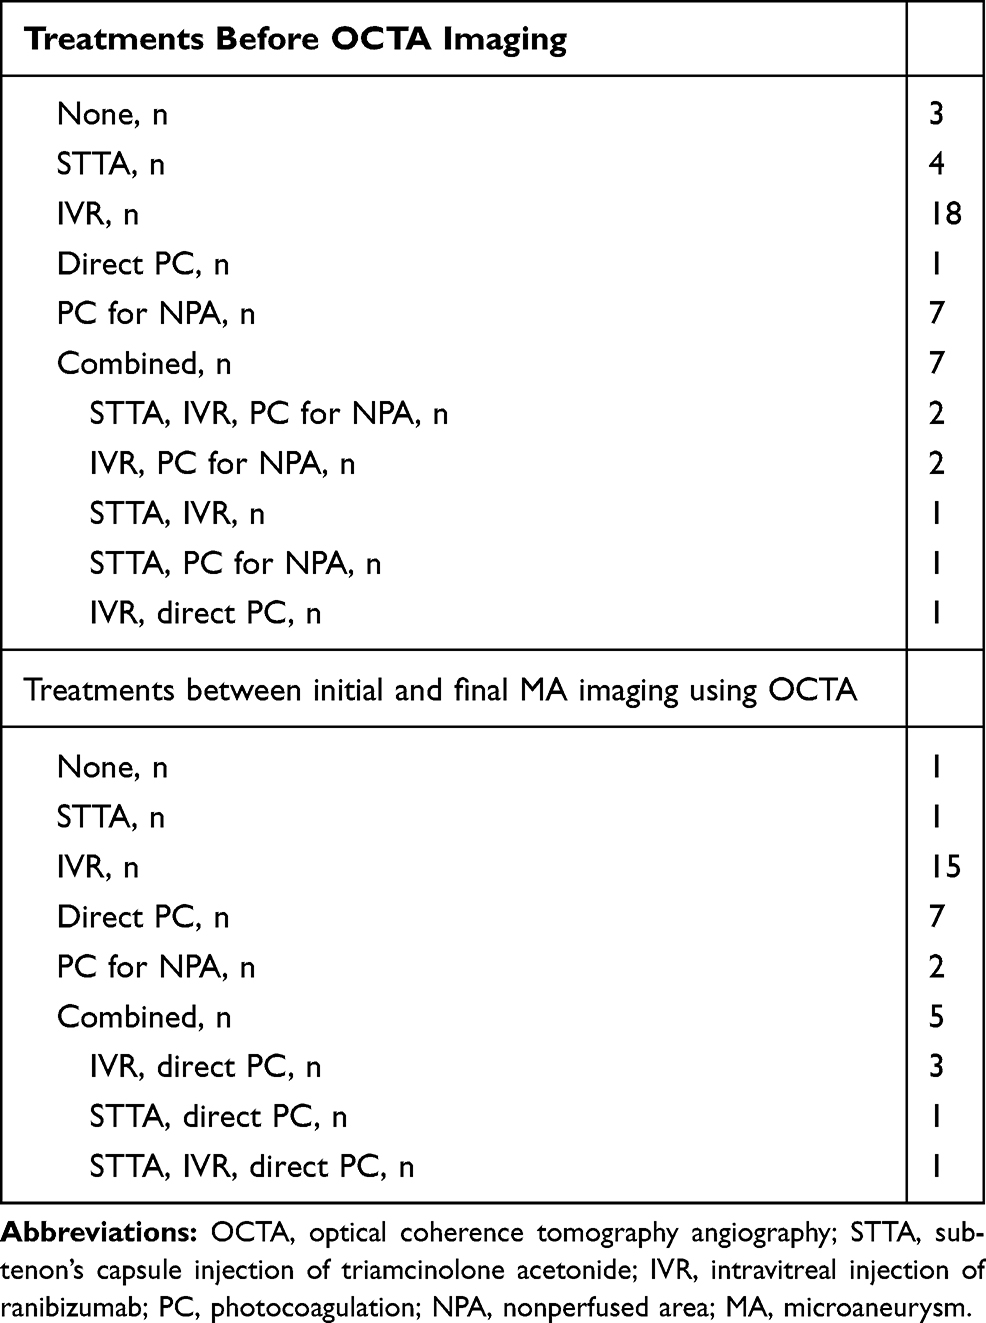 |
Table 3 Treatments for the Study Population with Branch Retinal Vein Occlusion |
 |
Figure 5 The longitudinal changes of the MAs detected by OCTAs. (A–C) OCTA images. The yellow circles indicate MAs. (A) The irregular type of MA is unchanged in size and type. (B) The saccular type of MA has grown and evolved to the irregular type. (C) The pedunculated type of MA has regressed and evolved to the saccular type. (D) The mean MA sizes before and after treatment. There are no significant differences. (E) The mean sizes of each MA type before and after treatment. A morphologic analysis shows that only the focal bulge type of MA became significantly (*P=0.025) smaller after treatment. The mean sizes of the other types, except for the focal bulge type, have not changed significantly. (F) The mean retinal thicknesses around the MAs before and after treatment. There are significant differences (**P=0.002). NS, not significant. |
Treatments
The details of the treatments are shown in Table 3. Before OCTA imaging, four and 18 eyes, respectively, were treated with STTA and IVR injection as initial therapies. Direct PC targeting of the MAs and scatter PC for the NPAs were performed in one and seven eyes, respectively. Three eyes were not treated before OCTA imaging. Seven eyes were treated with combined therapy (Table 3). Between the time when the initial and final OCTA images were obtained, STTA, IVR, direct PC, or scatter PC for NPAs were performed in one, 15, seven, and two eyes, respectively. One eye was not treated; five eyes received combined therapy (Table 3).
Multiple Regression Analysis
Older age, the presence of MAs in the collateral vessels or NPAs, and the absence of pedunculated type were analyzed as factors predictive of retinal edema by a univariate regression analysis (Table 4). The MA size and the presence of MA in the retinal deep capillary plexus were not (Table 4). A multivariate regression analysis demonstrated that older age, the presence of MAs in the collateral vessels, and the absence of pedunculated type were the independent predictive factors for retinal edema (Table 4).
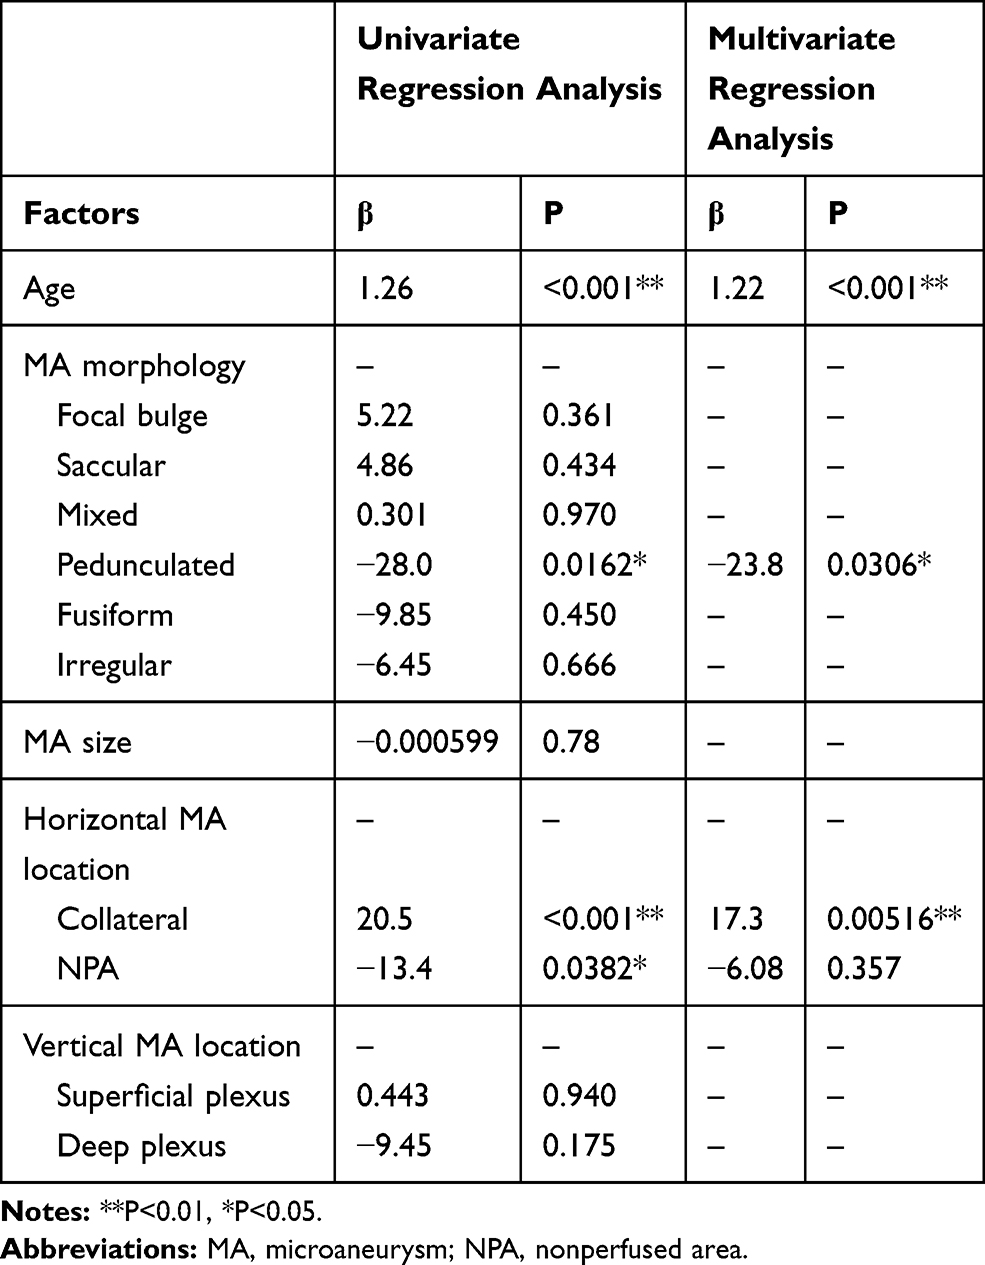 |
Table 4 Multiple Regression Analysis to Detect Factors Associated with Retinal Thickening |
Discussion
Previous studies6,21-23 have reported that OCTA was inferior to FA for detecting MAs, because some MAs did not meet the minimal blood flow velocity to achieve a positive flow signal.10 MAs on conventional FA images usually appear as hyperfluorescent dots, and it is difficult for MAs to be morphologically classified as previously reported.5,10 In contrast, OCTA images made the classification possible due to the higher resolution and the fact that it is a dye-free procedure without the possibility of dye leakage. A three-dimensional analysis also was possible using OCTA. In the current study, we classified MAs morphologically in eyes with BRVO into 6 types using OCTA and aimed to investigate the relationship with retinal edema. Consequently, we could not detect evident relationship between the morphology and retinal edema, but found several significant findings as follows.
First, we found that the focal bulge type developed most often and the focal bulge and saccular types accounted for over 70% of all MAs. In eyes with diabetic retinopathies, several previous studies using immunofluorescent staining of enucleated human retinas24 and in vivo imaging using AOSLO FA5 or OCTA10 have shown that most MAs were the saccular type. In eyes with BRVO, Dubow et al5 reported that the saccular type was the most similar to that in diabetic eyes, but only 13 MAs in two eyes were analyzed. Regarding the sizes of the MAs, the focal bulge type was the smallest and the irregular type was the largest of the six types. The saccular type also was relatively small and significantly smaller than the pedunculated and irregular types, both of which were the same as those reported previously5 using AOSLO FA, although the data in the current study cannot be compared with those in the previous study using AOSLO FA. However, the usefulness of the quantitative analysis of the vessel calibration using a commercial OCTA system (RTVue XR Avanti).25
Considering the relationship between MA and retinal thickening, several factors about MAs should be investigated, the first of which might be the MA size. Wang et al26 reported that the MA size was not necessarily correlated with FA leakage, which was supported by several studies.5,10 The current study also found no correlation between the MA size and retinal thickening. However, numerous small MAs, ie, the focal bulge and saccular types, tended to form in limited areas, which sometimes caused retinal edema. In contrast, large MAs, such as the pedunculated and irregular types, tended to be isolated and did not cause retinal edema (Figure 3). We speculate that the density of MAs may be related to retinal edema.
The second factor might be the MA morphology. Schreur et al10 reported that the irregular type leaked the most in eyes with diabetic retinopathy, because irregular MAs may have a greater luminal surface area that may increase the risk of damage to the basement membrane and, thus, breakdown of the inner blood retinal barrier. In the current study, the focal bulge and saccular types were seen frequently, but there were no significant differences in the percentages of ME exceeding 350 µm among the six types (Figure 3). Alternatively, leakage from MAs was considered to reflect a functional difference in endothelial cell-cell integrity or permeability rather than a morphologic or size variation.26 Regarding the MA morphology in the current study, the absence of pedunculated type was an independent predictive factor for retinal edema. The pedunculated type of MAs was relatively larger than the other types. We speculate that large MAs such as pedunculated or irregular type is not related to retinal edema, while small MAs such as focal bulge or saccular type form numerously in the specific areas (Figure 3), resulting in retinal edema (Figure 3). Thus, we speculate that the density of MAs may be related to retinal edema.
The third factor might be the locations of the MAs. They were seen more often in the deep capillary plexus as reported previously.24,27,28 MAs in the deep capillary plexus reportedly caused retinal edema in eyes with diabetic macular edema,28 which was not the case in the current study. Apart from the vertical analysis, two-dimensional analysis of the MA locations indicated that larger MAs, such as the pedunculated, fusiform, or irregular types, were seen more frequently at the edges of the NPAs and rarely in the collateral vessels (Figure 4). Retinal neovascularization also developed at the borders between the nonperfused and perfused areas in eyes with BRVO.29 It is well known that overexpression of vascular endothelial growth factor (VEGF) in eyes with ischemic retinal diseases causes retinal neovascularization. MAs also formed after intravitreal injection of VEGF proteins in nonhuman primates,30 and blockage of VEGF suppressed MA formation in eyes with BRVO.1 Taken together, we speculated that large MAs at the edges of the NPAs may be proliferative changes similar to neovascularization. MAs have been described as focal regions of endothelial proliferation and perhaps abortive attempts at formation of intraretinal neovascularization,31,32 which supports our speculation. Another important finding in the current study was that the presence of MAs in the collateral vessels was an independent factor predictive of retinal edema, but the MA size, or presence in the retinal deep capillary plexus was not (Table 4). We previously reported that MAs in the collateral vessels cause refractory macular edema in eyes with BRVO,1,12 which also supports the current results.
Older age also was an independent factor predictive of retinal edema. We reported previously1 that older age was predictive of refractory macular edema in eyes with BRVO. A previous immunohistochemistry study33 also found that MAs were present even in the retinas of healthy elderly humans. Therefore, aging itself might be a risk factor for MA formation and retinal edema.
We also evaluated the changes in size and morphology of MAs using OCTA. Dubow et al5 reported several longitudinal changes of MAs, ie, that they remained unchanged, grew, and regressed on AOSLO FA, which also was observed in the current study (Figure 5). No significant differences in the mean MA size before and after treatments were detected. Only the focal bulge type of MA became significantly smaller after treatment (Figure 5), but the reason for this was unclear. Although the mean size of the MAs remained unchanged (Figure 5), the mean retinal thickness decreased after treatment (Figure 5), suggesting that the leakage from MAs might stop or macular edema may persist in the future. Since MAs can cause refractory macular edema in eyes with BRVO,1 careful follow-up for an extended period is needed, or it might be more important to suppress MA formation itself as we proposed previously.1
The current study had several limitations, ie, a small sample size, retrospective study design, and differing durations between the onset of symptoms and initial imaging or the duration between baseline and final OCTA imaging session. The treatment for macular edema differed in each eye, and some eyes were treated with combined therapy. However, a morphologic classification, three-dimensional analysis of the MA location, and longitudinal imaging with quantitative analysis using OCTA may provide a better understanding of the pathology of MAs in eyes with BRVO.
In conclusion, the current study showed that MAs in the collateral vessels were associated with retinal edema, but the MA size and morphology were not. After treatment, the mean retinal thickness decreased significantly, but the mean MA size was unchanged. Residual MAs may cause retinal edema in the future. A careful follow-up for a long duration is needed or it might be more important to suppress MA formation. A future prospective, randomized, controlled study with a large sample size is needed to confirm the current results.
Acknowledgments
The authors thank Kenya Ozaki (Nidek Technologies, Gamagori, Japan) for supporting the data analysis and providing the software with which the retinal thickness of each point was measured. The authors also thank Fumie Shibuya, Yasuyo Fukuda, Sayaka Oshio, Satomi Izumi, and Miho Takeuchi (Nagoya City University Graduate School of Medical Sciences) for contributing to data collection.
Disclosure
Dr Yoshio Hirano reports grants from japan society for the promotion of science, the aichi health promotion foundation, and the eye research foundation for the aged, outside the submitted work. Dr Munenori Yoshida reports grants from Novartis, personal fees from Bayer, Novartis/Alcon pharma, and Santen, during the conduct of the study; and personal fees from Senju, outside the submitted work. Prof. Dr. Yuichiro Ogura reports grants and personal fees from Novartis, grants from Boehringer Ingelheim, and personal fees from Santen Pharma and Senju Pharma, outside the submitted work. The authors declare no other possible conflicts of interest in this work.
References
1. Tomiyasu T, Hirano Y, Yoshida M, et al. Microaneurysms cause refractory macular edema in branch retinal vein occlusion. Sci Rep. 2016;6(1):29445. doi:10.1038/srep29445
2. Hasegawa T, Kawano T, Maruko I, et al. Clinical findings of eyes with macular edema associated with branch retinal vein occlusion refractory to ranibizumab. Retina. 2018;38:1347–1353. doi:10.1097/IAE.0000000000001703
3. Iesato Y, Imai A, Hirano T, et al. Effect of leaking capillaries and microaneurysms in the perifoveal capillary network on resolution of macular edema by anti-vascular endothelial growth factor treatment. Jpn J Ophthalmol. 2016;60:86–94. doi:10.1007/s10384-016-0425-5
4. Sakimoto S, Kamei M, Sakaguchi H, et al. Direct photocoagulation to leaking points to treat chronic macular edema associated with branch retinal vein occlusion: a pilot study. Clin Ophthalmol. 2014;8:2055–2060. doi:10.2147/OPTH.S66878
5. Dubow M, Pinhas A, Shah N, et al. Classification of human retinal microaneurysms using adaptive optics scanning light ophthalmoscope fluorescein angiography. Invest Ophthalmol Vis Sci. 2014;55(3):1299–1309. doi:10.1167/iovs.13-13122
6. Suzuki N, Hirano Y, Yoshida M, et al. Microvascular abnormalities on optical coherence tomography angiography in macular edema associated with branch retinal vein occlusion. Am J Ophthalmol. 2016;161:126–132. doi:10.1016/j.ajo.2015.09.038
7. Mendis KR, Balaratnasingam C, Yu P, et al. Correlation of histologic and clinical images to determine the diagnostic value of fluorescein angiography for studying retinal capillary detail. Invest Ophthalmol Vis Sci. 2010;51(11):5864–5869. doi:10.1167/iovs.10-5333
8. Hirano Y, Yasukawa T, Usui Y, et al. Indocyanine green angiography-guided laser photocoagulation combined with sub-Tenon’s capsule injection of triamcinolone acetonide for idiopathic macular telangiectasia. Br J Ophthalmol. 2010;94:600–605. doi:10.1136/bjo.2009.163790
9. Paques M, Philippakis E, Bonnet C, et al. Indocyanine-green-guided targeted laser photocoagulation of capillary macroaneurysms in macular oedema: a pilot study. Br J Ophthalmol. 2017;101(2):170–174. doi:10.1136/bjophthalmol-2015-308142
10. Schreur V, Domanian A, Liefers B, et al. Morphological and topographical appearance of microaneurysms on optical coherence tomography angiography. Br J Ophthalmol. 2018. doi:10.1136/bjophthalmol-2018-312258
11. Suzuki N, Hirano Y, Tomiyasu T, et al. Retinal hemodynamics seen on optical coherence tomography angiography before and after treatment of retinal vein occlusion. Invest Ophthalmol Vis Sci. 2016;57(13):5681–5687. doi:10.1167/iovs-16-20648
12. Suzuki N, Hirano Y, Tomiyasu T, et al. Collateral vessels on optical coherence tomography angiography in eyes with branch retinal vein occlusion. Br J Ophthalmol. 2019;103(10):1373–1379. doi:10.1136/bjophthalmol-2018-313322
13. Tomiyasu T, Hirano Y, Suzuki N, et al. Structural and functional analyses of retinal ischemia in eyes with retinal vein occlusion: relationship with macular edema or microaneurysm formation. Ophthalmic Res. 2019;61(4):218–225. doi:10.1159/000493489
14. Klein R, Klein B, Henkind P, et al. Retinal collateral vessel formation. Invest Ophthalmol. 1971;10(7):471–480.
15. Henkind P, Wise GN. Retinal neovascularization, collaterals, and vascular shunts. Br J Ophthalmol. 1974;58(4):413–422. doi:10.1136/bjo.58.4.413
16. Schneider CA, Rasband WS, Eliceiri KW. NIH Image to Image J: 25 years of image analysis. Nat Methods. 2012;9(7):671–675. doi:10.1038/nmeth.2089
17. Hayreh SS, Zimmerman MB, Podhajsky P. Incidence of various types of retinal vein occlusion and their recurrence and demographic characteristics. Am J Ophthalmol. 1994;117(4):429–441. doi:10.1016/S0002-9394(14)70001-7
18. The Branch Vein Occlusion Study Group. Argon laser photocoagulation for macular edema in branch retinal vein occlusion. Am J Ophthalmol. 1984;98(3):271–282. doi:10.1016/0002-9394(84)90316-7
19. Branch Vein Occlusion Study Group. Argon laser scatter photocoagulation for prevention of neovascularization and vitreous hemorrhage in branch retinal vein occlusion. A randomized clinical trial. Arch Ophthalmol. 1986;104(1):34–41. doi:10.1001/archopht.1986.01050130044017
20. Khayat M, Williams M, Lois N. Ischemic retinal vein occlusion: characterizing the more severe spectrum of retinal vein occlusion. Surv Ophthalmol. 2018;63(6):816–850. doi:10.1016/j.survophthal.2018.04.005
21. Salz DA, de Carlo TE, Adhi M, et al. Select features of diabetic retinopathy on swept-source optical coherence tomographic angiography compared with fluorescein angiography and normal eyes. JAMA Ophthalmol. 2016;134(6):644–650. doi:10.1001/jamaophthalmol.2016.0600
22. Couturier A, Mané V, Bonnin S, et al. Capillary plexus anomalies in diabetic retinopathy optical coherence tomography angiography. Retina. 2015;35(11):2384–2391. doi:10.1097/IAE.0000000000000859
23. Miwa Y, Murakami T, Suzuma K, et al. Relationship between functional and structural changes in diabetic vessels in optical coherence tomography angiography. Sci Rep. 2016;6(1):29064. doi:10.1038/srep29064
24. Moore J, Bagley S, Ireland G, et al. Three dimensional analysis of microaneurysms in the human diabetic retina. J Anat. 1999;194(1):89–100. doi:10.1046/j.1469-7580.1999.19410089.x
25. Su JP, Chandwani R, Gao SS, et al. Calibration of optical coherence tomography angiography with a microfluidic chip. J Biomed Opt. 2016;21:086015. doi:10.1117/1.JBO.21.8.086015
26. Wang H, Chhablani J, Freeman WR, et al. Characterization of diabetic microaneurysms by simultaneous fluorescein angiography and spectral-domain optical coherence tomography. Am J Ophthalmol. 2012;153(5):861–867. doi:10.1016/j.ajo.2011.10.005
27. Horii T, Murakami T, Nishijima K, et al. Optical coherence tomographic characteristics of microaneurysms in diabetic retinopathy. Am J Ophthalmol. 2010;150:840–848. doi:10.1016/j.ajo.2010.06.015
28. Hasegawa N, Nozaki M, Takase N, et al. New insights into microaneurysms in the deep capillary plexus detected by optical coherence tomography angiography in diabetic macular edema. Invest Ophthalmol Visual Sci. 2016;57(9):OCT348–355. doi:10.1167/iovs.15-18782
29. Yasuda Y, Hirano Y, Esaki Y, et al. Peripheral microvascular abnormalities detected by wide-field fluorescein angiography in eyes with branch retinal vein occlusion. Ophthalmic Res. 2019;61:107–114. doi:10.1159/000488496
30. Tolentino MJ, Miller JW, Gragoudas ES, et al. Intravitreous injections of vascular endothelial growth factor produce retinal ischemia and microangiopathy in an adult primate. Ophthalmology. 1996;103:1820–1828. doi:10.1016/S0161-6420(96)30420-X
31. De Venecia G, Davis M, Engerman R. Clinicopathologic correlations in diabetic retinopathy. I. Histology and fluorescein angiography of microaneurysms. Arch Ophthalmol. 1976;94(10):1766–1773. doi:10.1001/archopht.1976.03910040540013
32. Stitt AW, Gardiner TA, Archer DB. Histological and ultrastructural investigation of retinal microaneurysm development in diabetic patients. Br J Ophthalmol. 1995;79(4):362–367. doi:10.1136/bjo.79.4.362
33. López-Luppo M, Catita J, Ramos D, et al. Cellular senescence is associated with human retinal microaneurysm formation during aging. Invest Ophthalmol Vis Sci. 2017;58(7):2832–2842. doi:10.1167/iovs.16-20312
 © 2020 The Author(s). This work is published and licensed by Dove Medical Press Limited. The
full terms of this license are available at https://www.dovepress.com/terms
and incorporate the Creative Commons Attribution
- Non Commercial (unported, 3.0) License.
By accessing the work you hereby accept the Terms. Non-commercial uses of the work are permitted
without any further permission from Dove Medical Press Limited, provided the work is properly
attributed. For permission for commercial use of this work, please see paragraphs 4.2 and 5 of our Terms.
© 2020 The Author(s). This work is published and licensed by Dove Medical Press Limited. The
full terms of this license are available at https://www.dovepress.com/terms
and incorporate the Creative Commons Attribution
- Non Commercial (unported, 3.0) License.
By accessing the work you hereby accept the Terms. Non-commercial uses of the work are permitted
without any further permission from Dove Medical Press Limited, provided the work is properly
attributed. For permission for commercial use of this work, please see paragraphs 4.2 and 5 of our Terms.