Back to Journals » Clinical Interventions in Aging » Volume 12
Models for estimating the metabolic syndrome biological age as the new index for evaluation and management of metabolic syndrome
Authors Kang YG ![]() , Suh EK, Chun HJ, Kim SH, Kim DK, Bae CY
, Suh EK, Chun HJ, Kim SH, Kim DK, Bae CY
Received 27 September 2016
Accepted for publication 22 December 2016
Published 1 February 2017 Volume 2017:12 Pages 253—261
DOI https://doi.org/10.2147/CIA.S123316
Checked for plagiarism Yes
Review by Single anonymous peer review
Peer reviewer comments 4
Editor who approved publication: Dr Richard Walker
Young Gon Kang,1 Eunkyung Suh,2 Hyejin Chun,3 Sun-Hyun Kim,4 Deog Ki Kim,5 Chul-Young Bae1
1MediAge Research Center, Seongnam-si, Gyeonggi-do, 2Department of Family Medicine, College of Medicine, CHA University, Chaum, Seoul, 3Department of Family Medicine, College of Medicine, CHA University, Bundang CHA Medical Center, Seongnam-si, Gyeonggi-do, 4Department of Family Medicine, International St Mary’s Hospital, College of Medicine, Catholic Kwandong University, Incheon, 5Pharmicell Clinical Research Center, Seoul, South Korea
Purpose: This study aims to propose a metabolic syndrome (MS) biological age model, through which overall evaluation and management of the health status and aging state in MS can be done easily. Through this model, we hope to provide a novel evaluation and management health index that can be utilized in various health care fields.
Patient and methods: MS parameters from American Heart Association/National Heart, Lung, and Blood Institute guidelines in 2005 were used as biomarkers for the estimation of MS biological age. MS biological age model development was done by analyzing data of 263,828 participants and clinical application of the developed MS biological age was assessed by analyzing the data of 188,886 subjects.
Results: The principal component accounted for 36.1% in male and 38.9% in female of the total variance in the battery of five variables. The correlation coefficient between corrected biological age and chronological age in males and females were 0.711 and 0.737, respectively. Significant difference for mean MS biological age and chronological age between the three groups, normal, at risk and MS, was seen (P<0.001).
Conclusion: For the comprehensive approach in MS management, MS biological age is expected to be additionally utilized as a novel evaluation and management index along with the traditional MS diagnosis.
Keywords: metabolic syndrome, biological age, biomarker, index, health care
Introduction
Metabolic syndrome (MS) was first named as syndrome X and the underlying cause was thought to be insulin resistance.1 The inclusive parameters of MS that are known as risk factors of cardiovascular disease are thought to be related to the development of cardiovascular disease rather than be independent.2,3 Thus, multiple inclusive parameters geometrically increases the risk for cardiovascular disease.4,5 Therefore, previous studies have shown the need for prevention of cardiovascular disease through aggressive lifestyle modification in not only MS patients but also in those at risk of MS with 1 or 2 abnormal inclusive criteria.6,7
Along with the rise in the elderly population, the prevalence of associated chronic diseases are being increased resulting in various problems.8 The need for overall evaluation and management of MS, a cluster of chronic diseases, has been constantly proposed in primary care along with health promotion and age management. Thus, the importance and the need for healthy lifestyle are being emphasized not only in the medical field but also in the related ubiquitous health care areas.6,9,10 Several considerations are needed before applying the same diagnostic criteria of MS in the health care fields as used in medical fields. 1) As the MS definition is a categorical diagnosis, it has limitations in accurately evaluating the degree or severity of MS. Also by this categorical diagnosis, it is difficult to precisely consider the effects of lifestyle modification, so a continuous or a quantitative index is required. 2) A relative index with which we can make comparison by sex and age considering the difference of prevalence of MS according to the composing factors is needed. 3) A comprehensive index with which we can take into consideration the MS patients, but also the risk population with 1 or 2 components of MS is needed. Thus, a comprehensive index for convenient evaluation and management of the health and aging status in MS is needed.
Age is known as a general index with which we can evaluate the health condition and aging status of an individual, and variables that show certain patterns according to age are called biomarkers of aging.11 Biological age (BA) estimated by the biomarkers of aging which clearly reflect the health status with aging has been known as a marker for evaluating the body’s physiologic function, health status and aging state.12 So, BA has strength in that it is a continuous index that can show health state and can show relative comparison with people of the same sex and age. Also, with BA anyone can easily understand their present health and aging state. But chronological age (CA) that we usually call “age” is determined according to the simple time flow, so it has limitations in the accurate evaluation of one’s physiological function, health or aging status.13
Thus, this study aims to propose and evaluate the clinical value of a MS BA model, through which overall evaluation and management of the health status and aging state in MS can be done. We hope to provide a communication, evaluation and management index through which everyone can easily understand and manage one’s health and aging status. And, we hope to provide a novel evaluation and management health index that can be utilized in various health care fields.
Materials and methods
Subjects
This study was conducted using data of subjects aged ≥20 years who received routine health check-ups including Mediage™ at university medical centers and community hospitals in Korea from June 2012 through November 2015. Only the data with all five parameters of the MS present proposed by the American Heart Association/National Heart, Lung, and Blood Institute (AHA/NHLBI) in 2005 were included in the analysis. MS BA model development was done by analyzing data of 263,828 participants collected from January 2014 through November 2015 in which the range of diagnostic parameters were included in the reference range. Clinical application of the developed MS BA was assessed by analyzing the data of 188,886 subjects collected from June 2012 through December 2013. The data used in the analysis were collected after explaining to the subjects prior to the health check-up of utilization in future studies and signed informed consent forms were obtained. All study methods followed the Declaration of Helsinki and were approved by the Medical Ethics Committee of the International St Mary’s Hospital. This study was approved exempt from review by the Institutional Review Board of the International St Mary’s Hospital of Catholic Kwandong University. (Mediage was developed in Korea based on references14,15 and is widely used in 200 university hospitals and health promotion centers in Korea. It is a BA analysis system, which is also utilized as an index of health in various healthcare fields.)
Parameters
In this study, MS was defined using the 2005 AHA/NHLBI guidelines except for waist circumference (WC) in females. Inclusive criteria of WC in females were >85.0 cm, which is the endemic standard of Korea. WC, systolic blood pressure (SBP), diastolic blood pressure (DBP), fasting blood sugar (FBS), triglyceride (TG), and high-density lipoprotein cholesterol (HDL-C) were used as biomarkers. As for WC, the thinnest area between the inferior part of the lowest rib and the iliac crest was measured as a unit of cm when subjects were in an upright position. SBP and DBP were measured manually two times after a minimum of 5-minute rest in sitting position, and the mean value was taken. The biochemistry parameters were collected after an overnight fast of at least 8 hours.
Inclusion criteria
Generally, it is very difficult to distinguish normal aging from pathologic aging. Considering this, in this study, we determined the reference range of the individual parameters as the range that includes not only the general health state of the subjects but also partially the metabolic disturbance by aging. And so, physiological and functional decrements or pathological change in the beginning of disease that occur as part of normal aging process such as impaired fasting glucose and first stage hypertension were included. But the clear forms of metabolic impairment due to disease were excluded considering the reference range data used in previous studies.14–16
Statistical analysis
Correlation analysis and assessment of redundancy
The MS diagnostic parameters, WC, SBP, DBP, FBS, TG and HDL-C levels, were used as parameters for MS BA model development. First, correlation analysis of age and the measured parameters were done. Redundancy of the parameters could be suspected by the high level of correlation (correlation coefficient ≥0.7) seen between the individual parameters in the correlation analysis. Especially, correlation analysis with age was done after SBP and DBP were converted into mean arterial blood pressure (MBP) and partial pressure (PP) for exclusion of redundancy and application of both parameters in model development.
Principal component analysis (PCA)
In this study, PCA was done for estimating the MS BA. First, PCA was done using age and the five MS diagnostic parameters as variables. Among the factors, the factor with the highest eigenvalue, which is the sum of total variance of parameter was decided as the principle component. We confirmed how the factor loading value, which is the correlation between the factors and variables of PCA changed after exclusion of age.
Construction of BA
A BA score (BAS) was developed using the first principal component obtained from PCA based on the selected biomarkers. Individual BAS was transformed into terms of years (BA) using the T-scale idea (technique of transformation from standard score to T-score) as follows, considering they are distributed with a mean of 0 and a standard deviation (SD) of 1.0. The formula for converting BAS to BA is as follows.
BA = (BAS × standard deviation of CA) + mean of CA. |
Correction of BA estimation equation
Calculation of BA by the above formula makes underestimations of the means for BA for the upper end of the regression and makes overestimations for the lower end. To correct this systemic error, corrected BA (cBA) was calculated by the following correction method.17
Corrected BA = BA + z. |
The z value is as follows. z = (yi − y) × (1 − b). The “yi” is the CA of an individual and “y” is the average CA of all samples. The b is the coefficient of simple linear regression, which expresses the relation between the BA and CA.
Results
General characteristics
Among the total data of 263,828 participants that were used in the model development, 165,395 were data of men and 98,433 were data of women. All the clinical parameters associated with MS are presented in Table 1. Mean (SD) age was 44.2 years (±10.6); 44.3 years (±10.2) in males and 44.2 years (±11.3) in females. Table 1 shows the mean result, SD and reference range of the MS inclusive parameters used as biomarkers.
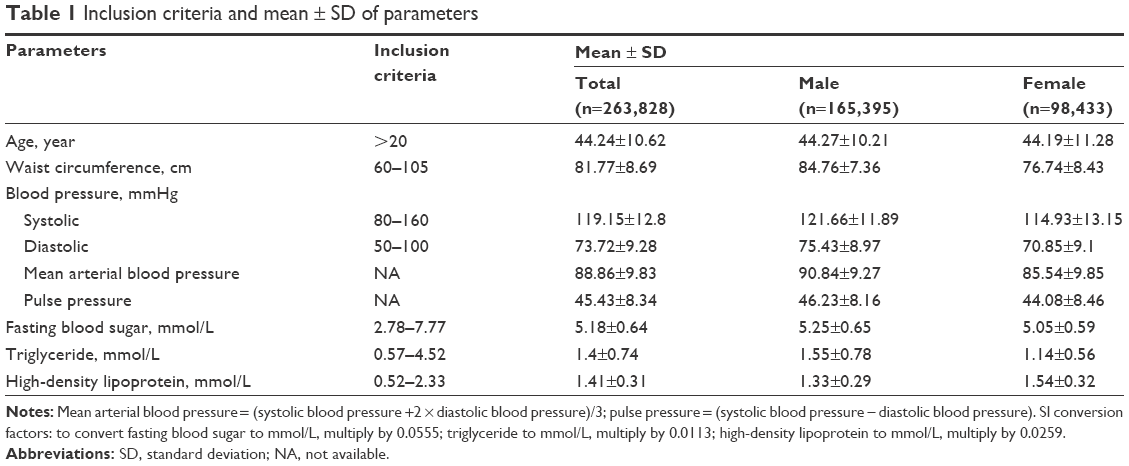 | Table 1 Inclusion criteria and mean ± SD of parameters |
Development of BA model
Correlation analysis and assessment of redundancy
There were statistically significant correlations between age and MS inclusive parameters (Table 2). All parameters except HDL-C showed positive correlations with age. Correlation analysis between age and blood pressure parameters (SBP, DBP, MBP and PP) showed high correlation of SBP and DBP. In males, MBP was selected as the blood pressure variable, because MBP showed the highest correlation with age among the blood pressure parameters and also high correlation with SBP and DBP. In females, MBP was selected as the blood pressure variable although SBP showed higher correlation with age than MBP. This was done in order to reflect both the SBP and DBP excluding the redundancy and collinearity between the two while considering the correlation with age.
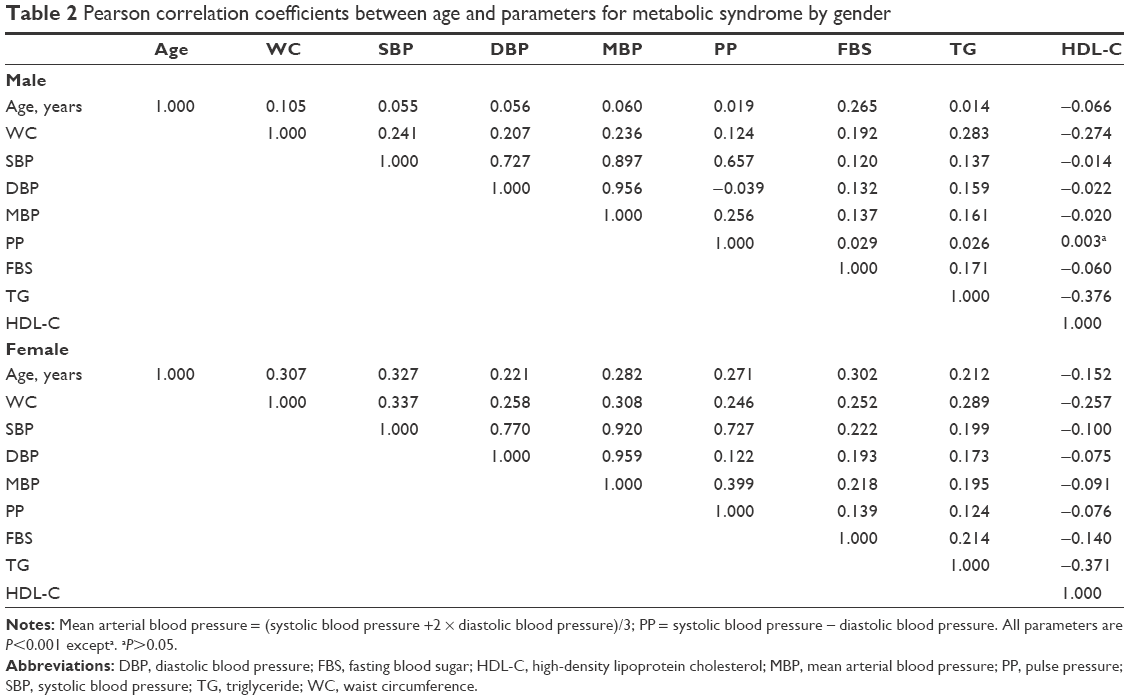 | Table 2 Pearson correlation coefficients between age and parameters for metabolic syndrome by gender |
Principal component analysis
PCA was done with WC, MBP, FBS, TG and HDL-C as candidate biomarkers. Factor analysis including age was done for analyzing association with age and principal components and a significant positive correlation (0.330 in male and 0.630 in female) was seen. Proposed factors have close correlation with age, and we defined these as principle components that reflect MS BA. To see the correlation of other biomarkers and principle components excluding the influence of age, we performed reanalysis after excluding age and confirmed the influence of age on the principle components. Eigenvalues of >1 were found to be two components in male and one component in female. The principal component accounted for 36.1% in male and 38.9% in female of the total variance and the eigenvalues were 1.804 and 1.947, respectively (Tables 3 and 4).
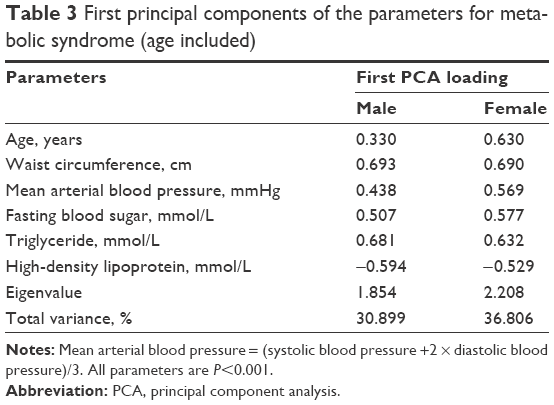 | Table 3 First principal components of the parameters for metabolic syndrome (age included) |
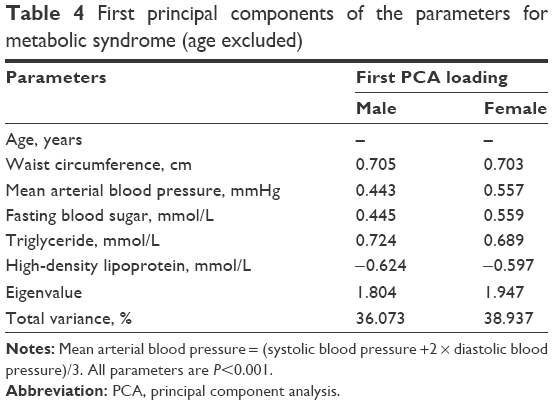 | Table 4 First principal components of the parameters for metabolic syndrome (age excluded) |
Construction of BA
Principal component score after excluding age was used as an index for health status and aging state in MS. Regression analysis was done using the PCA variables as dependent variables and the five MS candidate biomarkers as independent variables. The formula developed after this process for estimation of BAS is as follows:
|
|
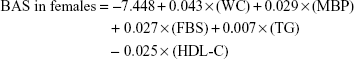
BAS has limitation of being difficult when explaining to the general public as it is not expressed in terms of years. To overcome this disadvantage, BAS was converted into years (BA) using the T-scale idea as follows, considering they are distributed with a mean of 0 and a SD of 1.0.
|
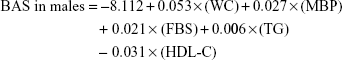
The mean (±SD) CA in males and females were 44.3 (±10.2) and 44.2 (±11.3), respectively. If we express the BA estimation equation in detail using the above equation, it would be as follows:
|
|
Correction of BA estimation equation
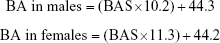
With the above relationship between CA and BA, there can be underestimation of BA for the upper end of the equation and overestimation of BA for the lower end. To reduce this systemic error, we used the correction equation shown in a previous study:17
|
|
The correlation coefficients between corrected BA and CA calculated from the above corrected equation in males and females were 0.711 and 0.737, respectively. Through the correction, both ends of the equation centered on the equation y = x (Figure 1).
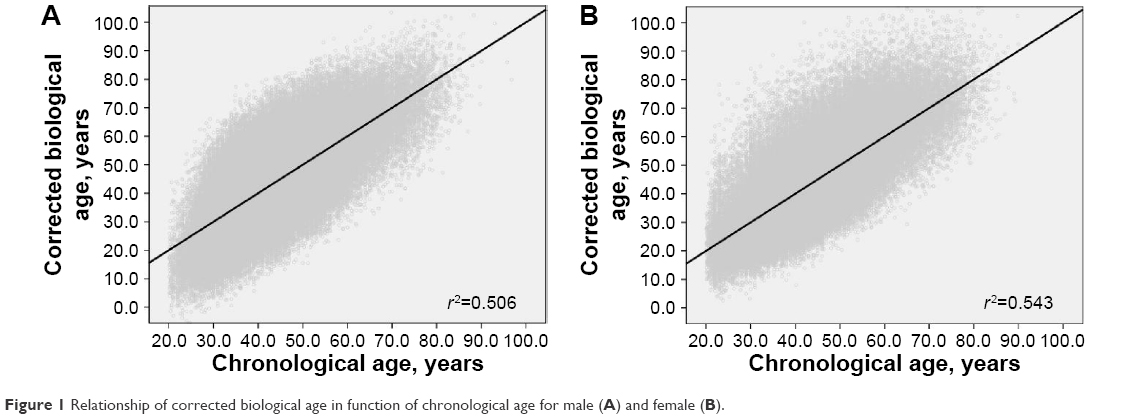 | Figure 1 Relationship of corrected biological age in function of chronological age for male (A) and female (B). |
Clinical applications of the developed BA model
Table 5 shows the mean (±SD) of corrected BA and CA according to gender and age groups. To evaluate the possibility of clinical application of MS BA estimation model, three categories were made; normal group, 1–2 risk variable group (those with 1–2 risk variables), and the MS group. The mean difference of MS BA and CA between the three groups were analyzed using analysis of variance and showed significant difference (P<0.001; Table 6).
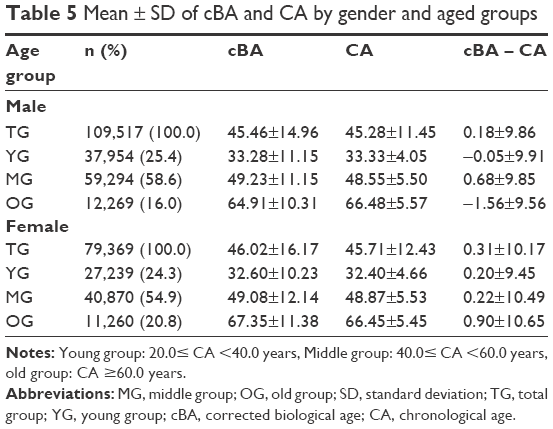 | Table 5 Mean ± SD of cBA and CA by gender and aged groups |
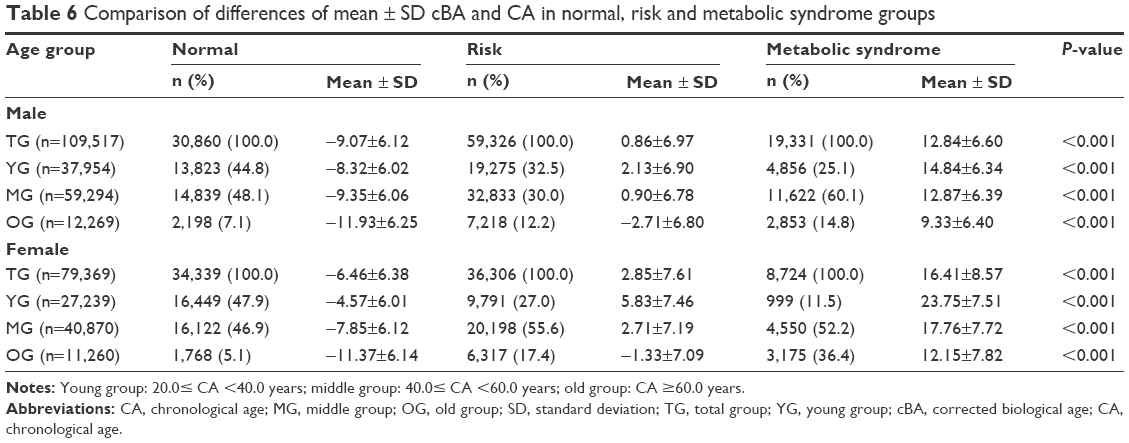 | Table 6 Comparison of differences of mean ± SD cBA and CA in normal, risk and metabolic syndrome groups |
Discussion
Most studies show that the prevalence of MS rises with age in both men and women.19–22 Especially in women, the prevalence rapidly increases after menopause. This rise in prevalence is known to be due to the increase of chronic diseases such as central obesity, hypertension, diabetes, dyslipidemia, and deficiency in sex hormones with increasing age.23,24 Thus, this study aimed to propose a model for MS BA which can be utilized in both the medical fields and ubiquitous healthcare fields along with the existing diagnosis for MS because interest for aggressive management of MS is increasing.
Generally, aging has features of physiological function decrease and change in physical form as time goes by. The index for evaluating the degree of aging is “age” or calendar age. Increase in age means frailty, which can be interpreted as decrease in physical function and lowered overall health state. In the same context, the evaluation of aging is assessing the present health state. Calendar age is generally known as the marker for aging, which is the flow of time after birth commonly applied to everyone. But, calendar age cannot fully reflect one’s aging degree. Because it does not take into consideration the features of aging, which are the difference between individuals or the difference of the organs in an individual.13 However, BA is the age which evaluates one’s physiological function and can be proposed as a relative age according to sex and age. And so, BA is known to evaluate more accurately one’s physiological function or health and aging state compared with others of the same sex and age group.12 Also, BA can be used as a predictive index for one’s decrease in physical function, disease development and mortality.25,26 Various BA estimation models are being proposed as the importance of BA is being more noticed and utilized.14–16
BA is, generally, composed of the combination of biomarkers27 and stands for one’s overall health state and aging state compared with those in the same age. Biomarkers which are the base of BA can be objectively measured and evaluated as markers of normal aging process, progression to disease or treatment response.28 Thus, MS BA which used the inclusive parameters of MS as biomarkers can be expected to be utilized as a novel evaluation and management index in the assessment of the overall state of MS.
Individual parameters that compose the MS BA model have the following significance as biomarkers. WC is known as the most reliable biomarker by which we can diagnose central obesity and predict visceral fat amount, which increases with age.29–32 Also, several studies have reported central obesity as the preceding factor among the inclusive parameters of MS.33,34 BP is known as the most common biomarker representing cardiovascular function. Especially, SBP increases with age and is known as a marker which predicts coronary artery disease and life expectancy.18,35–37 Correlation analysis was done in this study after conversion to PP and MBP in order to reflect both the SBP and DBP excluding the redundancy and collinearity between the two. Correlation analysis after conversion of the BP parameter showed MBP to have higher association with age and higher correlation with SBP and DBP than PP, so it was used as the biomarker of BP in MS BA. MBP which is known as a marker that reflects vascular resistance was shown to increase with age in previous studies38 and also showed positive correlation with age in this study. FBS has close association with insulin resistance, which is known as the underlying cause of MS that increases with age. Type 2 diabetes of high FBS alone is known as a strong predictive factor for the development of cardiovascular disease than MS or other risk factors.39,40 TG is known as a marker for storage body fat.41 Thus, increase of serum TG level has a very close relationship with central obesity and insulin resistance42,43 and also several studies have reported high positive correlation with insulin resistance.44,45 HDL-C has protective effects against cardiovascular disease by helping transportation of intravascular cholesterol to liver.41 Thus, separate evaluation and management of the MS inclusive parameters known as independent cardiovascular disease risk factors is important, but overall evaluation and management is important also. Therefore, the use of MS BA for the comprehensive evaluation and management of MS is expected to strengthen the weakness of using just the existing dichotomous diagnosis of MS.
Commonly, the diagnosis of a disease which has a binary structure is determined by whether the variables reflecting disease state are in a certain reference range or off range. MS also is diagnosed when three or more of the five criteria parameters are off the reference range. But, this way of diagnosis has limitations in that it cannot reflect disease biology.46 For example, type 2 diabetes also is defined by a binary structure with the measurement of a continuous variable. A fasting blood glucose level of >126 is defined as type 2 diabetes and so blood glucose of 124 is not considered as important or dangerous but levels of 126 and 190 are considered as similar states. The importance of quantitative evaluation of MS severity, management and improvement after lifestyle modification is more emphasized in ubiquitous health care fields as they target relatively healthy subjects compared to medical fields that have purpose in treating disease. The importance of quantitative evaluation can be seen by the significant difference of MS BA and CA between the normal, risk and MS groups (Table 6). The differences of mean (±SD) corrected BA and CA in normal, risk and MS groups might have resulted from the deterioration of BA with increasing MS inclusive parameters. Thus, MS BA can be utilized as a quantitative evaluation and management index that can strengthen the weakness of categorical diagnosis.
Patients with one or more chronic diseases are increasing worldwide with increase of the elderly population. According to a previous study done in 2005, 21% of the American population had 1 or more chronic disease with duration of at least 1 year.8 Thus, a more active and overall management of MS is required since MS is associated with chronic disease due to unhealthy lifestyle habits.26 Therefore, various approaches in the ubiquitous health care field which proposes health promotion through maintaining healthy lifestyles and grafting-associated service fields to support MS management is inevitable.6,9,10,47
The implication and importance of the MS BA proposed in this study has several advantages. First, it has meaning as a communication index in which anyone can easily understand one’s health and aging state by a new form of age. Second, MS BA has meaning as a relative evaluation index in which one can compare the degree of MS with others in the same sex and age group. Third, generally, with the management of MS, some inclusive parameters get better and others get worse. Thus, there can be difficulty in assessing whether MS has really been improved. MS BA can be used as a comprehensive index which can evaluate the improvement of MS despite the differences in the improvement of individual parameters.
But, several limitations have to be considered in this study. First, this MS BA model was developed using data of Koreans, so there might be limitations in applying to other race or regions. It is wellknown that there is a difference in WC criteria among Asians and Westerners and also slight differences between Asian countries. Thus, data analysis, application of average, SD, range and distribution according to gender and age should be taken into consideration before applying this model. Second, the special medical environment of health checkups being popular in Korea and the possibility of selection bias of limited data collection must be considered. Finally, this study was a cross-sectional study and the limitations of this and also limited evaluations due to limited data collection should be complemented by prospective studies in the future.
The inclusive parameters of MS have close relationship with insulin resistance. Especially, the risk for cardiovascular disease is known to increase geometrically with the simultaneous existence of multiple inclusive parameters rather than the simple sum of individual parameters. Thus, although approach to the individual parameters is important, but an overall approach to MS is necessary. Also, not only the medical treatment but also approach from the ubiquitous health care fields for healthy lifestyle modification and health promotion is needed in MS management. For the comprehensive approach in MS management, MS BA is expected to be additionally utilized as a novel evaluation and management index along with the traditional MS diagnosis.
Conclusion
This study aimed to propose a novel evaluation and management index which can show the overall MS state or severity in view of health promotion and aging management by developing a MS BA model for utilization in various fields. Thus, the MS BA model proposed in this study has several implications. 1) It can be used as a continuous or quantitative evaluation index for the overall state and severity of MS in the view of health promotion including health and aging. 2) It can be used as a relative evaluation and communication index in which one can compare the degree of MS with others according to sex and age. 3) It can be used as a comprehensive index which can evaluate the improvement of MS despite the differences in the improvement of individual parameters.
Disclosure
The authors report no conflicts of interest in this work.
References
Reaven GM. Role of insulin resistance in human disease. Diabetes. 1988;37(12):1595–1607. | ||
McNeill AM, Rosamond WD, Girman CJ, et al. The metabolic syndrome and 11-year risk of incident cardiovascular disease in the atherosclerosis risk in communities study. Diabetes Care. 2005;28(2):385–390. | ||
Isomaa B, Almgren P, Tuomi T, et al. Cardiovascular morbidity and mortality associated with the metabolic syndrome. Diabetes Care. 2001;24(4):683–689. | ||
Grundy SM, Cleeman JI, Daniels SR, et al. Diagnosis and management of the metabolic syndrome an American Heart Association/National Heart, Lung, and Blood Institute scientific statement. Circulation. 2005;112(17):2735–2752. | ||
Whayne TF Jr. Metabolic syndrome, peripheral vascular disease and coronary artery disease: a concise review. Int J Angiol. 2010;19(3):e96–e99. | ||
Stone NJ, Saxon D. Approach to treatment of the patient with metabolic syndrome: lifestyle therapy. Am J Cardiol. 2005;96(4):15–21. | ||
Bestermann W, Houston MC, Basile J, et al. Addressing the global cardiovascular risk of hypertension, dyslipidemia, diabetes mellitus, and the metabolic syndrome in the southeastern United States, part II: treatment recommendations for management of the global cardiovascular risk of hypertension, dyslipidemia, diabetes mellitus, and the metabolic syndrome. Am J Med Sci. 2005;329(6):292–305. | ||
Vogeli C, Shields AE, Lee TA, et al. Multiple chronic conditions: prevalence, health consequences, and implications for quality, care management, and costs. J Gen Intern Med. 2007;22(3):391–395. | ||
Kohro T, Furui Y, Mitsutake N, et al. The Japanese national health screening and intervention program aimed at preventing worsening of the metabolic syndrome. Int Heart J. 2008;49(2):193–203. | ||
Park SY, Yang YJ, Kim Y. Effects of nutrition education using a ubiquitous healthcare (u-Health) service on metabolic syndrome in male workers. Korean J Nutr. 2011;44(3):231–242. | ||
Ingram DK, Nakamura E, Smucny D, Roth GS, Lane MA. Strategy for identifying biomarkers of aging in long-lived species. Exp Gerontol. 2001;36(7):1025–1034. | ||
Borkan GA, Norris AH. Assessment of biological age using a profile of physical parameters. J Gerontol. 1980;35(2):177–184. | ||
Finkel D, Whitfield K, McGue M. Genetic and environmental influences on functional age: a twin study. J Gerontol B Psychol Sci Soc Sci. 1995;50(2):P104–P113. | ||
Bae CY, Kang YG, Suh YS, Han JH, Kim SS, Shim KW. A model for estimating body shape biological age based on clinical parameters associated with body composition. Clin Interv Aging. 2013;8:11–18. | ||
Bae CY, Kang YG, Piao MH, et al. Models for estimating the biological age of five organs using clinical biomarkers that are commonly measured in clinical practice settings. Maturitas. 2013;75(3):253–260. | ||
Bae CY, Kang YG, Kim S, et al. Development of models for predicting biological age (BA) with physical, biochemical, and hormonal parameters. Arch Gerontol Geriatr. 2008;47(2):253–265. | ||
Dubina TL, Mints AY, Zhuk EV. Biological age and its estimation. III. Introduction of a correction to the multiple regression model of biological age and assessment of biological age in cross-sectional and longitudinal studies. Exp Gerontol. 1984;19(2):133–143. | ||
Staessen JA, Fagard R, Thijs L, et al. Randomised double-blind comparison of placebo and active treatment for older patients with isolated systolic hypertension. Lancet. 1997;350(9080):757–764. | ||
Kwon HS, Park YM, Lee HJ, et al. Prevalence and clinical characteristics of the metabolic syndrome in middle-aged Korean adults. Korean J Intern Med. 2005;20(4):310–316. | ||
Ford ES, Giles WH, Dietz WH. Prevalence of the metabolic syndrome among US adults: findings from the third National Health and Nutrition Examination Survey. JAMA. 2002;287(3):356–359. | ||
Park HS, Lee SY, Kim SM, Han JH, Kim DJ. Prevalence of the metabolic syndrome among Korean adults according to the criteria of the International Diabetes Federation. Diabetes care. 2006;29(4): 933–934. | ||
Ford ES, Giles WH, Mokdad AH. Increasing prevalence of the metabolic syndrome among US adults. Diabetes Care. 2004;27(10):2444–2449. | ||
Laaksonen DE, Niskanen L, Punnonen K, et al. Testosterone and sex hormone–binding globulin predict the metabolic syndrome and diabetes in middle-aged men. Diabetes Care. 2004;27(5):1036–1041. | ||
Carr MC. The emergence of the metabolic syndrome with menopause. J Clin Endocrinol Metab. 2003;88(6):2404–2411. | ||
Karasik D, Demissie S, Cupples LA, Kiel DP. Disentangling the genetic determinants of human aging: biological age as an alternative to the use of survival measures. J Gerontol A Biol Sci Med Sci. 2005;60(5):574–587. | ||
Borkan GA, Norris AH. Biological age in adulthood: comparison of active and inactive US males. Hum Biol. 1980;52(4):787–802. | ||
Ingram DK. Key questions in developing biomarkers of aging. Exp Gerontol. 1988;23(4):429–434. | ||
Colburn W, DeGruttola VG, DeMets DL, et al. Biomarkers and surrogate endpoints: preferred definitions and conceptual framework. Biomarkers Definitions Working Group. Clin Pharmacol Ther. 2001;69(3):89–95. | ||
Pouliot MC, Després JP, Lemieux S, et al. Waist circumference and abdominal sagittal diameter: best simple anthropometric indexes of abdominal visceral adipose tissue accumulation and related cardiovascular risk in men and women. Am J Cardiol. 1994;73(7):460–468. | ||
Perry AC, Applegate EB, Allison ML, Miller PC, Signorile JF. Relation between anthropometric measures of fat distribution and cardiovascular risk factors in overweight pre-and postmenopausal women. Am J Clin Nutr. 1997;66(4):829–836. | ||
Wei M, Gaskill SP, Haffner SM, Stern MP. Waist circumference as the best predictor of noninsulin dependent diabetes mellitus (NIDDM) compared to body mass index, waist/hip ratio and other anthropometric measurements in Mexican Americans – a 7-year prospective study. Obesity Res. 1997;5(1):16–23. | ||
Kim S, Kim S, Yoon S, et al. What is the best simple anthropometric indexes of abdominal visceral fat in obese patients. Korean J Obes. 1998;7:157–168. | ||
Maison P, Byrne CD, Hales CN, Day NE, Wareham NJ. Do different dimensions of the metabolic syndrome change together over time? Evidence supporting obesity as the central feature. Diabetes Care. 2001;24(10):1758–1763. | ||
Everson SA, Glodberg DE, Helmrich SP, et al. Weight gain and the risk of developing insulin resistance syndrome. Diabetes Care. 1998;21(10):1637–1643. | ||
Izzo JL Jr, Levy D, Black HR. Clinical Advisory Statement. Importance of systolic blood pressure in older Americans. Hypertension. 2000;35(5):1021–1024. | ||
Stamler J, Neaton JD, Wentworth DN. Blood pressure (systolic and diastolic) and risk of fatal coronary heart disease. Hypertension. 1989;13(5 Suppl):I2–I12. | ||
Group SCR. Prevention of stroke by antihypertensive drug treatment in older persons with isolated systolic hypertension Final results of the Systolic Hypertension in the Elderly Program (SHEP). JAMA. 1991;265(24):3255–3264. | ||
Franklin SS, Gustin W 4th, Wong ND, et al. Hemodynamic patterns of age-related changes in blood pressure. The Framingham Heart Study. Circulation. 1997;96(1):308–315. | ||
Malik S, Wong ND, Franklin SS, et al. Impact of the metabolic syndrome on mortality from coronary heart disease, cardiovascular disease, and all causes in United States adults. Circulation. 2004;110(10):1245–1250. | ||
Hunt KJ, Resendez RG, Williams K, Haffner SM, Stern MP. National cholesterol education program versus World Health Organization metabolic syndrome in relation to all-cause and cardiovascular mortality in the San Antonio Heart Study. Circulation. 2004;110(10):1251–1257. | ||
Crimmins E, Vasunilashorn S, Kim JK, Alley D. Biomarkers related to aging in human populations. Adv Clin Chem. 2008;46:161–216. | ||
Olefsky JM, Farquhar JW, Reaven GM. Reappraisal of the role of insulin in hypertriglyceridemia. Am J Med. 1974;57(4):551–560. | ||
Garg A. Insulin resistance in the pathogenesis of dyslipidemia. Diab Care. 1996;19(4):387–389. | ||
Haffner SM. Pre-diabetes, insulin resistance, inflammation and CVD risk. Diabetes Res Clin Pract. 2003;61(Suppl 1):S9–S18. | ||
Karelis AD, St-Pierre DH, Conus F, Rabasa-Lhoret R, Poehlman ET. Metabolic and body composition factors in subgroups of obesity: what do we know? J Clin Endocrinol Metab. 2004;89(6):2569–2575. | ||
Vickers AJ, Basch E, Kattan MW. Against diagnosis. Ann Internal Med. 2008;149(3):200–203. | ||
Nakamura E, Kimura M, Nagata H, Miyao K, Ozeki T. Evaluation of the progress of aging based on specific biological age as estimated by various physiological functions (author’s transl). Nihon Eiseigaku Zasshi. 1982;36(6):853–862. Japanese. |
 © 2017 The Author(s). This work is published and licensed by Dove Medical Press Limited. The
full terms of this license are available at https://www.dovepress.com/terms
and incorporate the Creative Commons Attribution
- Non Commercial (unported, 3.0) License.
By accessing the work you hereby accept the Terms. Non-commercial uses of the work are permitted
without any further permission from Dove Medical Press Limited, provided the work is properly
attributed. For permission for commercial use of this work, please see paragraphs 4.2 and 5 of our Terms.
© 2017 The Author(s). This work is published and licensed by Dove Medical Press Limited. The
full terms of this license are available at https://www.dovepress.com/terms
and incorporate the Creative Commons Attribution
- Non Commercial (unported, 3.0) License.
By accessing the work you hereby accept the Terms. Non-commercial uses of the work are permitted
without any further permission from Dove Medical Press Limited, provided the work is properly
attributed. For permission for commercial use of this work, please see paragraphs 4.2 and 5 of our Terms.