Back to Journals » Medical Devices: Evidence and Research » Volume 12
Model-based glycemic control in a Malaysian intensive care unit: performance and safety study
Authors Abu-Samah A ![]() , Knopp JL, Abdul Razak NN
, Knopp JL, Abdul Razak NN ![]() , Razak AA
, Razak AA ![]() , Jamaludin UK, Mohamad Suhaimi F, Md Ralib A, Mat Nor MB, Chase JG, Pretty CG
, Jamaludin UK, Mohamad Suhaimi F, Md Ralib A, Mat Nor MB, Chase JG, Pretty CG
Received 17 September 2018
Accepted for publication 30 January 2019
Published 31 May 2019 Volume 2019:12 Pages 215—226
DOI https://doi.org/10.2147/MDER.S187840
Checked for plagiarism Yes
Review by Single anonymous peer review
Peer reviewer comments 2
Editor who approved publication: Dr Scott Fraser
Asma Abu-Samah,1 Jennifer Launa Knopp,2 Normy Norfiza Abdul Razak,3 Athirah Abdul Razak,3 Ummu Kulthum Jamaludin,3 Fatanah Mohamad Suhaimi,4 Azrina Md Ralib,5 Mohd Basri Mat Nor,6 James Geoffrey Chase,2 Christopher Grant Pretty2
1Institute of Energy Infrastructure, Universiti Tenaga Nasional, Kajang, 43000, Malaysia; 2Department of Mechanical Engineering, University of Canterbury, Christchurch, 8041, New Zealand; 3College of Engineering, Universiti Tenaga Nasional, Kajang, 43000, Malaysia; 4Faculty of Mechanical Engineering, Universiti Malaysia Pahang, Pekan, 26600, Malaysia; 5Advanced Medical and Dental Institute, Universiti Sains Islam Malaysia, Kepala Batas, 13200, Malaysia; 6Kulliyah of Medicine, International Islamic University Malaysia, Kuantan, 25200, Malaysia
Background: Stress-induced hyperglycemia is common in critically ill patients. A few forms of model-based glycemic control have been introduced to reduce this phenomena and among them is the automated STAR protocol which has been used in the Christchurch and Gyulá hospitals’ intensive care units (ICUs) since 2010.
Methods: This article presents the pilot trial assessment of STAR protocol which has been implemented in the International Islamic University Malaysia Medical Centre (IIUMMC) Hospital ICU since December 2017. One hundred and forty-two patients who received STAR treatment for more than 20 hours were used in the assessment. The initial results are presented to discuss the ability to adopt and adapt the model-based control framework in a Malaysian environment by analyzing its performance and safety.
Results: Overall, 60.7% of blood glucose measurements were in the target band. Only 0.78% and 0.02% of cohort measurements were below 4.0 mmol/L and 2.2 mmol/L (the limitsfor mild and severe hypoglycemia, respectively). Treatment preference-wise, the clinical staff were favorable of longer intervention options when available. However, 1 hourly treatments were still used in 73.7% of cases.
Conclusion: The protocol succeeded in achieving patient-specific glycemic control while maintaining safety and was trusted by nurses to reduce workload. Its lower performance results, however, give the indication for modification in some of the control settings to better fit the Malaysian environment.
Keywords: glycemic control, intensive care unit, model-based control, pilot trial, Malaysian hospital
Introduction
Stress-induced hyperglycemia is common in critically ill patients, even among those without diabetes mellitus.1–4 The metabolic response to stress is characterized by major changes in glycemia metabolism. Current research suggests that hyperglycemia is not only a marker for severity of illness, it also worsens outcomes, leading to an increased risk of further complications, such as severe infection,5 myocardial infarction,6 polyneuropathy, and multiple-organ failure.3 Glycemic control (GC) has been shown to reduce Intensive Care Unit (ICU) patient mortality up to 45%.3,7–9 However, some subsequent studies failed to repeat these results, and resulted in a higher incidence of hypoglycemia if compared to conventional insulin control.10–12 One of the concerns that can be extracted from the above studies is the need to be cognizant in defining the “sweet spot” between tight control and conventional care.
Another identified issue with existing GC approaches is their inability to identify patient-specific dynamics, thus limiting their ability to provide consistent, safe, and effective GC. A recent study by Uyttendaele et al13 suggested that the association between hyperglycemia and outcome is determined by the quality of GC, rather than by the underlying patient condition. A patient-specific approach is required to successfully manage significant inter- and intra-patient variability.14 In this context, model-based controllers using mathematical models of patient physiology can be applied to capture patient-specific response to optimize insulin and nutrition inputs.15 The ability to provide safe and effective control across patients and clinical practice is a necessary requirement before being able to assess the impact of this GC on clinical outcomes.
Stochastic TARgeted (STAR) is a clinically model-based GC protocol on a clinically validated physiological model,16,17 which provides patient-specific recommendations for insulin and nutrition. It controls hyperglycemia and manages a maximum of 5% risk of mild hypoglycemia18,19 while using a larger target range. Since 2010, two hospitals have been using STAR protocol with 4.4–8.0 mmol/L target range as a standard of care for ICU GC, namely the Christchurch Hospital, New Zealand, and Kálmán Pándy Gyulá Hospital, Hungary. Stewart et al,15 have tested the performance, safety,and generality of this protocol in these two ICUs. However, its generality hasn’t been tested in a different background, such as Malaysia, which has an ethnically very different cohort with different clinical practice.
This paper presents the results and analysis of the STAR pilot trial in the International Islamic University Malaysia Medical Centre (IIUMMC) ICU. An internal study by fellow Malaysian collaborators indicates that 50% of Malaysian ICUs have the tendency to use a 6.0–10.0 mmol/L target range, and this is the same target range that is used in the IIUMMC using a sliding scale control. The main goal of this pilot trial is to assess performance, safety, and implementation issues on STAR using this target range. Specifically, the following areas of STAR protocol control were explored and presented in the following sections: i) Exploration of clinical GC performance and safety; and ii) Overview of treatment preference to reduce workload.
Methods and materials
STAR protocol
To optimize safety and performance, STAR uses a model-based time varying patient-specific insulin sensitivity (SI) to capture development in patient physiological condition, inter- and intra-patient fluctuation, and insulin-nutrition metabolism over time. Further details can be found in Lin et al,17 but, in short, the metabolic model uses accounts for endogenous secretion and clearance of glucose and insulin from blood and interstitial fluid compartments, as well as the appearance of exogenous insulin and nutrition.
Starting criteria was two blood glucose (BG) measurements over 10 mmol/L within a 1-hour period or any specific attending clinician choice. The default and benchmarked BG target range of STAR is 4.4–8.0 mmol/L (80–145 mg/dL) based on reduced risks with increased BG in intermediate bands.20 STAR is implemented in a tablet computer to provide an automated and specialized user interface into which nutrition and insulin information can be recorded and recommended. Nutrition in ICU patients is administered via enteral, total parenteral, or a combination of both routes.
Once a BG measurement has been taken and recorded, hour-to-hour insulin sensitivity (SI) is identified,21 and stochastic forecasting is used to determine likely future outcomes in insulin sensitivity for the next 1–3 hours. Likely BG outcomes are then computed, in particular, the 5th, 50th and 95th percentiles, allowing central tendencies and possible risks of extremes in BG to be evaluated. The insulin-nutrition combination for 1–3 hours intervention that best overlaps the resulting BG within a target range is selected and recommended by placing the 5th percentile BG outcome on the lower edge of the clinically specified target range.
STAR seeks to maximize nutrition delivery, while dosing insulin in this context. If, for maximum nutritional and insulin treatments, the BG outcome range does not sufficiently overlap the clinical target range, then STAR will recommend a drop in nutrition to maintain GC and reduce risk.19 The nutrition will be raised back to its daily target based on total energy requirements, as soon as possible. In cases where the nutrition must be clinically determined or switched off, STAR can be set to give insulin recommendations only.
Nutrition control in the IIUMMC ICU is done separately from STAR, but the given values are communicated directly to the STAR tablet. The guideline recommends a target energy intake of 25 kcal/kg/day and at least 1.2–1.5 g/kg/day of protein. For obese patients, 120% of Ideal Body Weight (IBW) or Actual Body Weight (ABW) times 0.25+IBW is used as a suggestion guideline (or use ABW for underweight patients). Energy intake should be adjusted according to the severity and type of illness while avoiding overfeeding.
When clinical opinion has determined that a patient is stable and insulin treatment should end or more than 5 hours has elapsed between treatment, STAR should be stopped. If insulin treatment is required again later, the patient is restarted and classified under a new episode. Additionally, in this ICU, the stopping criteria were when the BG is within the target range at insulin of 0.5 U/hour for 2 hours. Figure 1 summarizes the STAR work and GC logic.
 | Figure 1 Summary of the STAR protocol. Grey blocks refer to actions taken at patient bedside. Abbreviations: BG, blood glucose; STAR, Stochastic TARgeted. |
The default target range can be changed based on clinical team consultation. In this study, the target range was increased to 6.0–10.0 mmol/L (106–180 mg/dL) following the standard care range in IIUMMC ICU. Hyperglycemia has been defined as a blood glucose level higher than 10.0 mmol/l, but this BG level is not considered as alarming in the Malaysian ICU. Insulin was delivered as infusion with 0.5 U/hour increment with a maximum dose of 8 U/hour. BG measurements were made using B-Braun glucometers (Melungen, Germany). STAR then identifies a new insulin rate, which was then given by the nurse. The time interval until the next BG measurement is also selected by the medical staff based on available 1–3 hourly treatment recommendations.
Pilot trial patients
By default, all patients satisfying the inclusion criteria along with their agreement were included in this pilot trial. A few patients clinically determined to be treated using insulin bolus instead of infusion were, however, excluded. In this trial for Malaysian critically ill patients, 269 episodes of insulin infusion treatment under STAR (totaling 11,127 hours) from 88 patients were extracted. All data are from January 2017 to mid-September 2018, and all patients, except one Indian (episode 59a) were of Malay ethnicity. All of the patients were treated using the hospital’s standard target range of 6.0–10.0 mmol/L.
One hundred and twenty-seven “small” episodes were eliminated because they had less than 20 hours of control using STAR. These were removed to avoid bias in the analysis as the time taken to reduce BG into the target range is proportionally larger. This study was finally executed using 142 episodes, from 81 patients (9,587 hours). Twenty-eight patients had more than one insulin treatment episode on STAR due to recurrent hyperglycemia. Their per-episode data are labeled with a number for patient identification and a letter for episode. The patients included in the study had a prevalence of males. The Ethics Committee of IIUMMC granted approval for this trial and the audit, analysis, and publication of these data. The IIUM Research Ethics Committee (IREC) operates in accordance with the Declaration of Helsinski, International Conference of Harmonization Good Clinical Practice Guidelines (ICH-GCP), Malaysia Good Clinical Practice Guidelines, and Council for International Organizations of Medical Sciences (CIOMS) International Ethical Guidelines. Figure 2 sums the patient/episode selection process.
 | Figure 2 Summary of the cohort data and its selection for analysis.Abbreviations: STAR, Stochastic TARgeted. |
Control performance, safety, and compliance
The safety and performance of STAR were assessed using the following definitions:
- Performance:
- Number of BG measurements in different BG bands and the normoglycemia, 4.0–10.0 mmol/L (72–180 mg/dL) band.
- Number of hyperglycemic incidents (BG measurement >10 mmol/L).
- Safety:
Due to irregular sampling intervals, per-patient episode BG data were analyzed and used after linear interpolation at hourly intervals. The interpolation is done on the BG measurements to fill the BG values when the options of 2-hourly and 3-hourly treatment were selected. This choice ensures a fair comparison between different protocols, and linear interpolation has been shown to be the optimal choice.23 Statistical assessment was done using standard metrics, as proposed by Finfer et al24.
- Measures of central tendency and dispersion: The mean, median, and inter-quartile range (IQR) per patient (or per episode).
- Range and exposure measures: The percentage of time the measurement is in the target range and the percentage of time the measurement is outside a nominated target range.
Additionally, preference of treatment from STAR was assessed in this study focusing on the chosen treatments and available 1–3 hourly recommendations. The number of times a treatment was chosen is calculated to see the tendency to introduce less workload and the trust on automated recommendations.
Results
BG control performance and safety
The clinical results are presented in Table 1. A totla of 7,012 measurements were taken within 9,587 hours, with an average measurement interval of 1.37 hours. Interpolation of BG measurement resulted in 9,654 measurements; 39.6% of BG was within 4.4–8.0 mmol/L, and 60.7% was within the 6.0–10.0 mmol/L target range. The cohort’s BG median value was 8.5 mmol/L. The percentage of BG >10.0 mmol/L was 28.4%. There were 100 mild hypoglycemia (in 42 episodes) and six severe hypoglycemia (in five episodes) incidences. The median and IQR nutrition rates reported in Table 1 are based on the recorded STAR nutrition rates by clinical staff based on their nutrition control recorded in the tablet. All hypoglycemia and hyperglycemia incidences were manually verified. Figure 3 illustrates per-episode BG measurements, episode 1a to 81a from left to right in a boxplot representation.
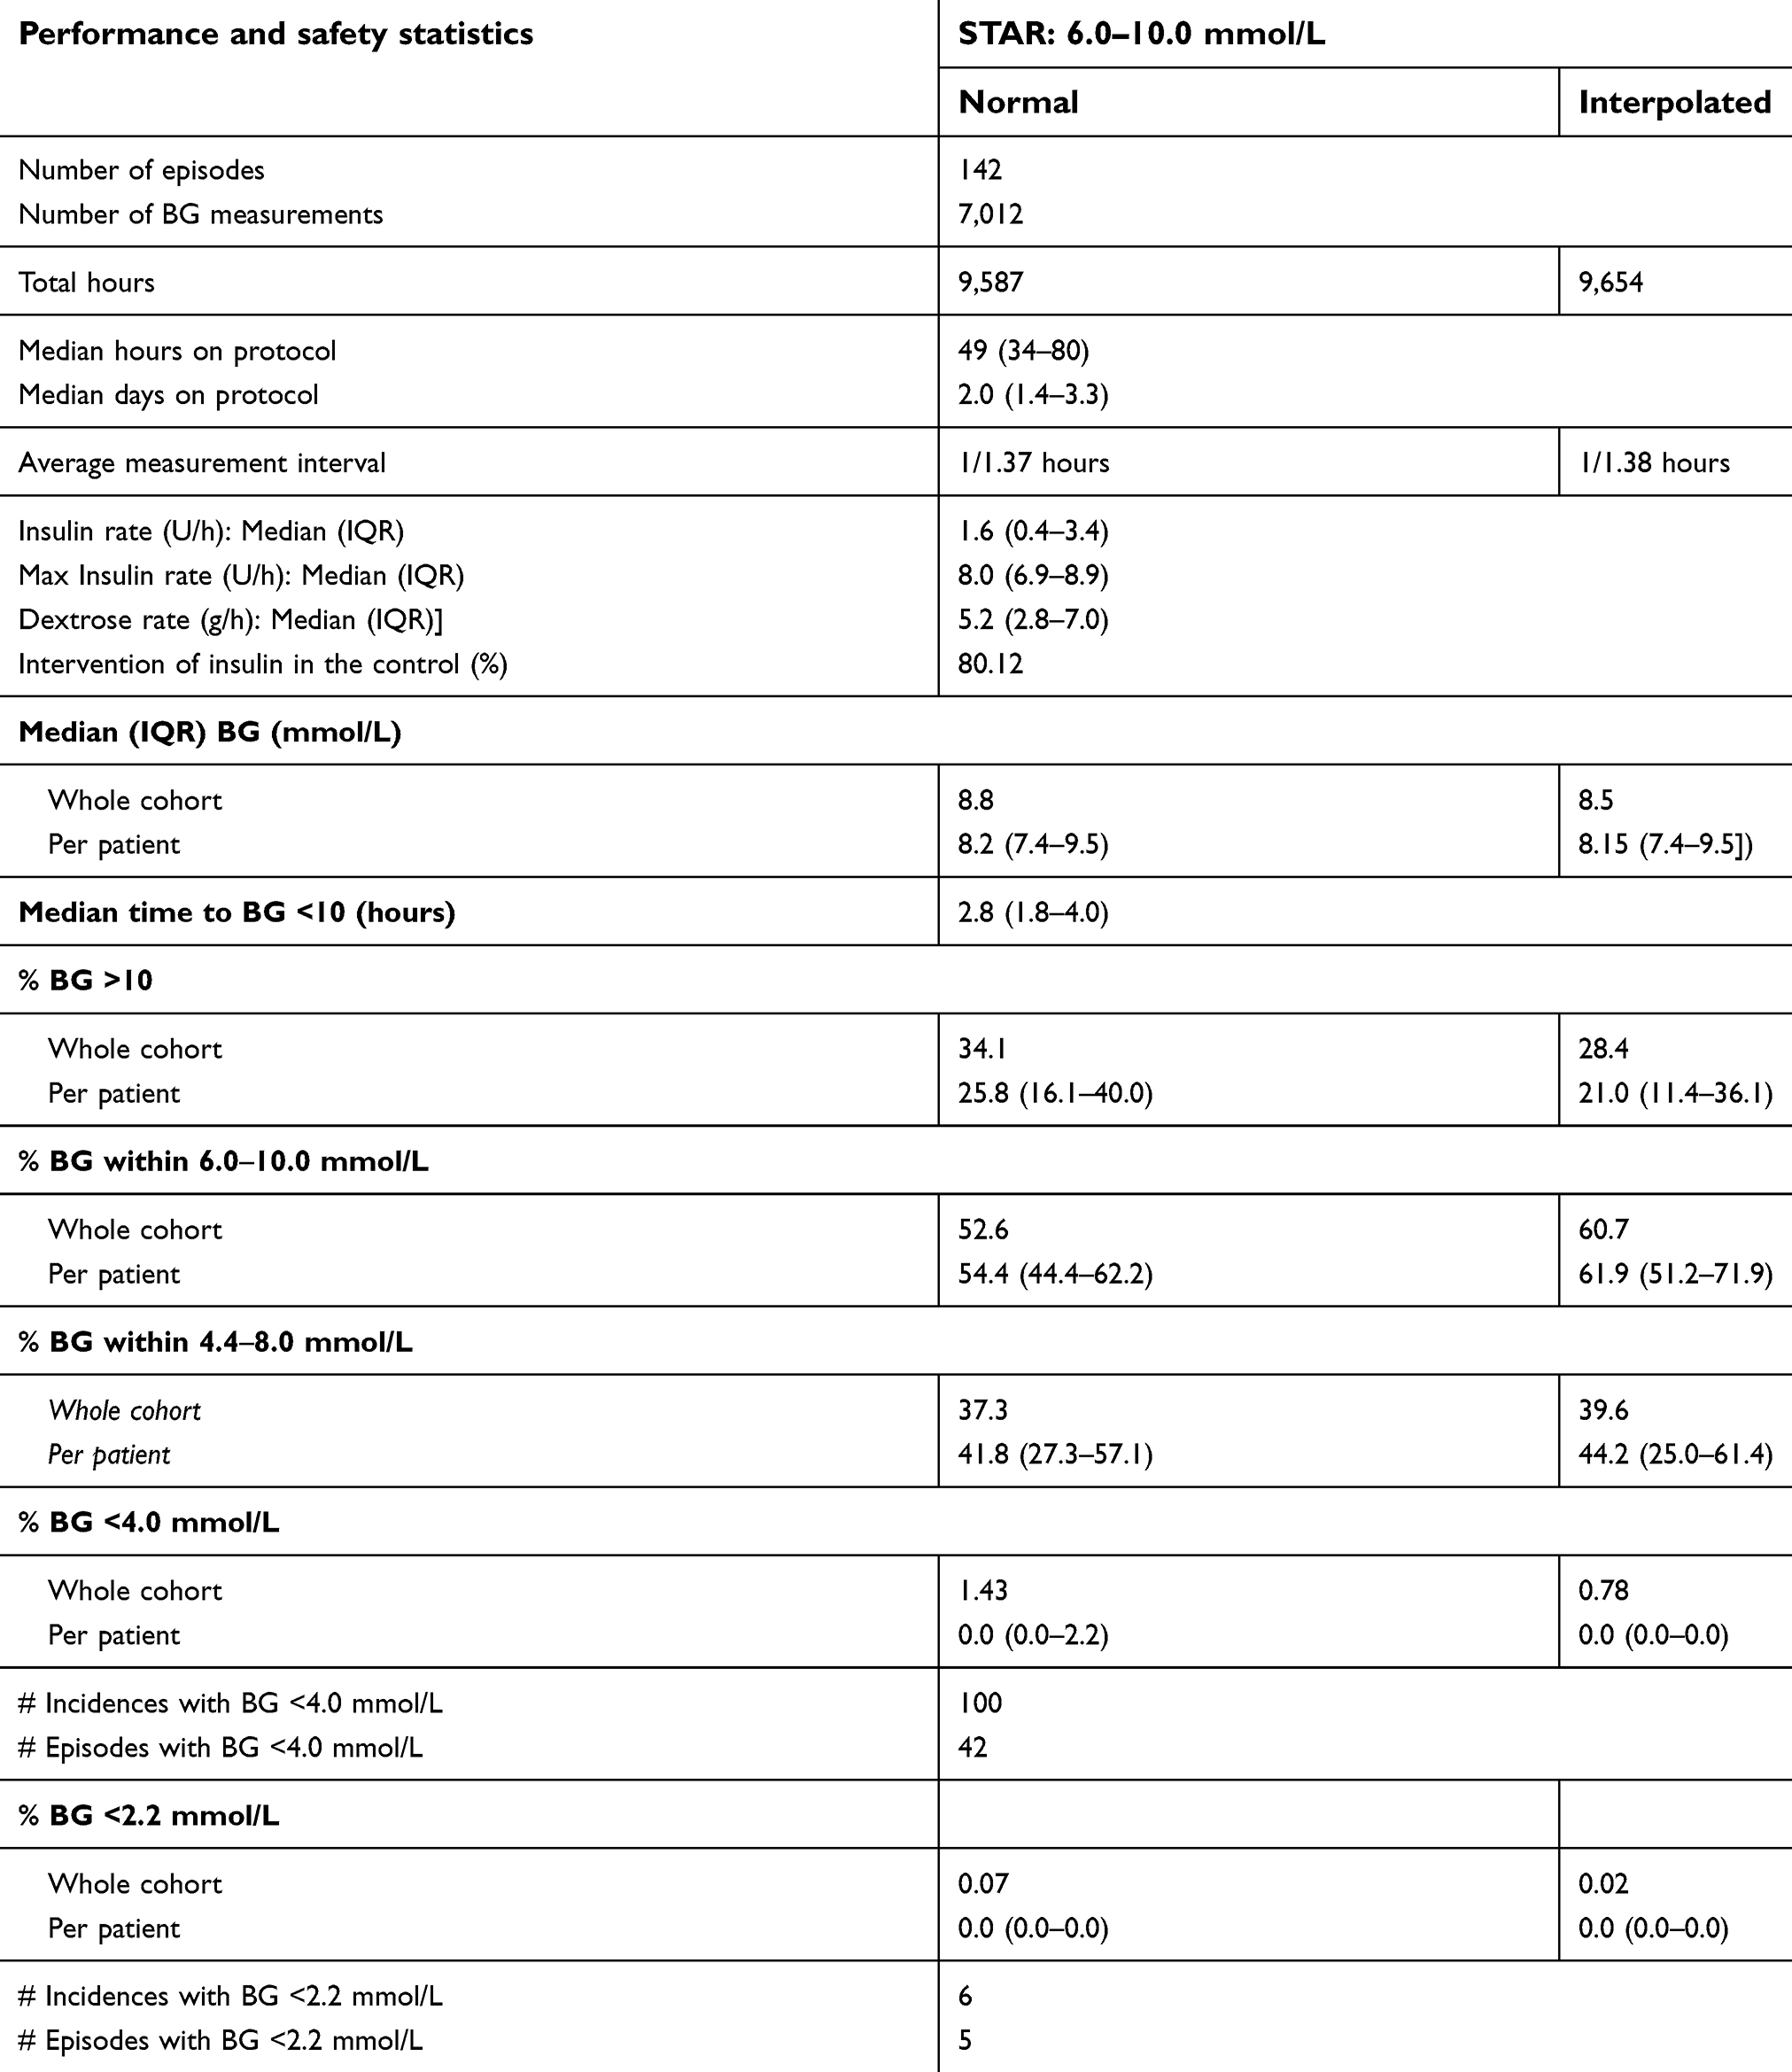 | Table 1 Cohort and per-patient glycemic control results |
 | Figure 3 Per-patient boxplots of BG measurements. Abbreviation: BG, blood glucose. |
An example of individual patient episode results can be referred to in Figure 4. Thisshows the time course for BG (measurement and model fit), insulin (plasma, interstitial and infused), nutrition (enteral and parenteral nutrition), and SI in episode 38a. This episode has one severe hypoglycemia incidence at t=31.5 hours due to stoppage of enteral nutrition. Per-episode BG Cumulative Distributive Functions (CDFs) are shown in Figure 5. The whole cohort median is shown as a dashed line, while the 25–75% range is presented as a dark blue interval and 5–95% is in the light blue interval. Even though many of the BG measurements were outside of the target control, most of the patients BG levels were within the 25th and 75th percentile of the whole cohort’s BG median.
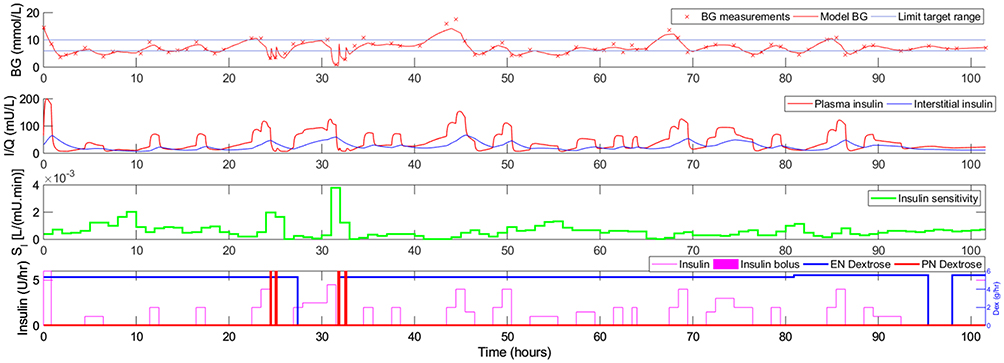 | Figure 4 Episode 38a.Abbreviations: I, plasma insulin; Q, interstitial insulin; SI, insulin sensitivity; BG, blood glucose; EN, enteral nutrition; PN, perenteral nutrition. |
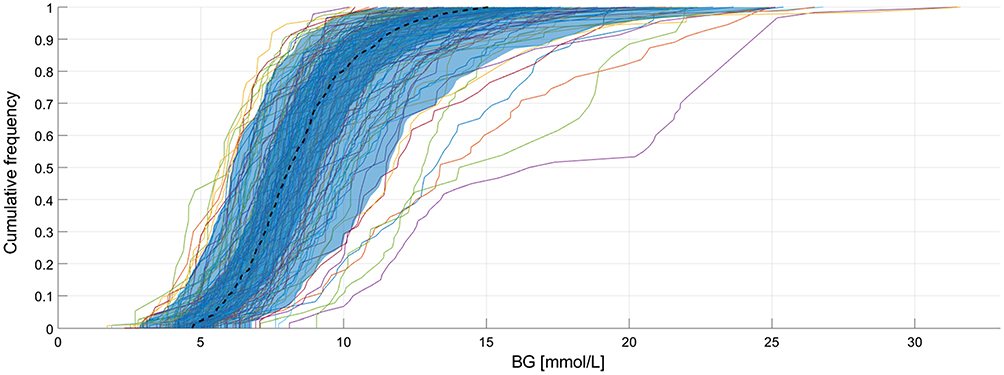 | Figure 5 Per-episode BG CDFs defined on whole cohort.Abbreviations: BG, blood glucose; CDFs, cumulative distributive functions. |
BG treatment preference
Table 2 shows the number of 1–3 hourly recommended treatments. It also shows the number of chosen treatment when each type of the treatment were available; 68.7% of 2-hourly and 78.5% of 3-hourly options were selected when these were available with the 1-hourly and 1 plus 2-hourly options. This shows that, when 2- and 3-hourly options were available, clinical staff chose the option than could reduce workload. These options were, however, only chosen for 26.3% of the total treatment. The total number of available treatments is equal to the total number of 1-hourly available treatment, 8,359, and the 2- and 3 -hourly options were chosen only 2,202 times. The majority of cases were still treated within a 1 hour interval.
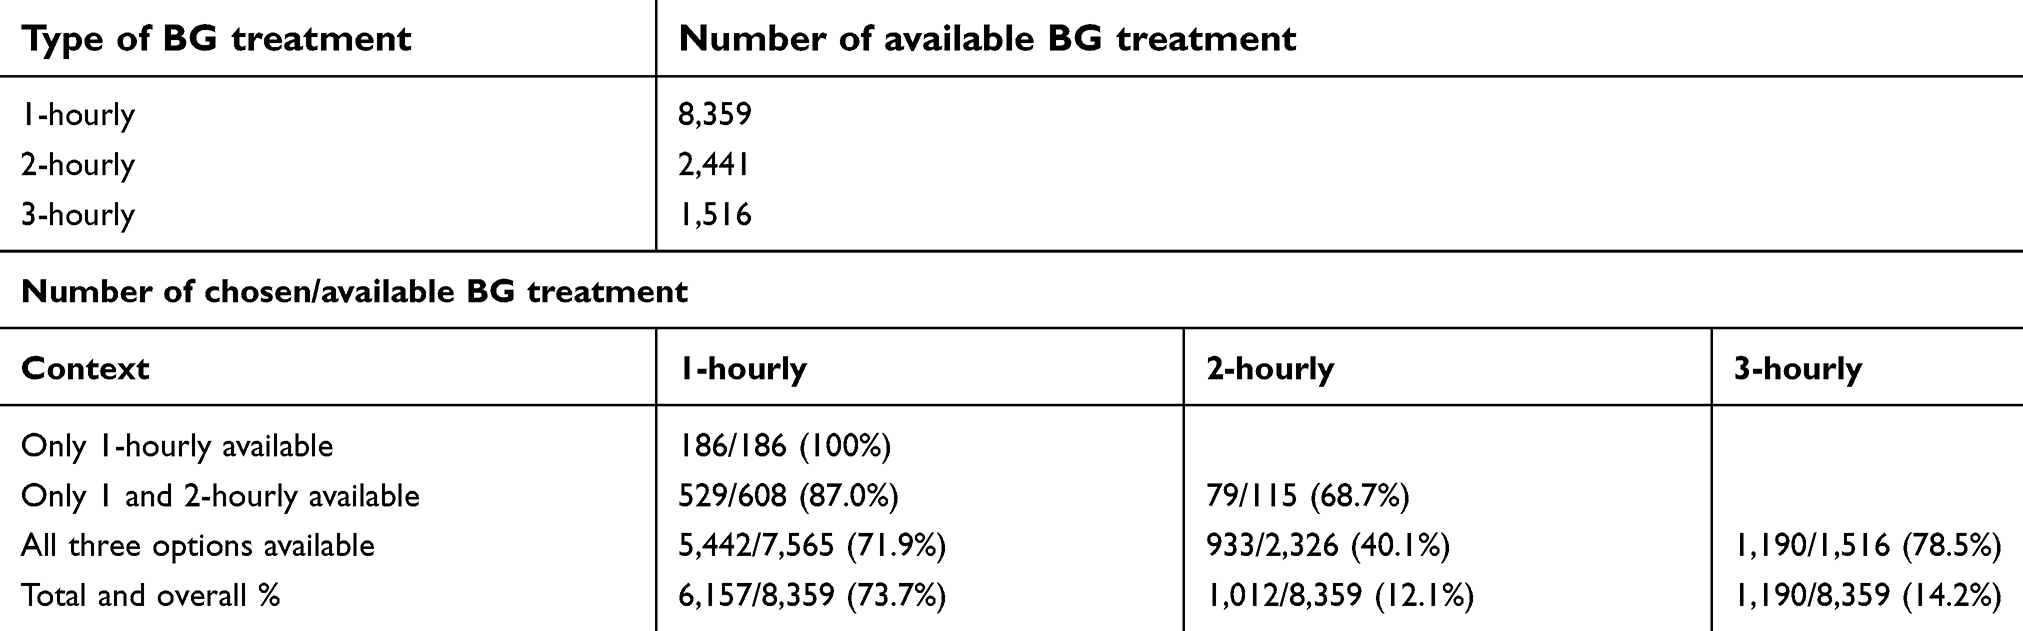 | Table 2 1–3 hourly treatment chosen for each episode |
Discussion
The objective of this pilot trial is to look at the performance, safety, and treatment preference for STAR protocol implementation in a Malaysian ICU. This trial used a 6.0–10.0 mmol/L target range to suit the practice in respective IIUMMC ICUs. The clinical assessments resulted in a correct performance, 60.7% in the target range and 70.84% in the normoglycemia, 4.0–10.0 mmol/L range. The percentage of BG measurements higher than 10 mmol/L was 28.4%, but this can be attributed to the starting BGs, which were relatively high (cf. the histogram of starting BG frequencies in Figure 6). Nevertheless, STAR have a median time to BG <10.0 mmol/L of 2.8 (1.8–4.0) hours only, indicating its fast acting control to bring patient BG to the target range. Note that 10 episodes were started with BG less than 10 mmol/L (cf. Figure 6), indicating the exceptional cases decided by attending clinicians. In term of safety, only 0.78% of cohort measurements were below 4.0 mmol/L, which is less than 5%, as promised by STAR. However, individually 14 episodes had more than 5% of mild hypoglycemia, the limit set in the control, which deserves further individual diagnosis. Five episodes were diagnosed with severe hypoglycemia, their individual results are further elaborated in Table S1 in the Supplementery materials with potential diagnoses.
 | Figure 6 Histogram for starting blood glucose level. |
To compare the performance of the IIUMMC STAR trial with results from Christchurch and Gyulá as reported in Stewart et al,15 a cohort with a minimum 10 hours of measurement was studied and the comparison is presented in Table 3. Additional episodes were added to the initial cohorts which presented with a 20 hours measurement minimum. For this cohort, a median of 61.5% of time, the cohort’s BG is within their target range. This number is relatively low as compared to the 86.6 (75.0–94.1)% (Christchurch) and 87.1 (79.3–91.1)% (Gyulá) in the 4.4–8.0 mmol/L target range. Furthermore, a staggering 28.4% of the measurements are hyperglycemic, as compared to 4.4% and 3.0% in Christchurch and Gyulá, respectively. A revision of the target range for Malaysian patients is proposed to lower the number of hyperglycemic incidences while maintaining the performance and safety. Second, the results also question the accuracy of prediction from the stochastic model,16 which was developed using the Christchurch patient population with potentially very different SI profiles. The SI profiles of the IIUMMC cohort can be referred to in Figure S1, where the majority of patients have very low SI, and lower than the Christchurch patients.13
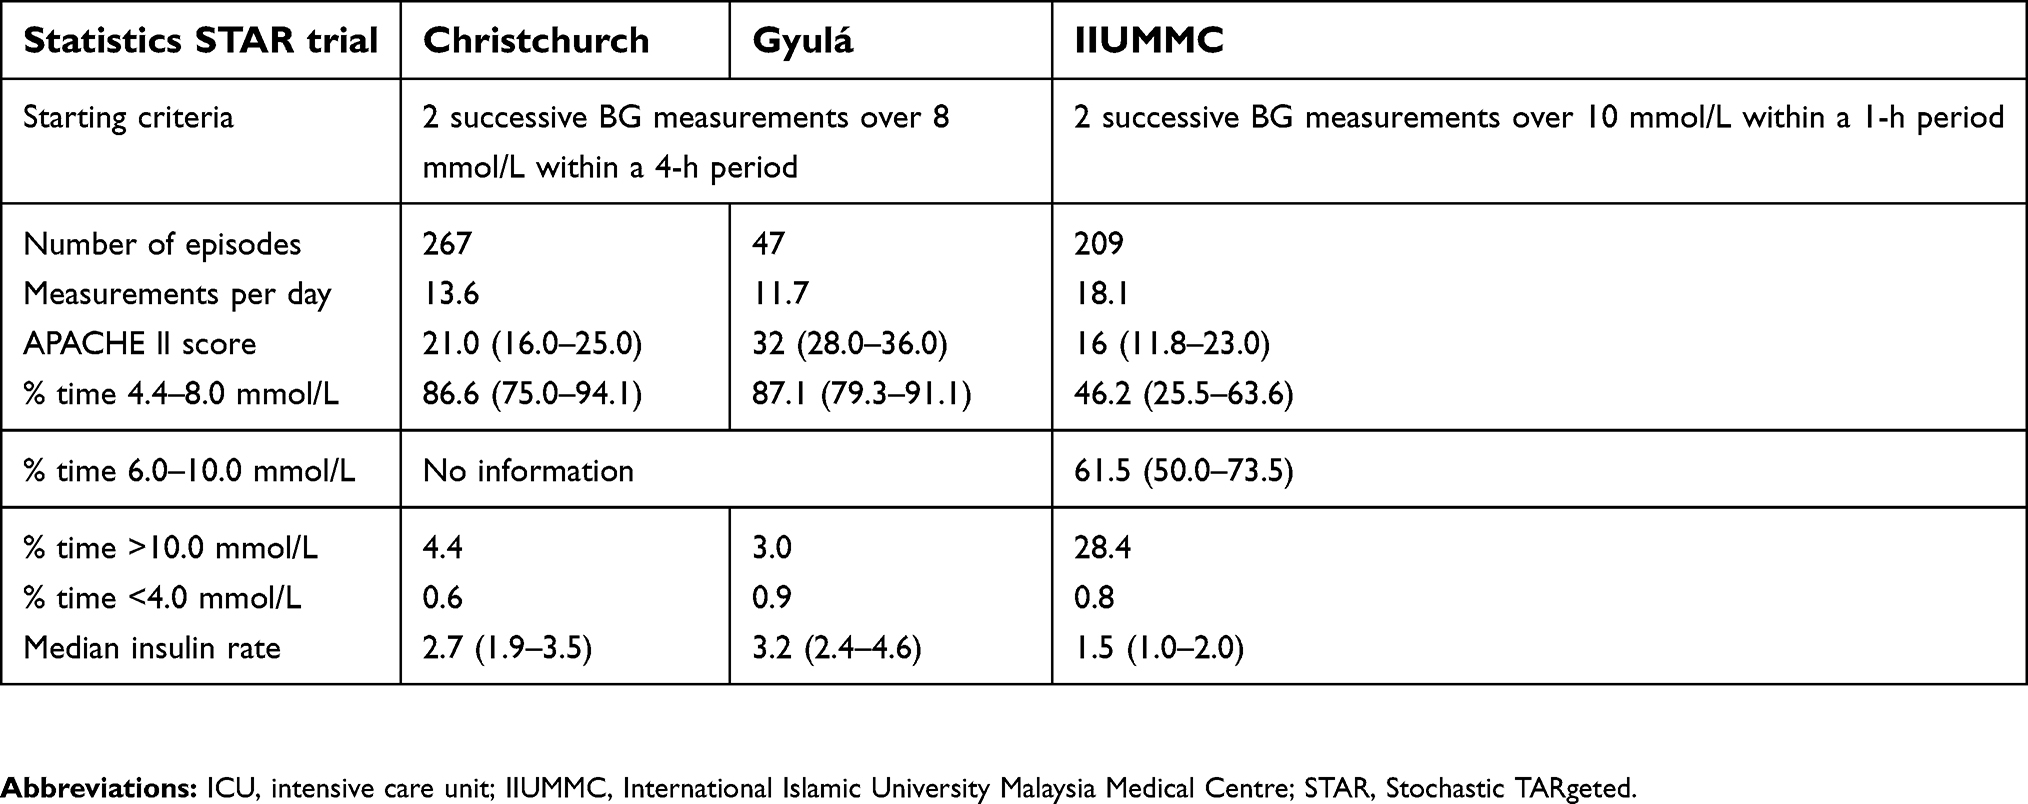 | Table 3 Per-episode hourly interpolated glycemic control results for the three STAR cohorts in IIUMMC, Christchurch and Gyulá Hospital ICUs |
 | Figure S1 Per-episode insulin sensitivity (SI) profiles for the pilot trial cohort. |
In light of flexibility of work reduction, between 2-hourly and 3-hourly options when they were available, clinical decisions tended to go for the longer option. This tendency showed the faith in the protocol recommendations. However, in terms of general workload, these choices only contributed to 26.3% of overall treatment, and 73.7% were of 1-hourly treatments. The average measurement per day is 18.1, as compared to 13.6 and 11.7 in Christchurch and Gyulá, respectively. The results show that most patients were offered with single choice treatment, the 1-hourly and this can be attributed to the generally low SI patient. For example, episode 63a has 618 BG measurements with a median SI of 1.1E10-4 (Lower than the cohort’s median of 1.97E10-4), 82.1% of the time was treated with 1-hourly options.
A comparison of performance towards the nutrition intervention cannot be done as the IIUMMC pilot trial is an insulin only control, and recorded dextrose does not 100% represent the real nutrition delivery in the hospital. This leads to the question of whether a better performance can be achieved if the GC control is paired with STAR-based nutrition control.25 The median (IQR) insulin (U/h) rate is 1.5 (1.0–2.0). Statistically, this value is the lowest and closer to Christchurch as compared to Gyulá, as is the APACHE II score between the three cohorts. Less severity of illness factor contributes to the overall insulin intervention, despite the low SI. Figure 7 illustrates the percentage of time insulin is given with specific rates resulting to insulin intervention of 66.3%, with only 3.1% of higher insulin administration with advice from intensivists. A revision of the target range can have an impact on the value of insulin administered. However, at this point of analysis, no conclusion can be made whether a smaller/lower target range results in lower insulin or not.
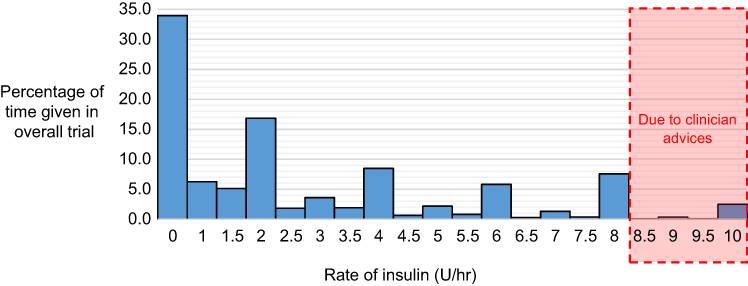 | Figure 7 Percentage of insulin rate given over overall administration. |
Conclusions
This pilot clinical trial is the first attempt to use the STAR protocol in a Malaysian ICU. The main objective is to test its implementation performance, safety, and trust on the flexible 1–3 hourly treatment. The trial was performed using Malaysia standard, but a higher target range, as IIUMMC staff were more comfortable with it. Results show that STAR is adaptable with the higher target range and provided correct performance and safety. STAR promises a lower workload with the 1–3 hourly treatment options, and the trial proves the staff preference and trust in the 2- and 3-hourly recommendations when available. However, the expected performance in the target range is still considered low as the expectant is towards >85% with lower hyperglycemia measurements. Furthermore, STAR in most cases offered only 1-hourly treatment. The provided analysis justifies improvement for STAR protocol parameters such as its prediction model to consider a multi-center population, especially for patients with very low SI. Second, with or without prediction model improvement, a study on the optimized target range shall be done to consider such a clinical environment.
Abbreviations list
ABW, actual body weight; BG, blood glucose; CDF, cumulative density function; DM, diabetes mellitus; EN, enteral nutrition; GC, glycemic control; IBW, ideal body weight; ICU, intensive care unit; IQR, interquartile range; SI, insulin sensitivity; STAR, Stochastic TARgeted.
Data sharing statement
Individual participant data are expected to be shared and be made available by personal request to the corresponding author.
Acknowledgments
Written informed consent was obtained for all patients, and approval (IREC 657) was granted for this study by the International Islamic University Malaysia Medical Centre (IIUMMC) Research Ethics Committee and National Institutes of Health Malaysia (NIH). The authors thankfully acknowledge the IIUMMC ICU clinical team for their support and provision of data for the pilot study. The authors also acknowledge a Fundamental Research Grant Scheme (FRGS) from the Ministry of Higher Education (MOHE) and UNITEN BOLD grant scheme from UNITEN for their support on the ongoing research.
Disclosure
The authors declare that they have no competing interests in this work.
References
1. Marik PE, Raghavan M. Stress-hyperglycemia, insulin and immunomodulation in sepsis. Intensive Care Med. 2004;30(5):748–756. doi:10.1007/s00134-004-2361-y
2. McCowen KC, Malhotra A, Bistrian BR. Stress-induced hyperglycemia. Crit Care Clin. 2001;17(1):107–124. doi:10.1016/S0749-0704(05)70154-8
3. Ellahham S. Insulin therapy in critically ill patients. Vasc Health Risk Manag. 2010;6:1089. doi:10.2147/VHRM
4. Dungan KM, Braithwaite SS, Preiser JC. Stress hyperglycaemia. Lancet. 2009;373(9677):1798–1807. doi:10.1016/S0140-6736(09)60553-5
5. Bistrian BR. Hyperglycemia and infection: which is the chicken and which is the egg? J Parenter Enteral Nutr. 2001;25(4):180–181. doi:10.1177/0148607101025004180
6. Capes SE, Hunt D, Malmberg K, Gerstein HC. Stress hyperglycaemia and increased risk of death after myocardial infarction in patients with and without diabetes: a systematic overview. Lancet. 2000;355(9206):773–778. doi:10.1016/S0140-6736(99)08415-9
7. Van Den Berghe G, Wouters PJ, Bouillon R, et al. Outcome benefit of intensive insulin therapy in the critically ill: insulin dose versus glycemic control. Crit Care Med. 2003;31(2):359–366. doi:10.1097/01.CCM.0000045568.12881.10
8. Krinsley JS. Glycemic variability: a strong independent predictor of mortality in critically ill patients. Crit Care Med. 2008;36(11):3008–3013. doi:10.1097/CCM.0b013e31818b38d2
9. Chase J, Shaw G, Le Compte A, et al. Implementation and evaluation of the sprint protocol for tight glycaemic control in critically ill patients: a clinical practice change. Crit Care. 2008;12(2):49. doi:10.1186/cc6996
10. Brunkhorst FM, Engel C, Bloos F, et al. Intensive insulin therapy and pentastarch resuscitation in severe sepsis. N Engl J Med. 2008;358(2):125–139. doi:10.1056/NEJMoa070716
11.
12. Marik PE, Preiser JC. Toward understanding tight glycemic control in the ICU: a systematic review and metaanalysis. Chest J. 2010;137(3):544–551. doi:10.1378/chest.09-1737
13. Uyttendaele V, Dickson JL, Shaw GM, Desaive T, Chase JG. Untangling glycaemia and mortality in critical care. Crit Care. 2017;21(1):152. doi:10.1186/s13054-017-1686-1
14. Chase JG, Le Compte AJ, Suhaimi F, et al. Tight glycemic control in critical care–the leading role of insulin sensitivity and patient variability: a review and model-based analysis. Comput Methods Programs Biomed. 2011;102(2):156–171. doi:10.1016/j.cmpb.2010.11.006
15. Stewart KW, Pretty CG, Tomlinson H, et al. Safety, efficacy and clinical generalization of the star protocol: a retrospective analysis. Ann Intensive Care. 2016;6(1):24. doi:10.1186/s13613-016-0125-9
16. Lin J, Lee D, Chase JG, et al. Stochastic modelling of insulin sensitivity and adaptive glycemic control for critical care. Comput Methods Programs Biomed. 2008;89(2):141–152. doi:10.1016/j.cmpb.2007.04.006
17. Lin J, Razak NN, Pretty CG, et al. A physiological intensive control insulin-nutrition-glucose (icing) model validated in critically ill patients. Comput Methods Programs Biomed. 2011;102(2):192–205. doi:10.1016/j.cmpb.2010.12.008
18. Fisk LM, Le Compte AJ, Shaw GM, Penning S, Desaive T, Chase JG. Star development and protocol comparison. IEEE Trans Biomed Eng. 2012;59(12):3357–3364. doi:10.1109/TBME.2012.2214384
19. Evans A, Shaw GM, Le Compte A, et al. Pilot proof of concept clinical trials of stochastic targeted (star) glycemic control. Ann Intensive Care. 2011;1(1):38. doi:10.1186/2110-5820-1-38
20. Krinsley JS, Preiser JC. Time in blood glucose range 70 to 140 mg/dl 80% is strongly associated with increased survival in non-diabetic critically ill adults. Crit Care. 2015;19(1):179. doi:10.1186/s13054-015-0908-7
21. Docherty PD, Chase JG, Lotz TF, Desaive T. A graphical method for practical and informative identifiability analyses of physiological models: a case study of insulin kinetics and sensitivity. Biomed Eng Online. 2011;10(1):39. doi:10.1186/1475-925X-10-39
22. Egi M, Bellomo R, Stachowski E, et al. Hypoglycemia and outcome in critically ill patients. Mayo Clin Proc. 2010;85:217–224. doi:10.4065/mcp.2009.0394
23. Stewart KW, Pretty CG, Shaw GM, Chase JG. Interpretation of retrospective BG measurements. J Diabetes Sci Technol. 2018;12(5):967–975. doi:10.1177/1932296818786518
24. Finfer S, Wernerman J, Preiser JC, et al. Clinical review: consensus recommendations on measurement of blood glucose and reporting glycemic control in critically ill adults. Crit Care. 2013;17(3):229. doi:10.1186/cc12734
25. Zafirah RC, Jamaludin UK, Khalijah K, et al. Study on the blood glucose management with controlled goal feed in Malaysian critically ill patients. IOP Conf Ser. 2019;469(1). doi:10.1088/1757-899X/469/1/012097.
Supplementary materials
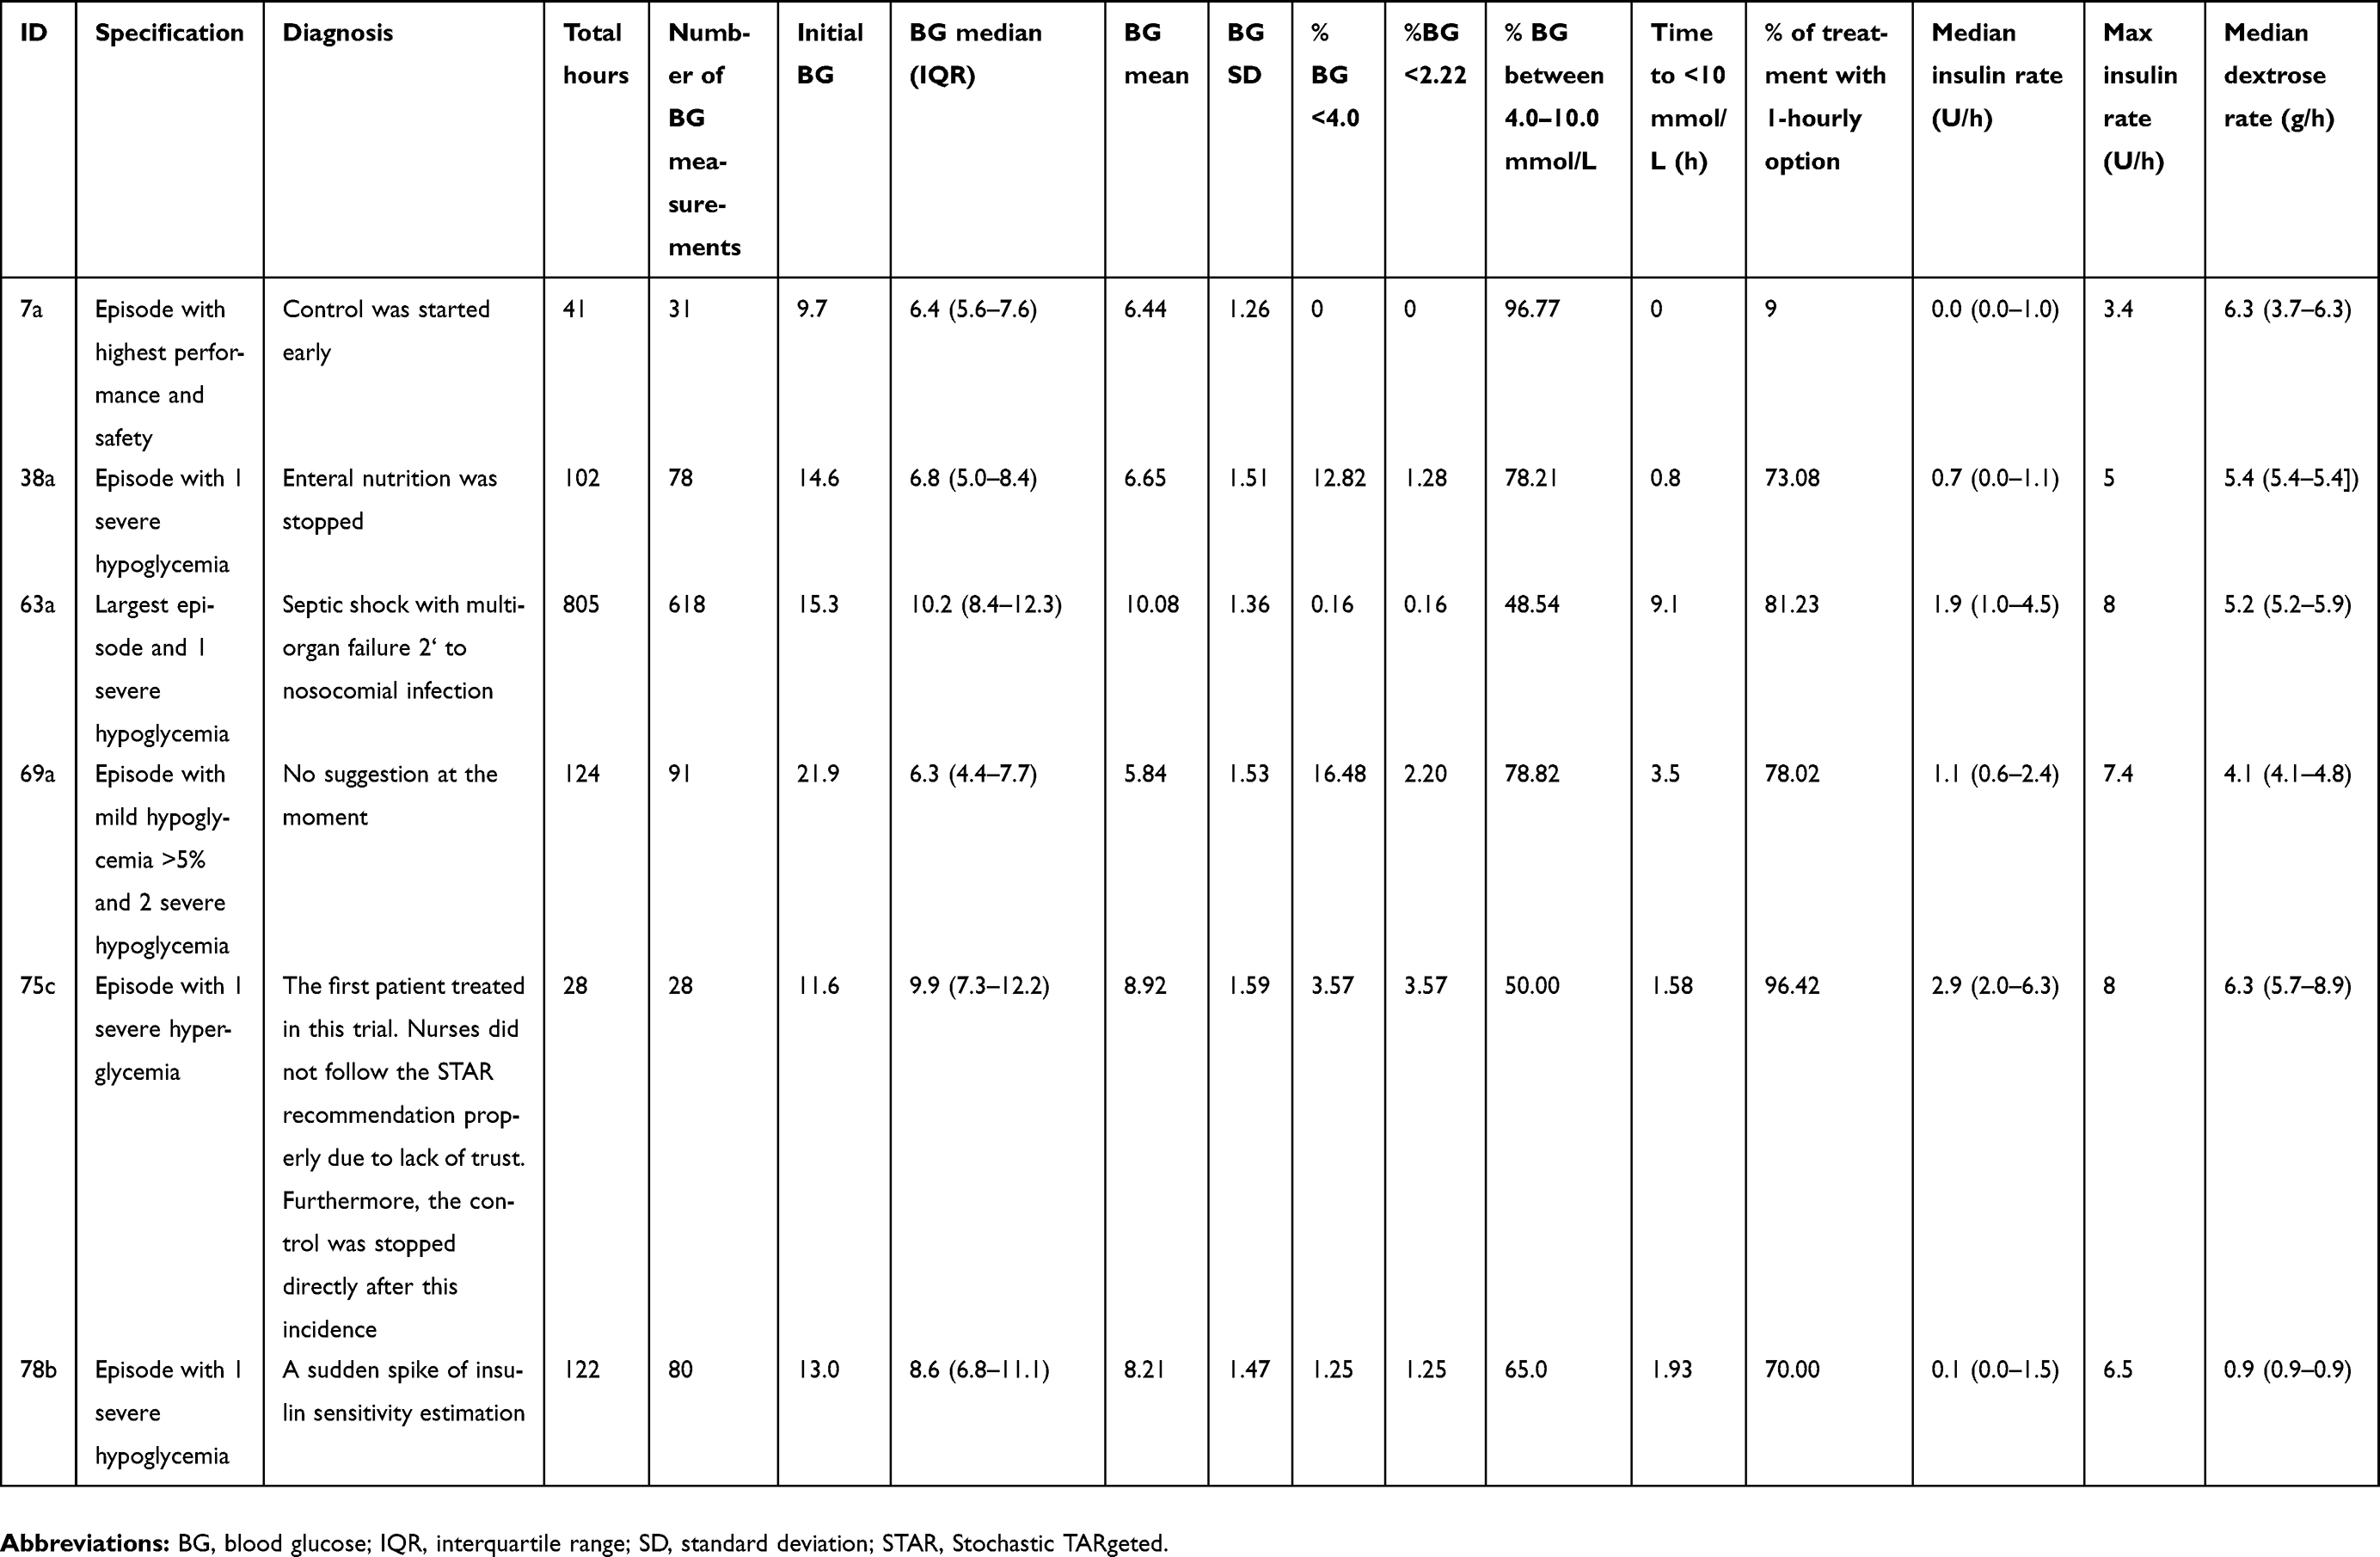 | Table S1 Patient details for 5 episodes with severe hypoglycemia. Selected clinical results with potential diagnosis |
 © 2019 The Author(s). This work is published and licensed by Dove Medical Press Limited. The
full terms of this license are available at https://www.dovepress.com/terms
and incorporate the Creative Commons Attribution
- Non Commercial (unported, 3.0) License.
By accessing the work you hereby accept the Terms. Non-commercial uses of the work are permitted
without any further permission from Dove Medical Press Limited, provided the work is properly
attributed. For permission for commercial use of this work, please see paragraphs 4.2 and 5 of our Terms.
© 2019 The Author(s). This work is published and licensed by Dove Medical Press Limited. The
full terms of this license are available at https://www.dovepress.com/terms
and incorporate the Creative Commons Attribution
- Non Commercial (unported, 3.0) License.
By accessing the work you hereby accept the Terms. Non-commercial uses of the work are permitted
without any further permission from Dove Medical Press Limited, provided the work is properly
attributed. For permission for commercial use of this work, please see paragraphs 4.2 and 5 of our Terms.