Back to Journals » Nanotechnology, Science and Applications » Volume 12
Magnetically controlled protein nanocontainers as a drug depot for the hemostatic agent
Authors Prilepskii A ![]() , Schekina A
, Schekina A ![]() , Vinogradov V
, Vinogradov V ![]()
Received 11 February 2019
Accepted for publication 3 July 2019
Published 30 July 2019 Volume 2019:12 Pages 11—23
DOI https://doi.org/10.2147/NSA.S204621
Checked for plagiarism Yes
Review by Single anonymous peer review
Peer reviewer comments 3
Editor who approved publication: Professor Israel Rubinstein
Video abstract presented by Artur Prilepskii.
Views: 5751
Artur Prilepskii, Alexandra Schekina, Vladimir Vinogradov
ITMO University, International Institute “Solution Chemistry of Advanced Materials and Technologies” (SCAMT), Saint Petersburg 191002, Russian Federation
Purpose: Currently, there is a number of successfully implemented local hemostatic agents for external bleedings in forms of wound dressings and other topical materials. However, little has been done in the field of intravenous hemostatic agents. Here, we propose a new procedure to fabricate biocompatible protein nanocontainers (NCs) for intravenous injection allowing magneto-controllable delivery and short-term release of the hemostatic agent ϵ-aminocaproic acid (EACA).
Methods: The nanocontainers were synthesized by the desolvation method from bovine serum albumin (BSA) using methanol without any further crosslinking. Polyethylene glycol (PEG) was used both as a stabilization agent and for size control. Characterization of nanocontainers was performed by the transmission and scanning electron microscopy, dynamic light scattering, X-ray diffraction, and FTIR spectroscopy. Cytotoxicity was estimated using MTT assay. The dopant release from nanocontainers was measured spectrophotometrically using rhodamine B as a model molecule. The specific hemostatic activity was assessed by analyzing clot lysis and formation curve (CloFAL). Moreover, the ability for magneto targeting was estimated using the original flow setup made of a syringe pump and silicon contours.
Results: Fabricated nanocontainers had an average size of 186±24 nm and were constructed from building blocks–nanoparticles with average size ranged from 10 to 20 nm. PEG shell was also observed around nanocontainers with thickness 5–10 nm. NCs were proved to be completely non-cytotoxic even at concentrations up to 8 mg BSA/mL. Uptake capacity was near 36% while release within the first day was 17%. The analysis of the CloFAL curve showed the ability of NCs to inhibit the clot lysis successfully, and the ability of magneto targeting was confirmed under flow conditions.
Conclusion: The ability of synthesized NCs to deliver and release the therapeutic drug, as well as to accumulate at the desired site under the action of the magnetic field was proved experimentally.
Keywords: protein nanocontainers, magnetite nanoparticles, hemostasis, ϵ-aminocaproic acid, drug delivery
Introduction
Protein nanoparticles have long been investigated as a potential biocompatible platform for the delivery of a wide range of medical substances.1 The most common and suitable proteins for the synthesis of nanoparticles are ovalbumin (OVA), bovine serum albumin (BSA) and human serum albumin (HSA), but almost any protein can be used.2–5 Methods to synthesize protein nanoparticles are limited to a combination of desolvation and further stabilization by crosslinking. Glutaraldehyde is usually used as a crosslinker, although there are other types of chemical agents with similar action, for example, 3,3´-dithiobis(sulfosuccinimidylpropionate) (DTSSP) or bis(sulfosuccinimidyl)suberate (BS).6 They mainly differ by the formation of less stable bonds between protein molecules allowing particles to easily decay under the action of enzymes. However, in most reports, glutaraldehyde is still used, even though it possesses cytotoxicity and particles obtained are characterized by broad polydispersity.7,8 Ethanol commonly acts as a desolvating agent, yet this result in rather large nanoparticles with typical sizes around 200–400 nm.9 Such nanoparticles cannot be employed as an intravenous delivery platform because of filtering capabilities of the spleen and well-known protein corona effect.10 Other desolvating agents, in combination with the varying of the ionic strength in a solution, makes it possible to obtain smaller nanoparticles.5,8 In some studies, protein nanoparticles are used as a platform for delivering large molecules, such as hormones or proteins.11,12 Still, the stage of desolvation extremely negatively affects the specific activity of enzymes even to the point of the full activity loss. To avoid this, some works were devoted to the creation of protein nanocontainers (NCs) without desolvation procedure, in which the microemulsions method was applied, when a water-insoluble drug is loaded into a protein shell.13,14 However, these syntheses are mainly complex and time-consuming.
In this paper, we propose a relatively simple approach that combines separate discoveries in the synthesis of protein nanoparticles. With it, we have achieved the fabrication of magnetically-controlled nanocontainers stable for several hours and providing prolonged drug release. To prove the ability of local drug delivery, we take a hemostatic agent ε-aminocaproic acid, which is commonly used during a surgical operation to cease the bleeding. The problem of blood loss reduction during surgical operations is still one of the main problems in surgical practice.15 The main difficulties in the development of new drugs intended for bleed ceasing are connected with the possibility for local application of hemostatic agents, low toxicity for surrounding tissues, and the absence of the side effects. Work on the creation of local hemostatic agents has been going on for quite some time, and now several medicinal substances are used as local hemostatic drugs.16,17 They include Spongostan and Surgicel, which work on the principle of sponges, absorbing blood and providing additional activation of platelets in a wound.18 Here, it should be noted that there are at least two types of hemostatic drugs, which are fundamentally different in their action. The first group can be attributed to such a substance as thrombin, which immediately converts fibrinogen to fibrin, forming a thrombus at the site of application.19,20 The second group consists of substances that prevent the dissolution of a formed blood clot, so-called antifibrinolytics. These substances include ε-aminocaproic acid (EACA) and tranexamic acid.21,22 These acids are synthetic analogs of the amino acid lysine, and their primary mechanism of action is connected with the binding to the lysine sites of plasminogen and plasmin, which leads to the inhibition of both the conversion process of plasminogen into plasmin and plasmin binding to fibrin.23 These acids are used in the form of intravenous infusions, but there is also a topical way of application.24 Among the most severe side effects of these drugs, when administered intravenously, is a significantly increased chance of thrombosis. Thus, their use is limited to such severe conditions as the hemorrhagic syndrome, complicated abortion, surgery on vascular-rich organs.25 In this article, for the first time, we propose an approach for creating a nanoformulated form of ε-aminocaproic acid with the possibility of its local control with a magnetic field based on protein nanocontainers with incorporated magnetite nanoparticles (MNPs) suitable for intravenous administration. In contrast with previously reported magnetite nanocontainers, this approach allows achieving a prolonged action based on the slow degradation of nanocontainers at a specific place without affecting other organs.26 The efficacy of EACA-loaded BSA NCs was assessed on fibrin clots, and magneto targeting was estimated in the flow system.
Materials and methods
Chemicals
Bovine serum albumin (cat. No A7030) (Sigma, USA), iron (II) chloride (Sigma, USA), iron (III) chloride (Sigma, USA), ammonia (SigmaTech, Russia), methanol (Fisher Chemical, UK), imidazole (Acros Organic, Germany), polyethylene glycol (PEG) Mw=8 kDa (Promega, USA), sodium chloride (DIA-M, Russia), rhodamine B (Lenreactiv, Russia), ε-aminocaproic acid (MOSFARM, Russia), urokinase (Medak GmbH, Germany), Ringer’s solution (Sigma, USA), thrombin (Technologia standart, Russia), platelet-free plasma (PFP), DMEM cell culture media (Biolot, Russia), fetal bovine serum (Biolot, Russia), gentamicin (Biolot, Russia), phosphate buffered saline (PBS) (DIA-M, Russia), 3-(4,5-dimethylthiazol-2-yl)-2,5-diphenyltetrazolium (MTT) (Sigma, USA), DMSO (Vekton, Russia).
Synthesis of MNPs
Stable magnetite hydrosol was synthesized as described.27,28 2.5 g of FeCl2 × 4H2O and 5 g of FeC3 × 6H2O were dissolved in 100 mL of deionized water under constant stirring (500 rpm, room temperature). Further, 11 mL of an aqueous ammonia solution was added under constant stirring. A precipitate was collected using a magnet and washed with deionized water to neutral pH. The washed black precipitate was mixed with 100 mL of deionized water and ultrasonicated (37 kHz, 110 W) by constant stirring at 300 rpm for 2 hrs. The resulting stable magnetite hydrosol was cooled down to room temperature and concentrated to 2% wt.
Synthesis of BSA NCs
BSA NCs were synthesized by a new method based on the desolvation procedure. All steps were performed under constant stirring (400 rpm) and at room temperature. 80 mg of BSA was dissolved in 2 mL EACA water solution (50 mg/mL), containing 0.15 M NaCl. pH was further adjusted to 10 with 1 M NaOH solution. The solution was allowed to incubate for 10 min following by addition of 1 mL MNPs solution. The mixture was incubated for 10 min. Subsequently, 163 µL of 4 M NaCl and 167 µL of 6.76 M imidazole was added to the solution and left for 10 min. Further, 100 µL of 10 mg/mL PEG (8 kDa molecular weight) was added to the mixture and left for 10 min to allow interaction with BSA. Desolvation was performed by drop-by-drop addition of 3 mL of 100% methanol using a syringe pump at a constant rate of 40 mL/hour. Formation of BSA nanoparticles was observed by increased turbidity of the solution. The mixture was allowed to incubate for 4 h at constant stirring. Centrifugation was performed at 2000 g for 5 min two times, and the last centrifugation was performed for 10 min. NCs were redispersed in water in the initial volume and stored at 4°C. For release measurement, BSA was dissolved in Rhodamine B water solution (0.005 wt%). BSA NCs without MNPs for the hemostatic experiment were synthesized using 1 mL of distilled water instead of 1 mL of MNPs solution.
Characterization methods
Nanoparticles size was measured using the dynamic light scattering method (DLS) on Photocor Compact Z with the following parameters: angle 90°, laser power 12 mV. SEM images were acquired on Tescan VEGA 3 scanning electron microscope with SE detector at 10 kV high voltage, sample angle 20°; samples were coated with Au-Pd film on SC7620 Mini Sputter Coater (Quorum Technologies, UK) for 90 sec at 18 mA. The circularity of NCs was calculated based on SEM images as a mean value of width to length ratio of each nanocontainer. The size of NCs based on SEM images was calculated manually using VegaTC software. The structure and microstructure of NCs were examined by the high-resolution transmission electron microscopy (HRTEM) on JEM-2010 electron microscope (JEOL, Japan) at an accelerating voltage of 200 kV and point-to-point resolution of 0.14 nm. The crystalline phase and crystallinity of samples were determined by the X-ray diffraction on Rigaku SmartLab 3 diffractometer (Rigaku, Japan) with CuKβ filter, 30 kV, 30 mA and a scan speed of 5 deg/min. FTIR spectra were measured using Shimadzu IRTracer-100 spectrometer (Shimadzu, Japan) with reading step 0.02 cm−1/sec in transmittance mode. For XRD and FTIR analysis, samples were dried for 2 days at 40°C and powdered with an agate mortar. Both XRD and FTIR data presented in Supporting information (Figures S2 and S3). The magnetization of MNPs and BSA NCs was measured on Lake Shore 7410 vibration magnetometer. For the measurement of release kinetics, freshly prepared NCs were dissolved in Ringer’s solution, diluted in separate tubes and left at room temperature. To separate released rhodamine B from nanocontainers, tubes were centrifugated at 12,000 g for 10 mins, and the supernatant solution was measured on Agilent Cary 60 UV-Vis Spectrophotometer (Agilent, USA) on wavelength 556 nm in 1 cm polystyrene cuvette.
Cytotoxicity studies
Cytotoxicity of BSA NCs was assessed using the MTT assay. IMR-32 human neuroblastoma cells (purchased from ATCC via Blokhin National Medical Center of Oncology, Moscow) were grown on 96-well culture plate for 24 hrs to 70% confluence. NCs after the third centrifugation were redispersed in DMEM cell culture media containing 10% fetal bovine serum and 100 µL gentamicin (10 mg/mL) to a final concentration 16 mg BSA/mL. NCs were added to cells in the two-fold dilution in range 16 mg BSA/mL–15 µg BSA/mL, each well was repeated 8 times, untreated cells were used as a negative control. The cells were incubated with NCs for 24 hrs, and culture media was discarded, the cells were washed thrice with 100 mM PBS solution, and 100 µL of MTT solution (0.5 mg/mL in PBS) was added to each well and left to incubate for 1 hr at 37°C. MTT solution was discarded, and 200 µL of DMSO was added to each well for 15 min at 37°C. Absorbance was measured on Tecan Infinite F50 spectrophotometer at 570 nm wavelength. Optical density (metabolic activity) of control cells was taken as 100%, mean values and the standard deviation was calculated for each concentration of NCs. For BSA NCs supernatant cytotoxicity examination, 1 mL of BSA NCs was centrifugated at 14,000 g for 30 min, and 20 µL of supernatant was added to 180 µL of culture media in the well.
Clot formation and lysis curve analysis
Clot formation and lysis (CloFAL) curve was analyzed to assess the ability of BSA NCs to inhibit the clot dissolution. 50 µL of PFP was mixed with 1 µL of EACA (concentrations 50 mg/mL and 1 mg/mL) or 1 µL of BSA NCs supernatant (obtained after centrifugation of NCs solution at 14000 g for 30 min). Subsequently, 25 µL of urokinase solution (37,500 IU/mL) was added to the mixture. The clot was formed by the addition of 50 µL of thrombin (50 IU/mL), and kinetics of optical density was immediately measured on UV-1800 spectrophotometer (Shimadzu, Japan) on 340 nm. The CloFAL curve was analyzed using ImageJ software (NIH, USA).
Hemostatic experiment in static conditions
To assess the efficacy of EACA-loaded BSA NCs as a magnetically controlled hemostatic agent, the following experimental scheme was developed. Fibrin clots were obtained in the 45 mm polystyrene Petri dish with 8 mm inner well by mixing 200 µL of thrombin (50 IU/mL) with 200 µL of PFP. Clot formation completed within 1 min. A small round (d=5 mm, h=2 mm) neodymium magnet was placed under the dish and clot. 0.5 mL of freshly prepared NCs with and without MNPs was dissolved in 8 mL of Ringer’s solution and added on the top of the clot. The whole Petri dish was placed on an orbital shaker at 200 rpm for 5 mins. After this, the clot was removed and placed on a glass slide. Fibrin clots treated with buffer was used as a control. 100 µL of urokinase (37,500 IU/mL) was added on the top of clots, the slide was covered with a cap to prevent evaporation, and left for 60 mins at room temperature. Images of clots were taken every 5 mins, and the kinetics of clot size changes was measured.
Hemostatic experiment in flow conditions
The flow setup consisted of a syringe pump, and a silicone tube system was constructed to estimate the ability for magneto targeting of EACA-loaded BSA NCs in vitro (Figure 7A). The diameter of the silicone tubes was 4 mm, wall - 1 mm thick. The glass tube with a porous polyurethane filter to hold a fibrin clot was inserted in the central part of the contour under the microscope view field. Fibrin clot was formed by mixing 200 µL of thrombin (50 IU/mL) with 200 µL of PFP and placed inside the glass tube upstream the filter. Then, a neodymium magnet (d=10 mm, h=10 mm, magnetic flux density 1500 Gs, or 0.15 T) was placed on the top of the tube 1 cm behind the clot. 2 mL of freshly prepared NCs was dissolved in 48 ml of Ringer’s solution and pumped through a tube at a rate of 300 mL/hour. Accumulation of NCs was captured in video mode using 8 mpx CCD camera.
Results and discussion
Synthesis of BSA NCs
Synthesis of nanoparticles is schematically shown in Figure 1. The principal idea was to create nanocontainers with only biocompatible components which can act as a local depot for slow drug release. For preliminary experiments, we choose BSA as a close analog to human serum albumin. BSA NCs were prepared by the procedure involving the desolvation method with significant adjustments, which enabled to reduce the particle size. Common desolvation process allows obtaining quite big (typically, 200–400 nm) and polydisperse nanoparticles which are highly stable in biological media due to crosslinking step during synthesis.29 This can be beneficial for a long-term release of drug agents but for the drawbacks connected with big sizes and glutaraldehyde crosslinker in composition. We have used a different desolvating agent – methanol – which makes it possible to produce smaller nanoparticles.9 The addition of imidazole during the synthesis also contributes to the reduction of particle sizes.6 One of the crucial parameters affecting the particle’s size is the ionic strength of the solution, which was adjusted by NaCl to a final concentration of 300 mM. To allow magnetic control of the protein nanoparticles, we used magnetite nanoparticles previously successfully implemented to the synthesis of magneto-targeted thrombolytics.26,27,30 After desolvation, protein nanoparticles are usually stabilized by the glutaraldehyde crosslinking. This method leads to the aggregation of particles into larger complexes. They are not suitable for the intravenous delivery method, since the filtering capabilities of the spleen strongly limit the size of nanoparticles, and more important – the crosslinking process is irreversible.10 Glutaraldehyde also exhibits toxicity to cells in low concentrations. Irreversible crosslinking is undesirable for our purposes as EACA should release from NCs, so it was decided to make less stable nanoparticles. According to our assumption, such structures should slowly degrade at the target site under the influence of proteases and mechanical influence, but also have the ability to circulate in the bloodstream. Different surfactants and polyelectrolytes are well known for their ability to affect the growth speed, shape, and stability of nanoparticles. Among many of them, we chose PEG as a common agent for preparing highly biocompatible nanostructures.31 Pegylation of nanoparticles is a well-known procedure that allows to obtain stable colloids, as well as to increase the circulation time of nanoparticles in the body.31 To ensure the maximum efficacy of coating, we took PEG with molecular weight 8000 Da since it has the highest affinity to albumin.32 During the formation of protein NCs, magnetite nanoparticles in solution are captured inside larger particles which provide magnetically controlled protein NCs. This synthesis approach allows achieving a moderate balance between size, stability, and easiness of NCs synthesis. Full synthesis procedure takes around 6 hrs, including 3 cycles of centrifugation and filtration, and the most time-consuming part is simple incubation. Centrifugation is needed to discard all traces of methanol, but filtration is an optional step which helps to obtain a narrower distribution of NCs, although causing a severe loss (around 20–30%) of NCs (see Size distribution and structural study section).
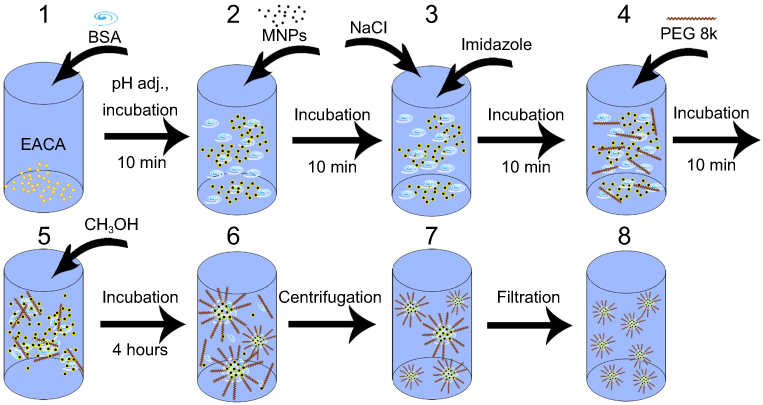 |
Figure 1 Scheme of the EACA-loaded BSA NCs synthesis.Notes: On the first step, BSA is dissolved in a water solution of EACA. Then MNPs introduced into the solution and allowed to incubate. NaCl and imidazole added to mixture following by addition of 8 kDa PEG. Desolvation procedure with methanol is continuing until the solution becomes cloudy turbid. Complete formation of particles takes around 2–4 hrs. Three stages of centrifugation and redispersion in water were performed to eliminate any traces of methanol. On the last step, nanoparticles mixture filtered through 0.45 µm MCE membrane and then stored at 4°C.Abbreviations: EACA, ε-aminocaproic acid; BSA, bovine serum albumin; NCs, nanoclusters; MNPs, magnetite nanoparticles; PEG, polyethylene glycol; MCE, mixed cellulose ester. |
Size distribution and structural study
The size distribution of NCs was measured by the dynamic light scattering and presented in Figure 2A. Such a narrow distribution with an average hydrodynamic diameter of NCs 186±24 nm was achieved after filtration through a 0.45 µm MCE filter. SEM image of filtered NCs presented in Figure 2A, Inset (II), the mean size of NCs was calculated as 113±37 nm. As mentioned above, freshly NCs have a moderate polydispersity (Figure 2B inset). Both scanning and transmission electron microscopy observations were performed to observe the structure of synthesized NCs. Figure 2B presents the SEM image of unfiltered freshly prepared NCs. We observed a moderate aggregation of NCs and about 20% of NCs bigger than 200 nm in diameter (Figure 2B inset). The shape of NCs is close to an ellipsoid with the circularity of 1.12. However, it is impossible to observe the inner structure of NCs via SEM. For this purpose, the high-resolution transmission electron microscopy (HRTEM) observations were performed. Figure 2C and D show individual BSA NCs with internal structure. As seen, the whole structure of a single nanocontainer consists of smaller BSA nanoparticles with an average diameter around 10–15 nm (Figure 2E). In the HRTEM images, the shape of NCs is even more close to ellipsoid. A narrow shell around NCs was observed, which we suggest can be a PEG layer (Figure 2D, inset (brightness of the image on the inset was adjusted to enhance visibility)). PEG shell was further detected around small nanoparticles (Figure 2E, pointed by the arrow) with the average size of shell 5–10 nm, which is in perfect agreement with literature data about the size of 8 kDa PEG molecules.33 MNPs nanoparticles were observed inside BSA NCs, and the crystalline lattice pattern typical for magnetite structure is presented in Figure 2F. Stability of NCs was assessed during storage in an aqueous solution, the DLS was measured after 48 hrs which and gave the average hydrodynamic radius of 14 nm±5 (Figure 2A, Inset (I)). This corresponds to the size of MNPs and single BSA nanoparticles, which means that NCs are fully destructed after 2 days in solution.
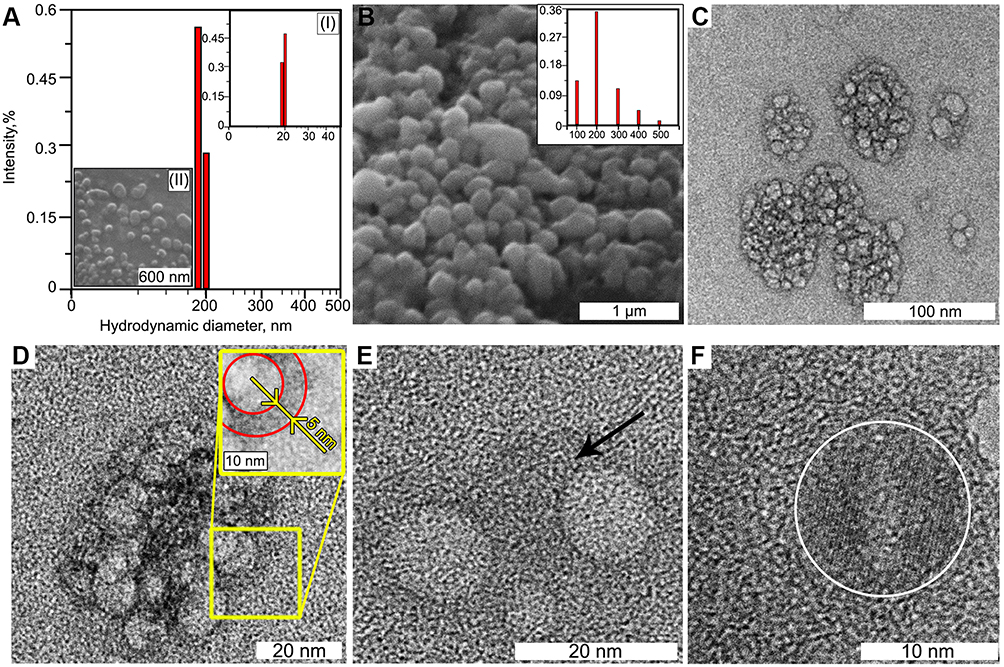 |
Figure 2 (A) Hydrodynamic diameter of EACA-loaded BSA NCs after filtration through 0.45 µm MCE membrane, the average diameter is 186±24 nm, no MNPs peak (typically around 20 nm) observed which prove the incorporation of MNPs inside BSA NCs. On inset (I): hydrodynamic radius after 2 days of storage, only MNPs and BSA nanoparticles peak is present, which indicates total destruction of NCs. On inset (II): SEM image of filtered BSA NCs. (B) SEM image of as-prepared EACA-loaded BSA NCs before filtration, a small amount of aggregated NCs observed. On inset: size distribution of freshly prepared unfiltered NCs (diameter in nm). (C) The HRTEM image of BSA NCs consisted of smaller structural building blocks. (D) The enlarged HRTEM image of BSA NC. On inset: the enlarged fragment of BSA NC with supposed PEG layer showed by red circles. (E) The enlarged HRTEM image of a BSA nanoparticle structural block. (F) The HRTEM image of MNPs (encircled) inside nanocontainer.Abbreviations: EACA, ε-aminocaproic acid; BSA, bovine serum albumin; NCs, nanoclusters; MNPs, magnetite nanoparticles; PEG, polyethylene glycol; MCE, mixed cellulose ester; HRTEM, high-resolution transmission electron microscopy; SEM, scanning electron microscopy. |
Release kinetics
To estimate the NCs ability for uptake and prolonged release of drugs, we take a rhodamine B as a model molecule of a small drug (Mw=479 g/mol). Rhodamine B was added to the BSA solution before the initiation of nucleation. Upon desolvation step and further formation of NCs, rhodamine B molecules are captured both inside structural blocks and in pores between them. We suggest that such a double-type incorporation provides a two-phase release: fast from pores, after decomposition of NCs, and slow from structural building blocks. The overall uptake capacity was estimated as 36.4% from an initial concentration of rhodamine B. The release kinetics can be seen in Figure 3. Within the first hour in Ringer’s solution, we observed the release of the 5% of the initial load of rhodamine B. During the next 24 hrs, about 15% of the initial load was released. After 48 hrs, about 17% of the rhodamine B released from the NCs. Comparing the data obtained by DLS and release study, the rest of rhodamine B seems to be entrapped inside small BSA nanoparticles and need more time for release. However, we expect that inside the body BSA nanoparticles are likely to undergo dissolution caused by various proteases which will increase release considerably.
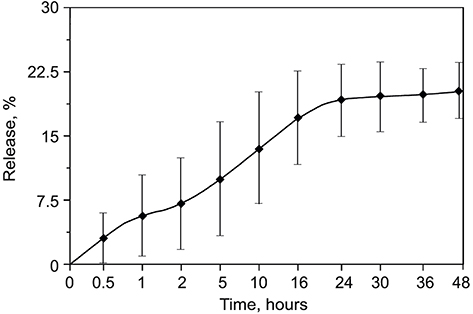 |
Figure 3 The release profile of rhodamine B from BSA NCs. About 5% of the initial load released within the first hour. Almost constant release rate remains for 24 hrs, and during the next 24 hrs, no additional rhodamine B was released. Mean values are presented with standard deviation.Abbreviations: BSA, bovine serum albumin; NCs, nanoclusters. |
Cytotoxicity examination
Cytotoxicity of BSA NCs was assessed using a standard test for metabolic activity – the MTT assay. Possible toxicity of NCs can be connected mainly with methanol, but also with oxidative stress caused by MNPs. Possible toxic action can come from the high concentration of BSA or PEG as well. We tested NCs in a wide range of concentration, starting from 16 mg BSA/mL (as-prepared solution) to 15 µg BSA/mL. The results are presented in Figure 4. We observed no cytotoxicity at all concentrations except the highest one (16 mg BSA/mL). We suppose that cytotoxicity in the first well is mainly connected with a significant dilution of culture media with NCs (1:1). Need to note, that the whole range of concentrations is much higher than usually tested on cells (typically maximum concentration limited to hundreds of µg/mL), and the absence of cytotoxicity can prove our NCs to be non-cytotoxic. The shape and percent of adherent cells were also examined, and there was no significant difference between control and treated cells (data not shown).
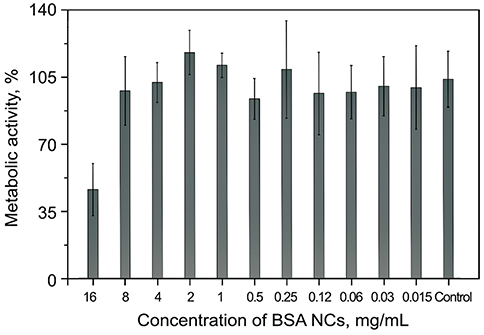 |
Figure 4 Metabolic activity according to the MTT assay of IMR-32 cells after incubation with different concentration of BSA NCs for 24 hrs. Mean values with standard deviation are represented. Control value was set as 100% of metabolic activity. No cytotoxicity was observed in the whole range of concentrations except the 16 mg BSA/mL. Also, no cytotoxicity was observed for BSA NCs supernatant in concentration 10% vt.Abbreviations: EACA, ε-aminocaproic acid; BSA, bovine serum albumin; NCs, nanoclusters; MTT, 3-(4,5-dimethylthiazol-2-yl)-2,5-diphenyltetrazolium bromide. |
Clot formation and lysis (CloFAL) curve analysis
The CloFAL curve allows analyzing the number of significant coagulation parameters, such as fibrinolytic index (FI) and coagulation index (CI).34 Example of the CloFAL curve presented in Figure S1. Upon addition of thrombin at time T0, fibrinogen starts converting to fibrin, forming a clot, and optical density of a sample increasing to the point of maximum absorbance MA at time T1. Depending on inhibitors and thrombolytics concentrations, CloFAL curve may have a flat plateau, which means that the clot remains intact. The clot lysis under urokinase action starts throughout the whole volume of the clot when the concentration of plasmin become enough for fibrin cleavage. The first, fast phase of clot dissolution ends at time T2. Considering these, FI and CI can be calculated as follows:
(1) (2)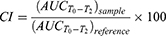
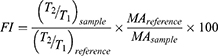
Where AUC – area under CloFAL curve. T0, T1, T2, and MA were obtained from the absorbance data, and AUC was calculated using ImageJ software. CloFAL curves shown in Figure 5 and the results of the indexes calculation are presented in Table 1. Upon addition of thrombin, clot formation occurred within 10 seconds regardless of EACA concentration. As seen from Figure 5 (blue line), the addition of 1 µL EACA (50 mg/mL) totally inhibits plasminogen, which results in complete inhibition of fibrinolysis (flat plateau). 1 µL of EACA (1 mg/mL) increase T2 time almost twice in comparison with the reference values (1 µL of PBS was added instead of EACA). NCs increases T2 time by 1.5 times, which is 20% lower than 1 mg/mL EACA, and CI and FI for NCs also 20% lower in comparison with 1 mg/mL EACA. However, this is in complete agreement with release studies. Considering uptake capacity and estimated release, the concentration of EACA in BSA NCs solution should be around 0.8–1.0 mg/mL after 24 hrs. It should be noted that the therapeutic concentration of EACA in the blood is about 1 mg/mL, which is much higher than needed for total inhibition. We diluted EACA or NCs 125 times, and the highest concentration of EACA was 0.4 mg/mL. However, this was enough to inhibit fibrinolysis totally. It is clearly seen that the addition of EACA in any form increases T1 time by 30%, providing a longer time of clot existence.
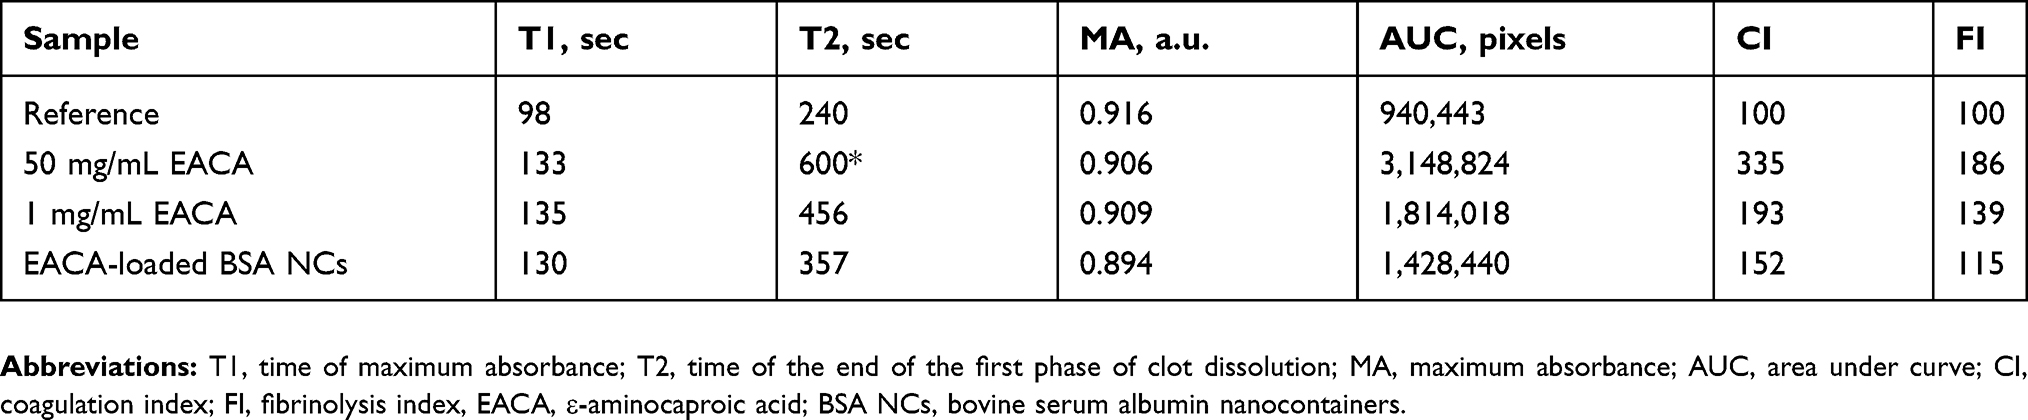 |
Table 1 CloFAL curve parameters for reference and test clot samples |
 |
Figure 5 CloFAL curves of reference clot (yellow, no inhibitors were added), with the addition of 1 µL of EACA-loaded BSA NCs supernatant (green), with the addition of 1 µL of 1 mg/mL EACA (red), and with the addition of 1 µL of 50 mg/mL EACA (blue).Abbreviations: EACA, ε-aminocaproic acid; BSA, bovine serum albumin; NCs, nanoclusters; CloFAL, clot lysis and formation. |
In vitro efficacy in a static condition
In vitro measurement of hemostatic activity was performed with freshly prepared and filtered NCs with and without MNPs. The experiment in static condition was conducted using freshly prepared fibrin clots from PFP that was placed in Petri dish with 3 mm height and 8 mm width well in the center of the dish (Figure 6A). 8 mL of NCs in Ringer’s solution was poured onto the clot. To estimate the efficacy of magneto targeting, a small neodymium magnet was placed under the clot, and incubation proceeded for 5 min. We observed a steady accumulation of NCs with MNPs around the clot already after 3 min (Figure 6B), and after 5 min clot was entirely covered with NCs (Figure 6C). Treated and control untreated clots were removed from NCs solution, placed on a cover glass, and 100 µL of urokinase solution was poured on them. In Figure 6D–H it is clearly seen, that the untreated clot rapidly destroyed by activated plasmin while the treated one undergoes some minor contraction but almost remains intact. The dynamics of the clots dissolution is presented in Figure 6I. After 60 min of incubation, the untreated clot is almost entirely destroyed (surface decreased by 96%). The size of clots treated with NCs without MNPs statistically insignificant differs from control clots, while the treated one reduces by 60% after one hour. We suggest that MNPs plays not only a targeted modality role but also have a crucial impact on the uptake capacity of EACA. EACA has amino and carboxyl group which can bind to the surface of magnetite. Further accumulation of MNPs in NCs leads to increased loading efficacy.
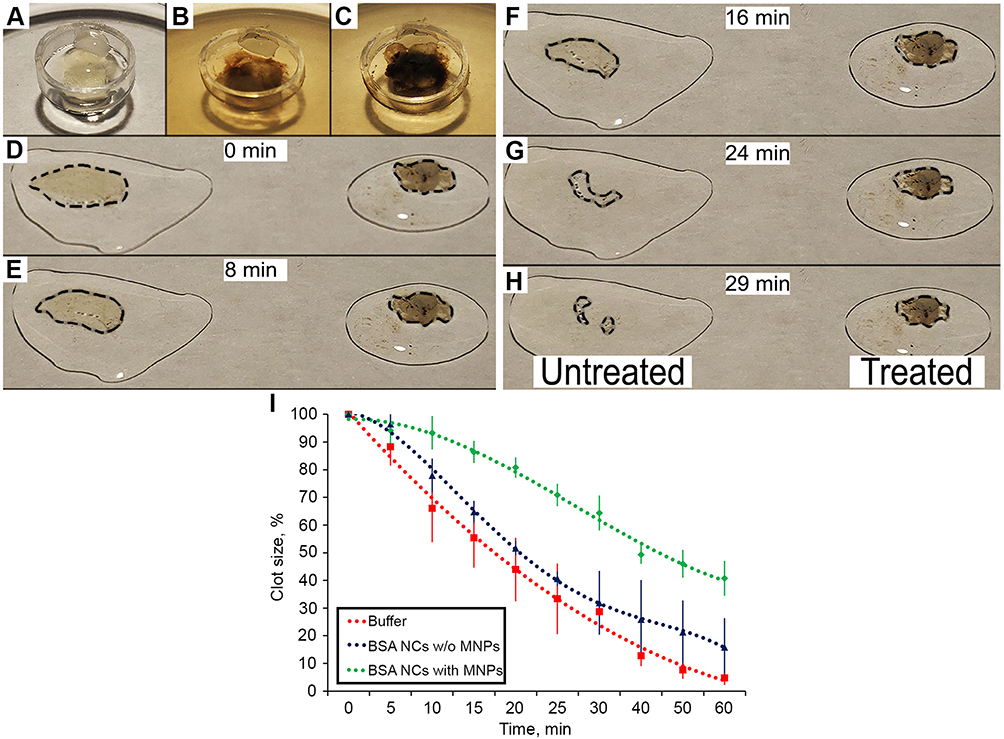 |
Figure 6 (A-C) Accumulation of EACA-loaded BSA NCs on the clot under the magnetic field. (A) 0 min (start of the experiment), (B) after 3 min, (C) after 5 min. (D-H) In vitro comparison of the fibrinolysis process of non-treated fibrin clots and treated with NCs (clots encircled by a dashed line). (D) 0 min (start of the experiment), (E) 8 min, (F) 16 min, (G) 24 min, (H) 29 min. (I) Lysis kinetics of clots treated with buffer (control), BSA NCs without MNPs, and BSA NCs with MNPs. Mean values of n=3 experiments presented, vertical bars are standard deviation, dot lines are polynomial approximation (second order).Abbreviations: EACA, ε-aminocaproic acid; BSA, bovine serum albumin; NCs, nanoclusters. |
Efficacy of magneto targeting in a flow system
The ability for magneto control of NCs was assessed under flow condition via the simple setup presented in Figure 7A. Two contour system was implemented to reduce the pressure in the system after the formation of a clot. Center glass part of the first contour was placed on a microscope table, a fibrin clot was placed inside and fixed by a polyurethane filter (Figure 7B). Neodymium magnet was placed slightly behind the clot, on the top of the glass tube. Freshly prepared NCs were diluted 25 times in Ringer’s solution and pumped through the system at a rate of 300 mL/hour. The results obtained are presented in Figure 7B–D. We observed fast accumulation (within 5 min) of NCs in the area approximately 0.4 mm in front of the magnet (Figure 7C). After 15 min noticeable darkening of the whole clot with a characteristic brown color was detected, which proves the accumulation of NCs around or even inside the clot (Figure 7D). Despite the fact that magnet has a diameter and height of only 10 mm (magnetic flux density was around 0.15T), it was shown that BSA NCs are highly susceptible to the magnetic field. Mostly this is due to the fact that original magnetite nanoparticles have high magnetization values up to 80 e.m.u./g (Figure S4). Upon the formation of BSA NCs, magnetization values decreasing by 8–10 times; however, it is still enough to target NCs inside flow system. Easiness of magneto targeting can also be explained by the fact that single BSA NC combined hundreds of MNPs thus overall magnetic susceptibility of BSA NC must be much higher in comparison with pure single MNP. The important note needs to be given here considering magneto targeting of NCs inside the human body. Currently, there are no approved medical devices for magneto targeting of nanoparticles at the desired site. However, we suggest that such a device is not really necessary. When addressing the issue of targeting some drug at the desired place, it is already profitable to increase the concentration of a therapeutic substance in the vicinity of the required site. We believe that powerful permanent magnets can be used for this purpose on initial stages of magnetically-guided drugs therapy.
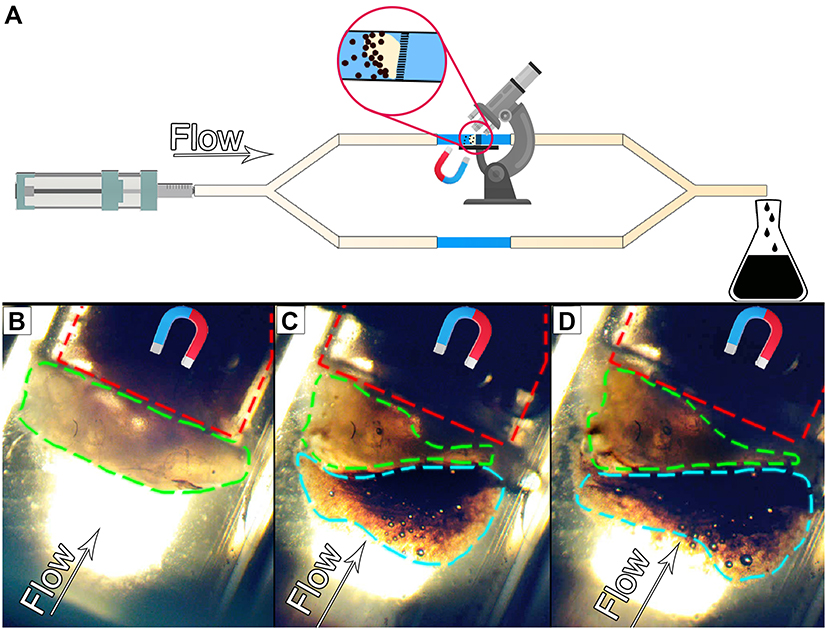 |
Figure 7 (A) Scheme of the flow setup. Syringe pump connected to two contour system made of silicone tubes. Center part of the first contour made from glass and placed on the microscope table. Fibrin clot placed inside this tube and hold in place by the filter. The enlarged fragment shows accumulation of NCs around the clot. (B-D) Images of accumulation of EACA-loaded BSA NCs around the fibrin clot in the flow system. Holding filter marked with red dash line, clot with a green dash line, NCs with a light blue dash line. The direction of flow marked with an arrow. The magnet position is shown schematically. (B) On the initial stage, the clot is pale yellow and clearly seen. (C) NCs start to accumulate after 5 min; the color of the clot become more brownish. (D) NCs accumulated mainly in front of the magnet and clot after 15 min, and clot became even more darker brownish.Abbreviations: EACA, ε-aminocaproic acid; BSA, bovine serum albumin; NCs, nanoclusters. |
Conclusions
In the current article, we have presented the simple approach to obtain magnetically controlled protein nanocontainers capable of delivering a small molecule drug (hemostatic agent) at the desired site. The approach utilized is easy to reproduce and has a number of advantages over single protein nanoparticles or just magnetite nanoparticles. The synthesis procedure is rather different from the commonly used desolvation method but allows to obtain narrower distributed nanoparticles with smaller sizes. Moreover, all components of NCs are biocompatible, and BSA can be further replaced with other proteins to achieve enhanced compatibility or specificity. Aggregation stability of nanocontainers in aqueous media is very high due to PEG coating, but overall structural integrity remains no longer than 2 days, which is good for short-term release. We have shown that NCs could be easily accumulated at the desired site via the magnetic field within 15 min after administration. Analyzing CloFAL curves, we have estimated that NCs possess the ability to inhibit clot lysis, thereby proving its potential as a hemostatic agent. Such a delivery system can be further utilized to provide a targeted approach for other small molecule substances.
Acknowledgments
The work of Prilepskii A and Schekina A on the synthesis of BSA NCs was supported by Russian Science Foundation Grant 18-73-00119, the work of Vinogradov V on thrombolysis experiments was supported by Russian Science Foundation Grant 16-13-00041. The X-ray powder diffraction studies and IR spectroscopy were performed on Rigaku SmartLab 3 diffractometer and Shimadzu IRTracer-100 spectrometer of the engineering center of the Saint-Petersburg State Technological Institute (Technical University).
Disclosure
The authors report no conflicts of interest in this work.
References
1. Elzoghby AO, Samy WM, Elgindy NA. Albumin-based nanoparticles as potential controlled release drug delivery systems. J Control Release. 2012;157(2):168–182. doi:10.1016/j.jconrel.2011.07.031
2. Sponton OE, Perez AA, Carrara CR, Santiago LG. Linoleic acid binding properties of ovalbumin nanoparticles. Colloids Surf B Biointerfaces. 2015;128:219–226. doi:10.1016/j.colsurfb.2015.01.037
3. Jun JY, Nguyen HH, Chun HS, Kang BC, Ko S. Preparation of size-controlled bovine serum albumin (BSA) nanoparticles by a modified desolvation method. Food Chem. 2011;127(4):1892–1898. doi:10.1016/j.foodchem.2011.02.040
4. Langer K, Balthasar S, Vogel V, Dinauer N, Von Briesen H, Schubert D. Optimization of the preparation process for human serum albumin (HSA) nanoparticles. Int J Pharm. 2003;257(1–2):169–180.
5. Zhong Q, Minfeng J. Zein nanoparticles produced by liquid–liquid dispersion. Food Hydrocoll. 2009;23(8):2380–2387. doi:10.1016/j.foodhyd.2009.06.015
6. Estrada LH, Chu S, Champion JA. Protein nanoparticles for intracellular delivery of therapeutic enzymes. J Pharm Sci. 2014;103(6):1863–1871. doi:10.1002/jps.23974
7. Gendler E, Gendler S, Nimni ME. Toxic reactions evoked by glutaraldehyde‐fixed pericardium and cardiac valve tissue bioprosthesis. J Biomed Mater Res. 1984;18(7):727–736. doi:10.1002/jbm.820180703
8. Dreis S, Rothweiler F, Michaelis M, JJr C, Kreuter J, Langer K. Preparation, characterisation and maintenance of drug efficacy of doxorubicin-loaded human serum albumin (HSA) nanoparticles. Int J Pharm. 2007;341(1–2):207–214. doi:10.1016/j.ijpharm.2007.03.036
9. Von Storp B, Engel A, Boeker A, Ploeger M, Langer K. Albumin nanoparticles with predictable size by desolvation procedure. J Microencapsul. 2012;29(2):138–146. doi:10.3109/02652048.2011.635218
10. Champion JA, Katare YK, Mitragotri S. Particle shape: a new design parameter for micro-and nanoscale drug delivery carriers. J Control Release. 2007;121(1–2):3–9. doi:10.1016/j.jconrel.2007.03.022
11. Taheri A, Dinarvand R, Atyabi F, et al. Enhanced anti-tumoral activity of methotrexate-human serum albumin conjugated nanoparticles by targeting with luteinizing hormone-releasing hormone (LHRH) peptide. Int J Mol Sci. 2011;12(7):4591–4608. doi:10.3390/ijms12074591
12. Zhang S, Wang G, Lin X, et al. Polyethylenimine‐coated albumin nanoparticles for BMP‐2 delivery. Biotechnol Prog. 2008;24(4):945–956. doi:10.1002/btpr.12
13. Han Y, Shchukin D, Yang J, Simon CR, Fuchs H, Möhwald H. Biocompatible protein nanocontainers for controlled drugs release. ACS Nano. 2010;4(5):2838–2844. doi:10.1021/nn100307j
14. Piradashvili K, Fichter M, Mohr K, Gehring S, Wurm FR, Landfester K. Biodegradable protein nanocontainers. Biomacromolecules. 2015;16(3):815–821. doi:10.1021/bm5016915
15. Ferraris VA, Brown JR, Despotis GJ. Update to the society of thoracic surgeons and the society of cardiovascular anesthesiologists blood conservation clinical practice guidelines. Ann Thorac Surg. 2011;91(3):944–982. doi:10.1016/j.athoracsur.2010.11.078
16. Björses K, Holst J. Various local hemostatic agents with different modes of action; an in vivo comparative randomized vascular surgical experimental study. Eur J Vasc Endovasc Surg. 2007;33(3):363–370. doi:10.1016/j.ejvs.2006.10.011
17. Alpaslan C, Alpaslan GH, Oygur T. Tissue reaction to three subcutaneously implanted local hemostatic agents. Br J Oral Maxillofac Surg. 1997;35(2):129–132.
18. Petersen JK, Krogsgaard J, Nielsen KM, Nørgaard EB. A comparison between 2 absorbable hemostatic agents: gelatin sponge (Spongostan®) and oxidized regenerated cellulose (Surgicel®). Int J Oral Surg. 1984;13(5):406–410.
19. Romanò CL, Monti L, Logoluso N, Romanò D, Drago L. Does a thrombin-based topical hemostatic agent reduce blood loss and transfusion requirements after total knee revision surgery? A randomized, controlled trial. Knee Surg Sports Traumatol Arthrosc. 2015;23(11):3337–3342. doi:10.1007/s00167-014-3153-8
20. Marano L, Di Martino N. Efficacy of human fibrinogen-thrombin patch (TachoSil) clinical application in upper gastrointestinal cancer surgery. J Invest Surg. 2016;29(6):352–358. doi:10.1080/08941939.2016.1181229
21. Huang F, Wu D, Ma G, Yin Z, Wang Q. The use of tranexamic acid to reduce blood loss and transfusion in major orthopedic surgery: a meta-analysis. J Surg Res. 2014;186(1):318–327. doi:10.1016/j.jss.2013.08.020
22. Peters A, Verma K, Slobodyanyuk K, et al. Antifibrinolytics reduce blood loss in adult spinal deformity surgery: a prospective, randomized controlled trial. Spine. 2015;40(8):443–449. doi:10.1097/BRS.0000000000000785
23. Alkjaersig N, Fletcher AP, Sherry S. E-aminocaproic acid: an inhibitor of plasminogen activation. J Biol Chem. 1959;234:832–837.
24. Ipema HJ, Tanzi MG. Use of topical tranexamic acid or aminocaproic acid to prevent bleeding after major surgical procedures. Ann Pharmacother. 2012;46(1):97–107. doi:10.1345/aph.1Q383
25. Tengborn L, Blombäck M, Berntorp E. Tranexamic acid–an old drug still going strong and making a revival. Thromb Res. 2015;135(2):231–242. doi:10.1016/j.thromres.2014.11.012
26. Anastasova EI, Prilepskii AY, Fakhardo AF, Drozdov AS, Vinogradov VV. Magnetite nanocontainers: toward injectable highly magnetic materials for targeted drug delivery. ACS Appl Mater Interfaces. 2018;10(36):30040–30044. doi:10.1021/acsami.8b10129
27. Drozdov AS, Vinogradov VV, Dudanov IP, Vinogradov VV. Leach-proof magnetic thrombolytic nanoparticles and coatings of enhanced activity. Sci Rep. 2016;6:28119. doi:10.1038/srep28119
28. Drozdov AS, Vinogradov VV. Magnetic thrombolytic ceramic nanoparticles. Mater Today Proc. 2017;4(7):6856–6862. doi:10.1016/j.matpr.2017.07.014
29. Weber C, Coester C, Kreuter J, Langer K. Desolvation process and surface characterisation of protein nanoparticles. Int J Pharm. 2000;194(1):91–102.
30. Prilepskii AY, Fakhardo AF, Drozdov AS, et al. Urokinase-conjugated magnetite nanoparticles as a promising drug delivery system for targeted thrombolysis: synthesis and preclinical evaluation. ACS Appl Mater Interfaces. 2018;10(43):36764–36775. doi:10.1021/acsami.8b14790
31. Suk JS, Xu Q, Kim N, Hanes J, Ensign LM. PEGylation as a strategy for improving nanoparticle-based drug and gene delivery. Adv Drug Deliv Rev. 2016;99:28–51. doi:10.1016/j.addr.2015.09.012
32. Wu J, Zhao C, Lin W, et al. Binding characteristics between polyethylene glycol (PEG) and proteins in aqueous solution. J Mater Chem B. 2014;2(20):2983–2992. doi:10.1039/c4tb00253a
33. Cruje C, Chithrani DB. Polyethylene glycol density and length affects nanoparticle uptake by cancer cells. J Nanomed Res. 2014;1(1):00006.
34. Goldenberg NA, Hathaway WE, Jacobson L, Manco-Johnson MJ. A new global assay of coagulation and fibrinolysis. Thromb Res. 2005;116(4):345–356. doi:10.1016/j.thromres.2004.12.009
Supplementary materials
Clot formation and lysis curve
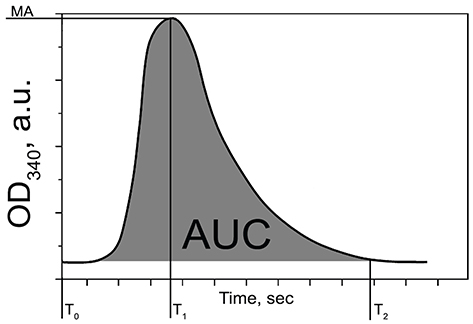 |
Figure S1 Curve of Clot Formation and Lysis (CloFAL) assay, demonstrating principal CloFAL parameters.Abbreviation: CloFAL, clot formation and lysis. |
XRD analysis
For XRD analysis nanocontainer samples with and without MNPs was dried at 40°C to prevent thermal denaturation of the protein. XRD spectra are shown in Figure S2. In the sample with MNPs, we observed a number of characteristics peaks at 2Θ: 30.1°, 35.4°, 43.2°, 53.6°, 57°, 62.6°. The strongest peak was observed for the (3 1 1) reflection at 2Θ: 35.4°. All characteristic peaks are attributed to the JCPDS file No. 19-0629 (X-ray diffraction pattern for Fe3O4 magnetic particles) and completely correspond to peaks on the spectra of pure MNPs. Small extra peaks were observed at 2Θ: 31.6°, 45.2°, which corresponds to traces of NaCl and can be clearly seen on the spectra of BSA NCs without magnetite on Figure S2. A broad peak was observed around 20°, which corresponds to the amorphous organic phase.
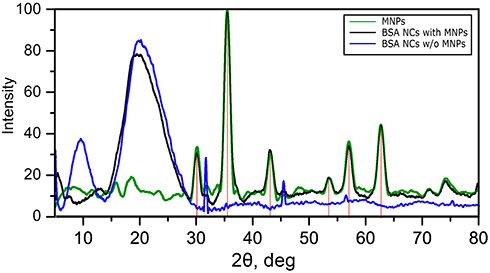 |
Figure S2 XRD spectra of pure MNPs (green line), BSA NCs with MNPs (black line), and BSA NCs without MNPs. Red lines show references to JCPDS file No. 19-0629 (XRD pattern for magnetite). Peaks attributed to NaCl traces were found in the sample of BSA NCs without MNPs.Abbreviations: XRD, X-ray diffraction; BSA, bovine serum albumin; NCs, nanoclusters; MNPs, magnetite nanoparticles; JCPDS, The Joint Committee on Powder Diffraction Standards. |
FTIR analysis
Figure S3 shows FTIR spectra of BSA NCs with MNPs (black), without MNPs (red), and pure MNPs (green) in the region between 400 and 4000 cm−1. For FTIR analysis NCs samples with and without MNPs was dried at 40°C to prevent thermal denaturation of the protein. On the IR spectra of magnetite nanoparticles, a broad peak is observed in the region of 400–700 cm−1, which is a characteristic peak of metal oxides. The IR spectra of the nanocontainer samples without MNPs reveal characteristic peaks of polypeptide absorbance. Two main absorption bands of amide I (1650 cm−1) and amide II (1510 cm−1) are observed, due to stretching C=O bonds (amide I) and stretching of the C-N bond (amide II) respectively. A clear peak at 1230 cm−1 appears due to mixed C-N stretching and N-H bending vibrations of amino acids. There is also a clear peak at about 3300 cm−1, due to stretching vibrations of the N–H bond. In the case of IR spectra of the nanocontainer samples with MNPs, the position of the peaks, characteristic of polypeptides, is preserved and no significant changes in band positions were observed due to the conjugation of NCs. These facts evidence that MNPs assembled to proteins due to the physical sorption without the formation of new chemical bonds. A peak, corresponded to magnetite in the sample, was observed at a maximum of 560 nm, as for initial (pure) magnetite.
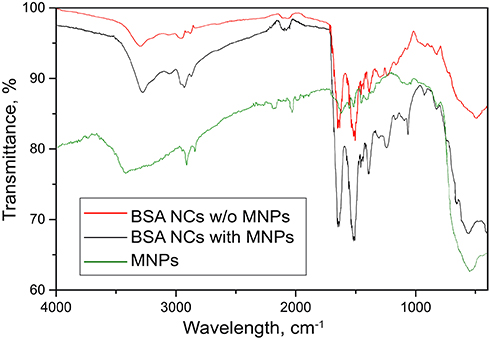 |
Figure S3 FTIR spectra of BSA NCs with MNPs (black), BSA NCs without MNPs (red), and pure MNPs (green).Abbreviations: FTIR, fourier-transform infrared spectroscopy; BSA, bovine serum albumin; NCs, nanoclusters; MNPs, magnetite nanoparticles. |
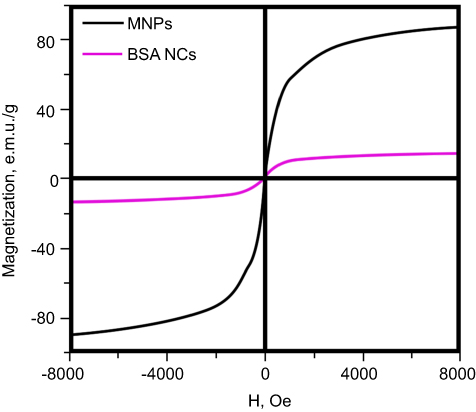 |
Figure S4 Magnetization curves of MNPs and BSA NCs.Abbreviations: MNPs, magnetite nanoparticles; BSA, bovine serum albumin; NCs, nanoclusters; MNPs, magnetite nanoparticles. |
 © 2019 The Author(s). This work is published and licensed by Dove Medical Press Limited. The
full terms of this license are available at https://www.dovepress.com/terms
and incorporate the Creative Commons Attribution
- Non Commercial (unported, 3.0) License.
By accessing the work you hereby accept the Terms. Non-commercial uses of the work are permitted
without any further permission from Dove Medical Press Limited, provided the work is properly
attributed. For permission for commercial use of this work, please see paragraphs 4.2 and 5 of our Terms.
© 2019 The Author(s). This work is published and licensed by Dove Medical Press Limited. The
full terms of this license are available at https://www.dovepress.com/terms
and incorporate the Creative Commons Attribution
- Non Commercial (unported, 3.0) License.
By accessing the work you hereby accept the Terms. Non-commercial uses of the work are permitted
without any further permission from Dove Medical Press Limited, provided the work is properly
attributed. For permission for commercial use of this work, please see paragraphs 4.2 and 5 of our Terms.