Back to Journals » International Journal of Nanomedicine » Volume 11
Magnetic micro/nanoparticle flocculation-based signal amplification for biosensing
Authors Mzava O, Tas Z, Icoz K
Received 17 March 2016
Accepted for publication 14 April 2016
Published 7 June 2016 Volume 2016:11 Pages 2619—2631
DOI https://doi.org/10.2147/IJN.S108692
Checked for plagiarism Yes
Review by Single anonymous peer review
Peer reviewer comments 2
Editor who approved publication: Dr Thomas Webster
Omary Mzava,1 Zehra Tas,1 Kutay İçöz1,2
1BioMINDS (Bio Micro/Nano Devices and Sensors) Laboratory, Department of Electrical and Electronics Engineering, 2Bioengineering Department, Abdullah Gül University, Kayseri, Turkey
Abstract: We report a time and cost efficient signal amplification method for biosensors employing magnetic particles. In this method, magnetic particles in an applied external magnetic field form magnetic dipoles, interact with each other, and accumulate along the magnetic field lines. This magnetic interaction does not need any biomolecular coating for binding and can be controlled with the strength of the applied magnetic field. The accumulation can be used to amplify the corresponding pixel area that is obtained from an image of a single magnetic particle. An application of the method to the Escherichia coli 0157:H7 bacteria samples is demonstrated in order to show the potential of the approach. A minimum of threefold to a maximum of 60-fold amplification is reached from a single bacteria cell under a magnetic field of 20 mT.
Keywords: magnetic micro/nanoparticle accumulation, signal amplification, image-based detection, magnetic dipole–dipole interaction
Introduction
Magnetic micro/nanoparticles have three important features that make them attractive for biological applications: 1) an external magnetic force can be applied to control the movement of magnetic beads, 2) they can be coated with biomolecules for specific binding to other biomolecules, and 3) their size and structure can be controlled for specific applications.1 Based on these features, magnetic separation is a well-established technology and has been applied to various biomolecules, such as tumor cells,2–5 cancer markers,6 and nucleic acids.7,8 The forces that affect the motion of the magnetic particles in a microfluidic system are magnetic force, drag force, gravity force, Brownian force, and lift force and have been reviewed in various articles.2,9–11 Magnetic separation allows removing only target molecules from complex biological mixtures and preparing “clean” solutions that can be used with delicate micro/nano devices. This feature makes magnetic particles attractive tools to cooperate with other micro/nano devices, such as microcantilevers,12 nanowires,13 and microfluidic-based biochips.3,14
Based on the magnetic structure and magnetic response, magnetic beads are classified as ferromagnetic, ferrimagnetic, or paramagnetic/superparamagnetic material. Different types of magnetic beads are commercially available or can be synthesized in research labs; choosing the magnetic material type and size depends on the application requirements. Most of the magnetic beads have iron oxide cores coated with a polymer or silica. For iron oxide, the size also determines the magnetic behavior; as the material gets smaller, ferromagnetic behavior turns into superparamagnetic behavior.1,15,16 Even though ferromagnetic beads are ideal for applications such as hyperthermia and magnetic twisting cytometry as these beads have hysteresis and can agglomerate, for biosensing applications usually superparamagnetic beads are preferred.17
After the separation step, assessment of magnetic bead concentration or captured target molecule concentration is conducted. Measurements from magnetic beads are obtained in different ways,15 such as coil-based magnetometer18/magnetic remanence,19 magnetoresistance,20 hall sensors,21 laser diffraction-based methods,22 and optical methods.23 Signal amplification in biosensors using nanoparticles is promising to reach ultrasensitive detection of biomolecules24 and applied to magnetic particles by linking other types of molecular labels, such as fluorescence labels,25 chemiluminescent labels,26 or quantum dots,27 to reach higher sensitivity levels. In these applications, a secondary nonmagnetic label coated with biomolecules, such as antibody or deoxyribonucleic acid (DNA), binds to either target molecule or the magnetic bead and provides signal or signal amplification for the measurements.28
However, dependency on biomolecular binding for signal amplification has some drawbacks. First of all, biomolecular binding events are sensitive to environmental conditions, such as temperature and ion concentrations of the medium. In order to have high binding rates, procedures have to be followed with extreme care. Secondly, labels coated with biomolecules (such as fluorescent labels) are costly compared to noncoated labels. Finally, some enzymatic reactions required for biomolecular recognition require extra time and specific buffer solutions. For example, to reach four- to fivefold signal amplification using rolling circle amplification and magnetic beads22 briefly, five extra biomolecules, temperature control between 37°C and 95°C, buffer solutions, and ~100 minutes are needed. On the other hand, magnetic particle-based signal amplification does not need extra biomolecules (such as fluorescent labels), temperature control, or specific buffer solutions, and only requires few minutes to perform.
Recent research on using mobile devices as the detectors of biosensing platforms is capable of analyzing target molecules on site, instead of transporting to a laboratory.29,30 Signal amplification in point of care devices results in integration of portable and cost-effective parts with mobile devices to reach necessary sensitivity levels compared to standard techniques.29 In order to design cost efficient magnetic bead assisted point of care biosensors where mobile devices are used as detectors, signal amplification methods are needed.
In this paper, we present a novel signal amplification method based on accumulation of magnetic particles under an applied external weak magnetic field. Therefore, a secondary label coated with biomolecules and any molecular binding events are not required for signal detection and amplification. The magnetized particles form magnetic dipoles and create a force field around them. As a result of dipole–dipole interaction and force field, beads accumulate around each other and form clusters/tails, which increase the area/length in two-dimensional (2D) camera images accordingly thus enabling signal amplification. Figure 1A depicts the experimental setup and the signal amplification method investigated in this paper. The proposed method can be easily combined with conventional magnetic separation. Since the method does not require any biomolecular recognition for signal amplification, it is low cost, time efficient, and easy to implement.
 | Figure 1 Illustration of the signal amplifications methods based on magnetic particles. |
A comparison of the proposed method with the existing conventional signal amplification methods (Figure 1B–D) using magnetic beads for a single target molecule is illustrated in Figure 1. In these methods, the presence of the magnetic or nonmagnetic labels in the biosensor depends on the concentration of the target molecule. If the concentration of the target molecule is high, more labels bind and create an output signal related to target amount.
In this paper, we focus on the details of the signal amplification method based on the magnetic particle flocculation. Both theoretical background of the magnetic particle flocculation mechanism and experimental verification results are presented. Also presented in this paper, combining the signal amplification method with the Escherichia coli separation shows the feasibility of the investigated signal amplification method for future development of a complete biosensing method that we would like to accomplish next. Using the results of this work, as a future study in a companion paper, we would like to present the application of this signal amplification method to selectively detect some biomolecules (Figure 1E) and explore the important biosensor parameters, such as detection limit, range, and reproducibility. (The flow diagram of the proposed method is presented in Figure S1). The order of process steps in Figure 1E minimizes the nonspecific binding. Firstly, target molecules are captured with immunomagnetic beads, and secondly receptors immobilized on the surface capture the target molecules and unbound magnetic particles are washed away. Finally, magnetic accumulation-based signal amplification is implemented just on the magnetic beads present on the surface. There are also ways to decrease the nonspecific binding of molecules and magnetic beads by blocking the surfaces with bovine serum albumin22 or with other blocking agents.
In the next sections, we detail the experimental procedure and describe the dipole–dipole interaction of the magnetic particles. The theoretical accumulation dynamics and experimental investigation are presented. Finally, we demonstrate the application of the signal amplification method on E. coli O157:H7 bacteria samples.
Materials and methods
Ethical approval was not required by the institutional review board of Abdullah Gul University because no human or animal subjects were involved.
Materials
The permanent magnets 3×3 mm Neodymium N42 were purchased from a local hobby shop; Poly(methyl methacrylate) (PMMA) was purchased from McMaster-Carr (Elmhurst, IL, USA); ferromagnetic beads of 8, 4, and 2 μm in diameter were purchased from Spherotech (Lake Forest, IL, USA); paramagnetic beads of 4 μm in diameter were purchased from Spherotech; and superparamagnetic beads of 1 μm in diameter were purchased from chemicell (Berlin, Germany). Iron nanopowder of 60–80 nm in diameter was purchased from Sigma-Aldrich Co., (St Louis, MO, USA); gram stain was purchased from EMD Millipore (Billerica, MA, USA); gauss meter was purchased from Sypris/FW Bell (Orlando, FL, USA); and magnetic beads for capturing E. coli 0157:H7 were purchased from Lab M Ltd (Heywood, UK).
Preparation of the magnetic bead solutions
For magnetic bead solution made from ferromagnetic beads or paramagnetic beads (Spherotech) used in these experiments, the same concentration of solution was prepared by taking 10 μL of 1.0% w/v from each solution followed by washing them twice with phosphate-buffered saline (PBS) and then adding 400 μL of PBS to make a 0.244 mg/mL magnetic bead solution (pH of 7.4).
For the case of super paramagnetic beads (chemicell), 2 μL of 10 mg/mL were used; the same procedure was followed in cleaning but later adding 300 μL PBS to make a 0.067 mg/mL solution.
Magnetic platform and magnetic field characterization
Details of the magnetic platform and magnetic field measurements are included in the supplementary material (Figure S2).
Microscope slides were cut into pieces of 0.8×0.8 cm to place droplets on. A platform made of PMMA material was shaped using a laser cutter and designed for conveniently placing permanent magnets and the glass slide pieces, including magnetic particles, under a microscope objective. The magnetic field between the permanent magnets in the platform was characterized using a gauss meter for different cases. Minimum distance between the magnet pairs was set to 15 mm. Around the middle point of the magnetic platform (7.5 mm), the magnetic field is minimum but uniform. For this reason, the glass slide pieces were approximately placed in the middle of two permanent magnet sets in the experiments. Either the number of permanent magnet pairs increased or distance between them changed by making new platforms to obtain different magnetic field strengths. To investigate the impact of adding magnet pairs, magnet cubes were added to outer sides without changing the distance between initial pair and then the magnetic field was measured. The magnetic field is saturated at ~22 mT for the middle point. Figure 1A illustrates the magnetic bead flocculation-based signal amplification method. Magnetic particles accumulate due to the magnetic dipole–dipole interaction.
Optical microscopy measurements
The videos and images are recorded by using the optical microscopy system (Nikon Instruments, Melville, NY, USA) and the measurements were performed using the analysis software (Nikon NIS Elements) of the imaging system (Nikon Instruments).
Statistical analysis
After the optimization of experimental parameters, all measurements were performed six times by two different researchers to ensure reproducibility and repeatability. From a recorded image, measurements are performed on four different areas, approximately quadrants of the center point. For tail length measurements, tails only around the single beads are measured, and tails around the multiple base beads were omitted. In each area, the average of total number of beads is 32.6 with a standard deviation of 4.2. Statistical significance was considered at P<0.05. Student’s t-test was performed for the experimental results shown in Figures 2 and 3. For comparing magnetic beads with different sizes (Figure 4), analysis of variance test was performed.
 | Figure 2 Impact of concentration and bead type on accumulation. |
 | Figure 3 Impact of magnetic field on accumulation. |
 | Figure 4 Impact of bead size on accumulation. |
Accumulation dynamics: magnetic force field and dipole–dipole interaction
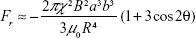
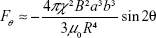
To understand the behavior of magnetic particles under the external magnetic field and to develop a method for signal amplification, the accumulation dynamics need to be examined. Magnetic accumulation is investigated in magnetic filtering and separation studies. The applied external magnetic field magnetizes the magnetic particles. Two magnetized particles exert a dipole–dipole force on each other, and as a result of this force, particles can attract each other and form magnetic flocs (Figure 5A). The approximate polar equations of the magnetic forces of the magnetic particles under the external field are given by:31,32
|
|
|
|
 | Figure 5 Magnetic dipole–dipole interaction. |
where R is the distance between particle centers, a and b are the radius of the interacting particles, B is the magnetic flux density, μ0 is the permeability of free space, χ is the magnetic susceptibility, and θ is the angle between the magnetic field direction and the line connecting particle centers. The magnetic dipole–dipole interaction force has two components, Fr and Fθ, as illustrated in Figure 5A. As sketched in Xue and Furlani.33 and based on Equations 1 and 2, the magnetic dipole–dipole force field direction depends on θ. When θ is 90°, the particle is repelled and when θ is 0°, the attraction force is at maximum, and particle is attracted (Figure 5A). Note that Figure 5A is just an illustration of the force field representing only the variations of θ. Equations 1 and 2 reveal that magnetic forces are increasing as the distance between particles R decreases. Also, as magnetic particles accumulate, a floc can be considered as one magnetic particle with increased radius a resulting in increase of the magnetic force. Thus, single particles tend to move toward the flocs instead of moving to another single particle at the same distance.
According to Shevkoplyas et al,34 the parameters related to magnetic properties provided by magnetic bead manufacturer may diverge significantly from the experimental measurements due to the variations in measurements of the bulk material versus measurements of a single bead. Also, Equations 1 and 2 are approximations based on the assumption that beads are uniform and ideal. For these reasons, in order to investigate the practicality of magnetic bead accumulation-based signal amplification for biosensing, several experiments exploring the impact of parameters in Equations 1 and 2 are conducted and explained in the next sections.
Experimental results (experimental investigation of the accumulation dynamics)
Equations 1 and 2 are used to theoretically explain the magnetic dipole–dipole interactions of magnetic particles under the external magnetic field. Before implementing the magnetic accumulation-based signal amplification to a complete biological detection, the accumulation dynamics should be experimentally investigated and verified for signal amplification purpose. Then, these results will be used in a companion paper to demonstrate the complete biosensing.
The impact of θ on dipole–dipole magnetic interaction
In order to study the impact of θ on dipole–dipole magnetic interaction, ferromagnetic particle pairs having 8, 4, and 2 μm sizes are used. On different glass slide pieces that fit in the magnet platform containing three permanent magnet pairs, a 2 μL drop of magnetic particles having 10 mg/mL concentrations was placed and the movements of the particles toward each other under the external magnetic field are video recorded using an optical microscopy system (Nikon). As the droplet of the same size particles is placed in the magnetic platform, randomly distributed magnetic particles are magnetized and tend to move along the magnetic field. We observed that if the magnetic field is increased to 30 mT, almost all particles move toward permanent magnets but when the magnetic field is around 15 mT, the particle movement is local. This local movement is manipulated by the dipole–dipole interaction between the nearby-magnetized particles (Figure 5B). As mentioned before, magnetic force is not the only force exerted on the particles and drag force or Brownian force was not quantified in our experiments. The recorded videos of each magnetic particle size were processed offline using the analyze tool (NIS Elements) of the imaging system (Nikon) to reveal the trajectories of magnetic particle pairs. The trajectories are normalized as the stationary particles are at the origin and the trajectories of 21 particle pairs were investigated pair by pair approximately for 20 seconds (Figure 5B).
Figure 5A demonstrates the expected magnetic force field based on the Equations 1 and 2 (in the figure only the impact of θ is considered for the forces) and Figure 5B (experimental data) shows the paths followed by the attracted magnetic particles toward the stationary particles for different sizes. At the origin, stationary particles are depicted as circles with different sizes. The trajectories obtained from the experiments reveal that two magnetized particles follow the dipole–dipole force field and attract each other in the direction where θ is ~0°. The repulsion when θ is ~90° is also observed in the trajectories for some particles (Figure 5B trajectories 4 and 20). The direction of the dipole–dipole force field is determined by the 1+3 cos 2θ and sin 2θ terms in Equations 1 and 2, which coincides with the trajectories. Due to the 1/R4 term, the forces Fr and Fθ increase significantly as the distance between the particles decreases (supplementary material for acceleration versus distance graph, Figure S3).
The impact of magnetic particle parameters and magnetic field on dipole–dipole magnetic interaction
In the next sections, the results of the experiments investigating the effects of magnetic field and magnetic bead parameters on magnetic accumulation are explained. To compare the impact of magnetic material type and thus the impact of the magnetic susceptibility and moment, we used ferromagnetic (Spherotech) and paramagnetic (Spherotech) beads of the same size. We first put a 2 μL drop (0.244 mg/mL magnetic bead solution =1× concentration) using a pipette of either ferromagnetic (4 μm) or paramagnetic (4 μm) beads to the glass slide pieces placed in the magnetic platform where approximately a constant magnetic field of 9.5 mT at the center of the glass piece is generated by the permanent magnets. We quantified the magnetic interaction between the same types of beads by measuring the length of accumulation at different times for a total duration of 6 minutes and plotted the accumulation lengths versus time (Figure 2). In 6 minutes, ferromagnetic bead accumulation reached to an average saturation length of 35 μm for 2× concentration and 22 μm for 1× concentration whereas paramagnetic beads of the same size and 1× concentration form lines having an average length of 13 μm.
The total number of beads in a larger area of the recorded image around the center point is quantified for the same concentrations of paramagnetic and ferromagnetic beads. The average number of paramagnetic beads is 655 beads and the average of ferromagnetic beads is 575 for the same size area. Even though the number of paramagnetic beads is slightly higher than the number of ferromagnetic beads, paramagnetic beads tend to stay alone whereas ferromagnetic beads tend to accumulate and form chains. In order to increase the accumulation length, one way is to increase the number of beads in the drop by preparing a higher concentration solution. Figure 2A shows the impact of doubling the concentration of ferromagnetic beads (0.488 mg/mL magnetic bead solution =2× concentration) on the accumulation length.
Ordering of the magnetic dipole moments in the materials determines the magnetic behavior of the material and this magnetic ordering has atomic origins, such as electron spinning and orbital angular momenta. The susceptibility of paramagnetic materials can be very small compared to ferromagnetic materials.35 It was shown that magnetic moment of individual ferromagnetic bead is approximately ten times more than the same size superparamagnetic bead;36,37 this fact resulted in longer bead chains and faster response to magnetic field in our experiments.
In order to explore the effect of the applied magnetic field and the response of the magnetic materials, we first placed the same amount of either ferromagnetic (Spherotech) or paramagnetic (Spherotech) beads (base beads, both of size 4 μm) onto the glass pieces in the magnetic platform. After waiting for 4 minutes (enough time to reach saturation), superparamagnetic beads (chemicell) of size 1 μm were added to the droplet on the glass piece. After waiting for 4 minutes, pictures were taken and the lengths of tails on single base beads (Spherotech) formed by the added beads (chemicell) were measured using the optical microscopy. Measuring the tail lengths was performed for each magnetic field strength (Figure 3). It was observed that for the same size (4 μm), ferromagnetic beads formed longer tails compared to the paramagnetic beads for the same external magnetic field. When ferromagnetic beads are used as the base beads and as added beads, higher magnetic moment resulted in longer tails (Figure 2); however, since the added beads are superparamagnetic, the magnetic interaction between particles is not as significant as the interaction between the same type beads, that is, ferromagnetic and ferromagnetic particles (Figure 2). As seen in Figure 3, a magnetic field strength of ~8 mT was enough to saturate the line formation. For the magnetic fields higher than 18 mT, magnetic fields are strong enough to pull some beads and move them away from the center of the platform to the edge.
In Equations 1 and 2, the radiuses of beads have a third order impact on the magnetic dipole–dipole force. To investigate the impact of magnetic bead size on the magnetic accumulation, a similar procedure as explained above was followed: a drop of solution containing magnetic beads of the same size was placed on top of a small microscope slide piece in the magnetic platform. After waiting for 4 minutes inside the magnetic platform, 1 μm size superparamagnetic particles (chemicell) were added. Under the same external magnetic field of around 12.56 mT, the interaction of base beads of different sizes (2, 4, and 8 μm ferromagnetic beads) and the added superparamagnetic beads were explored. The optical microscope was used to record the images and measure the lengths of the accumulation on single base beads for the same amount of time. The lengths measured were plotted versus the size of each magnetic particle in Figure 4A. As expected, longer accumulation was observed on the base beads with the larger size, since larger magnetic dipole–dipole force is created as the size of the particle increases (Figure 4B). However, the difference in accumulation length for various base beads is not exactly following the third order dependence in Equations 1 and 2. This is due to the fact that Equations 1 and 2 are magnetic dipole–dipole force equations assuming ideal beads. Even though magnetic dipole–dipole force has a significant impact on accumulation, there are other factors, such as particle amount in the environment, gravity force, and inhomogeneity of the particles and the liquid, which affect the particle accumulation.
Iron nanoparticle experiments
Iron nanoparticles, low cost and easily accessible through purchasing or synthesizing, have a variety of biomedical applications.38 To demonstrate the capability of the method as a signal amplification technique for 2D images through increasing the pixel area of a single bead with various magnetic particles, we conducted experiments using ferromagnetic beads (Spherotech) as the base beads and iron nanopowder (Sigma-Aldrich) as added accumulation particles. A similar procedure as explained in previous sections was followed. First base beads were added onto the glass pieces in the magnetic platform and after waiting for 4 minutes, 2 μL of iron nanopowder solution (0.83 mg/mL) was added. The goal of the experiment was to show that magnetized particles attract iron nanoparticles and form flocs so that the pixel area of the floc is increased compared to the pixel area of a single bead. Both the iron nanopowder and ferromagnetic particles were magnetized and magnetic dipole–dipole interaction was created. Heavier ferromagnetic particles created local magnetic fields as depicted in Figure 6 and magnetically attracted iron nanoparticles due to the forces in Equations 1 and 2. Approximately, a two- to threefold increase in pixel area was obtained as compared to using just the magnetic beads alone with no iron nanopowder (Figure 6). Particles in iron nanopowder have a diameter of 60–80 nm and the number of particles is calculated by measuring the area of the accumulation from the recorded images using the imaging software and under the assumption of having single layer we divided the measured area to iron particle area. Approximately, an average of 7,000 particles accumulated around a single base bead as a result of the magnetic dipole–dipole interaction. To control this accumulation, either the concentration of added iron particles or magnetic field can be increased (Figure S4).
 | Figure 6 Accumulation of iron nano particles. |
In order to test the performance of magnetic accumulation in liquids with different pH values, hydrofluoric acid and sodium hydroxide were used to prepare distilled water solutions having a pH of 2 and 14. Magnetic accumulation in these liquids was investigated following a similar procedure as above. To investigate the impact of pH on the magnetic accumulation, the length of ferromagnetic beads (4 μm) under an applied magnetic field of 9.5 mT was measured and the length after 4 minutes compared to corresponding measurement value in Figure 2. No significant difference was observed; the measured values were within the standard deviation.
When the permanent magnets were removed from the magnetic platform, both the ferromagnetic and paramagnetic bead chains kept magnetization but immediately (in seconds) unaligned with respect to magnetic field lines and kept the formation for a few minutes (Figure S5).
Magnetic accumulation on E. coli samples
To present the potential of the magnetic accumulation-based signal amplification, the method was combined with the conventional E. coli separation technique. Note that the complete biosensing method, including the quantification of the detection limit as depicted in Figure 1E, which requires surface functionalization and capturing bacteria on the surface, is not demonstrated in this paper and is the subject of our future work. In this part, we only demonstrated the signal amplification on the immunomagnetic beads that were used to capture and separate bacteria to confirm the feasibility of the method (Figure 7). A complete biosensing for diagnostics, including specifically capturing target molecules on the sensor surface, will be presented in a companion paper.
 | Figure 7 Illustration of the Escherichia coli experiments. |
E. coli 0157 is pathogenic and the presence of it in food samples has to be monitored. Conventional immunomagnetic capturing of E. coli from culture media was performed according to International Organization for Standardization E. coli 0157 detection standard 16654:2001 and a similar procedure can be found in Almeida et al.39 Briefly, E. coli samples were incubated for 6 hours at 41.5°C for pre-enrichment. For immunomagnetic separation, 1 mL sample was mixed with 20 μL of magnetic beads, Captivate 0157 (Lab M) coated with anti-E. coli O157 antibodies for 10 minutes. The captured bacteria were separated using magnetic stand, washed, and resuspended in 100 μL in washing PBS. Then, 40 μL of the solution was transferred to a glass microscope slide and allowed to dry in air. Next, in order to visualize bacteria under optical microscopy and to verify that anti-E. coli beads capture the bacteria, simple staining by covering the glass slide with crystal violet dye for 1 minute was performed. The excessive dye was rinsed off with water to complete the standard simple staining procedure.37,39 To perform magnetic dipole–dipole interaction, ferromagnetic beads (8 μm) suspended in PBS buffer added to stained bacteria and the platform, including permanent magnets, were placed on the two sides of the droplet on the glass slide, as in Figure 7. The anti-E. coli magnetic beads were attracted to ferromagnetic beads as a result of magnetic dipole–dipole interaction forming an accumulation as:
The stained E. coli bacteria (purple) + anti-E. coli magnetic bead (dark orange/brown, 2 μm) + ferromagnetic bead (silver, 8 μm) (Figure 7).
The aim of the experiments on E. Coli samples is not to reach any calibration curve or quantification of minimum detection limit by optimizing the method so no data about these topics presented in this paper however the aim the experiments is to show that the proposed method can be easily combined with the conventional magnetic capturing/separation techniques for an important target molecule and proof-of-principle of magnetic accumulation based signal amplification method when applied to the important target molecule.
In Figure 7, both the air-dried and wet samples, as well as a sample with nonspecific binding are shown. For the droplets dried in air, the magnet platform, including permanent magnets, was removed. The magnetic beads in the wet samples aligned in the direction of magnetic field created by external magnets (Figure 7E). In the dry samples, even though magnetic field was removed, magnetic beads were still connected to each other due to remanent magnetization of the particles. With the help of staining, the area of a single E. coli bacterium was measured to be around 1 μm2 and the area of anti-E. coli magnetic bead was measured to be ~2.8 μm2 using the imaging system (Nikon NIS Elements). Due to the magnetic interaction, the total area of the accumulation that includes the magnetic particles and the target molecule is higher than target molecule (single bacterium) alone. The total area of accumulation was measured from various flocs in different trials using the image analysis tool of the optical system (Nikon NIS Elements) and it was determined that the area of flocs has a range of 2.8 to 60 μm2. As a result of magnetic accumulation, a minimum threefold (due to only E. coli + single anti-E. coli bead) to a maximum 60-fold (due to anti-E. coli beads + magnetic beads) signal amplification from single bacteria in terms of the corresponding pixel area was observed (Table 1). The purpose of the demonstration experiments was to show that the proposed method is available to integrate with the existing separation methods. Since the optimization of the experimental parameters is not the goal of the E. coli experiments presented in this paper, the exposing time to magnetic field and distribution of the magnetic beads in the medium are not uniform and resulted in the variations of the amplification. As a next phase, we plan to develop a complete target detection mechanism as depicted in Figure 1E, which is target-specific and optimized for biosensing, and validate the signal amplification ratios that we observed when the target molecule is specifically captured on the sensor surface.
 | Table 1 Corresponding average number of pixels obtained from the optical imaging system for each entity |
The number of pixels for highest accumulation is 169,060 (Figure 7C). The corresponding pixel numbers also indicate the amplification of the signal.
Discussion
The strategy for complete biosensing
In this paper, we investigated the signal amplification dynamics and obtained the accumulation characteristics. Our future efforts will be on standardizing the target detection and finding the minimum detection limit by establishing a complete biosensing scenario, which has target specificity. A conventional method is to use functionalized surface to capture bacteria40 and expose E. coli + anti-E. coli bead to this surface after separation step (Figure 1E). Thus, the free magnetic particles would be removed from the environment by fluid flow and a sandwich assay is formed on the surface resulting in target specificity. Then, magnetic accumulation-based signal amplification can be performed to obtain specific signal amplification against E. coli. We plan to use a mobile device to record images so that a portable biosensor system can be used to analyze samples on site.
It is very well known that for separation purposes, the magnetic particles can be coated with various receptors (such as monoclonal antibodies, DNA, or streptavidin) to capture different target cells (such as tumor cells and lymphoid cells),41 bacteria (such as Salmonella, Listeria monocytogenes, and Rickettsia conorii), and viruses (such as enterovirus and HIV-1).42 Since our method requires only magnetic accumulation and does not depend on biomolecular interaction for signal amplification, it can be easily combined to existing immunomagnetic separation techniques where magnetic beads are coated with various receptors. As a generalized strategy: in order to have complete biosensing and specificity, another receptor molecule specific to target can be immobilized on the sensor surface. In this way, the target molecule is specifically captured on the functionalized sensor surface and after the washing steps and removing unbound molecules, sandwich assay is obtained on the surface: capture receptor + target + coated magnetic bead. After having this sandwich assay, the magnetic particle flocculation-based signal amplification would be easily implemented.
It is possible to use the experimental investigation results and the Equations 1 and 2 to design and optimize novel magnetic particles with high efficiency for the proposed method.43 From the results that were obtained, we believe our method can be also integrated to other applications where magnetic beads are used for separation and signal detection, such as diffraction-based sensing.22 Only few low cost permanent magnets and uncoated magnetic particles are needed to implement this method to existing separation schemes. No temperature control and labels coated with biomolecules are needed for the proposed method. Also, magnetic accumulation was tested in mediums with pH levels of 2 and 14. No significant impact of pH on accumulation length was observed.
The prices of particles coated with biomolecular probes are at least double the price of uncoated particles based on the biomolecular coating type. This method offers a simpler, cost and time efficient alternative to other amplification techniques that require labels coated with biomolecules for binding. For instance, conventional standard E. coli detection procedure includes magnetic separation of E. coli from food samples and culturing them in petri dishes, which takes more than 24 hours and some detection procedures require fluorescent labels.39 Together with separation step, our method only takes 20–25 minutes and does not need any fluorescent labels.
The ultimate goal of the magnetic bead accumulation-based signal amplification is to reach enough signal amplification to use mobile devices as the signal readout method of the point of care devices as illustrated in Figure 1E. In such a system, a low cost spherical lens can be attached to the camera of the mobile device to capture the images. The accumulated magnetic beads (flocs) around the target molecule increase the pixel area in the recorded image and thus increase the sensitivity. To test the feasibility of using mobile devices as the readout device, preliminary experiments were performed; after magnetic bead-based signal amplification, the images of the same area are recorded both by the Nikon imaging system and by the Samsung Note 2 cell phone attached with a low cost spherical lens (Figure S6). The results are promising for optimizing the mobile device-based imaging system to quantify the detection limit.
As magnetic accumulation around the immunomagnetic beads forms flocs, the volume, mass, and area of the target molecule are increased; in this study, optical images are used as a readout method from the flocs, and alternative readout methods, such as laser diffraction-based gratings or magnetometer-based techniques, can be also used with this amplification technique.
To validate the magnetic particle accumulation in a dynamic environment where there is a continuous fluid flow, we performed proof-of-principle experiments. We first immobilized magnetic particles on a gold surface using biotin–streptavidin12,44 interaction and placed this surface in a microfluidic chamber. Using a syringe pump, we created a slow fluid flow (50 μL/min) of PBS. Then, we applied a magnetic field of 7 mT and injected PBS solution having iron nanoparticles. We observed that many iron particles accumulated around the surface beads due to the magnetic dipole–dipole interaction. Our optimization efforts still continue on these experiments (Figure S7).
Conclusion
We have presented a cost and time efficient signal amplification method that demonstrates a high potential to be easily combined with conventional magnetic separation techniques and use mobile devices as the readout device. In this paper, the theoretical accumulation dynamics were investigated through experiments. In this method, the accumulation of magnetized particles increase the surface area and thus amplify the pixel area of the targeted molecules without the need of using labels that depend on biomolecular binding. The accumulation dynamics of magnetic particles under a magnetic field for magnetic material type and size were investigated; the characteristics of both ferromagnetic and paramagnetic beads under the magnetic field showed that magnetic response and accumulation of ferromagnetic particles are faster and larger compared to paramagnetic particles. Even though ferromagnetic particles have higher rates of accumulation, superparamagnetic beads can be also used for signal amplification. In order to design an application of magnetic accumulation-based signal amplification, Equations 1 and 2 can be combined with other design parameters to optimize the bead type and size selection. The potential of the method is shown on E. coli 0157:H7 bacteria samples. In the experiments within the scope of this manuscript, the signal amplification is not specific to E. coli, which is a requirement for selectivity of a biosensor. Integrating the proposed method with microfluidic platforms in the light of obtained experimental results for complete E. coli detection and various targets, such as tumor cell,45 is our next goal. The images recorded by using a mobile device attached with a low cost lens are promising for future optimization studies.
Acknowledgments
The authors acknowledge TÜBİTAK (Project No: 114E886) and AGU BAP (2015-11) for financial support. Omary Mzava acknowledges TÜBİTAK for the scholarship (2215). The authors also thank Professor Cagri Savran from Purdue University for valuable discussions, Hülya Sarayli and Nurdan Yapar from City Control Lab for the valuable information about E. coli staining and capturing procedures, and Cengiz Gazeloglu for the discussions on statistical analysis.
Disclosure
The authors report no conflicts of interest in this work.
References
Pankhurst QA, Connolly J, Jones SK, Dobson J. Applications of magnetic nanoparticles in biomedicine. J Phys D Appl Phys. 2003;36(13):R167–R181. | ||
Zborowski M, Chalmers JJ. Rare cell separation and analysis by magnetic sorting. Anal Chem. 2011;83(21):8050–8056. | ||
Chang C-L, Huang W, Jalal SI, et al. Circulating tumor cell detection using a parallel flow micro-aperture chip system. Lab Chip. 2015;15(7):1677–1688. | ||
Xu H, Aguilar ZP, Yang L, et al. Antibody conjugated magnetic iron oxide nanoparticles for cancer cell separation in fresh whole blood. Biomaterials. 2011;32(36):9758–9765. | ||
Forbes TP, Forry SP. Microfluidic magnetophoretic separations of immunomagnetically labeled rare mammalian cells. Lab Chip. 2012;12(8):1471. | ||
Huang W, Chang C-L, Chan B-D, et al. Concurrent detection of cellular and molecular cancer markers using an immunomagnetic flow system. Anal Chem. 2015;87(20):10205–10212. | ||
Berensmeier S. Magnetic particles for the separation and purification of nucleic acids. Appl Microbiol Biotechnol. 2006;73(3):495–504. | ||
Zhang Y, Guo Y, Quirke P, Zhou D. Ultrasensitive single-nucleotide polymorphism detection using target-recycled ligation, strand displacement and enzymatic amplification. Nanoscale. 2013;5(11):5027–5035. | ||
Hejazian M, Li W, Nguyen N-T. Lab on a chip for continuous-flow magnetic cell separation. Lab Chip. 2015;15(4):959–970. | ||
Rikken RSM, Nolte RJM, Maan JC, van Hest JCM, Wilson DA, Christianen PCM. Manipulation of micro- and nanostructure motion with magnetic fields. Soft Matter. 2014;10(9):1295–1308. | ||
Furlani EP, Sahoo Y, Ng KC, Wortman JC, Monk TE. A model for predicting magnetic particle capture in a microfluidic bioseparator. Biomed Microdevices. 2007;9(4):451–463. | ||
Icoz K, Savran C. Nanomechanical biosensing with immunomagnetic separation. Appl Phys Lett. 2010;97(12):123701. | ||
Huang HT, Ger TR, Lin YH, Wei ZH. Single cell detection using a magnetic zigzag nanowire biosensor. Lab Chip. 2013;13(15):3098–3104. | ||
Earhart CM, Hughes CE, Gaster RS, et al. Isolation and mutational analysis of circulating tumor cells from lung cancer patients with magnetic sifters and biochips. Lab Chip. 2014;14(1):78–88. | ||
Tamanaha CR, Mulvaney SP, Rife JC, Whitman LJ. Magnetic labeling, detection, and system integration. Biosens Bioelectron. 2008;24(1):1–13. | ||
Baselt DR, Lee GU, Natesan M, Metzger SW, Sheehan PE, Colton RJ. A biosensor based on magnetoresistance technology. Biosens Bioelectron. 1998;13(7–8):731–739. | ||
Janssen XJ, van IJzendoorn LJ, Prins MWJ. On-chip manipulation and detection of magnetic particles for functional biosensors. Biosens Bioelectron. 2008;23(6):833–838. | ||
Yu D, Ruangchaithaweesuk S, Yao L, Xu S. Detecting molecules and cells labeled with magnetic particles using an atomic magnetometer. J Nanoparticle Res. 2012;14(9):1135. | ||
Hao L, Aßmann C, Gallop JC, et al. Detection of single magnetic nanobead with a nano-superconducting quantum interference device. Appl Phys Lett. 2011;98(9):092504. | ||
Rife JC, Miller MM, Sheehan PE, Tamanaha CR, Tondra M, Whitman LJ. Design and performance of GMR sensors for the detection of magnetic microbeads in biosensors. Sensors Actuat A Phys. 2003;107(3):209–218. | ||
Besse P-A, Boero G, Demierre M, Pott V, Popovic R. Detection of a single magnetic microbead using a miniaturized silicon Hall sensor. Appl Phys Lett. 2002;80(22):4199. | ||
Lee J, Icoz K, Roberts A, Ellington AD, Savran CA. Diffractometric detection of proteins using microbead-based rolling circle amplification. Anal Chem. 2010;82(1):197–202. | ||
Cooper RM, Leslie DC, Domansky K, et al. A microdevice for rapid optical detection of magnetically captured rare blood pathogens. Lab Chip. 2014;14(1):182–188. | ||
Lei J, Ju H. Signal amplification using functional nanomaterials for biosensing. Chem Soc Rev. 2012;41(6):2122–2134. | ||
Mai TD, Pereiro I, Hiraoui M, et al. Magneto-immunocapture with on-bead fluorescent labeling of amyloid-β peptides: towards a microfluidized-bed-based operation. Analyst. 2015;140(17):5891–5900. | ||
Fan A, Lau C, Lu J. Magnetic bead-based chemiluminescent metal immunoassay with a colloidal gold label. Anal Chem. 2005;77(10):3238–3242. | ||
Liu YJ, Yao DJ, Chang HY, Liu CM, Chen C. Magnetic bead-based DNA detection with multi-layers quantum dots labeling for rapid detection of Escherichia coli O157:H7. Biosens Bioelectron. 2008;24(4):558–565. | ||
Tekin HC, Gijs MA. Ultrasensitive protein detection: a case for microfluidic magnetic bead-based assays. Lab Chip. 2013;13(24):4711–4739. | ||
Ludwig SKJ, Tokarski C, Lang SN, et al. Calling biomarkers in milk using a protein microarray on your smartphone. PLoS One. 2015;10(8):e0134360. | ||
D’Ambrosio M V, Bakalar M, Bennuru S, et al. Point-of-care quantification of blood-borne filarial parasites with a mobile phone microscope. Sci Transl Med. 2015;7(286):286re4. | ||
van Kleef R, Myron H, Wyder P, et al. Limits of magnetic flocculation in colloidal dispersions. IEEE Trans Magn. 1983;19(5):2118–2120. | ||
Lu S, Pugh RJ, Forssberg E. Interfacial Separation of Particles; 2005. | ||
Xue X, Furlani EP. Analysis of the dynamics of magnetic core–shell nanoparticles and self-assembly of crystalline superstructures in gradient fields. J Phys Chem C. 2015;119(10):5714–5726. | ||
Shevkoplyas SS, Siegel AC, Westervelt RM, Prentiss MG, Whitesides GM. The force acting on a superparamagnetic bead due to an applied magnetic field. Lab Chip. 2007;7(10):1294–1302. | ||
Spaldin NA. Magnetic Materials Fundamentals and Applications. 2nd ed. New York: Cambridge University Press; 2010. | ||
De Los Santos VL, Llandro J, Lee D, et al. Magnetic measurements of suspended functionalised ferromagnetic beads under DC applied fields. J Magn Magn Mater. 2009;321:2129–2134. | ||
Jiang Z, Llandro J, Mitrelias T, Bland JAC. An integrated microfluidic cell for detection, manipulation, and sorting of single micron-sized magnetic beads. J Appl Phys. 2006;99(8):08S105. | ||
Gupta AK, Gupta M. Synthesis and surface engineering of iron oxide nanoparticles for biomedical applications. Biomaterials. 2005;26:3995–4021. | ||
Almeida C, Sousa JM, Rocha R, et al. Detection of Escherichia coli O157 by peptide nucleic acid fluorescence in situ hybridization (PNA-FISH) and comparison to a standard culture method. Appl Environ Microbiol. 2013;79(20):6293–6300. | ||
Singh A, Glass N, Tolba M, Brovko L, Griffiths M, Evoy S. Immobilization of bacteriophages on gold surfaces for the specific capture of pathogens. Biosens Bioelectron. 2009;24(12):3645–3651. | ||
Haukanes BI, Kvam C. Application of magnetic beads in bioassays. Biotechnology (NY). 1993;11(1):60–63. | ||
Olsvik Ø, Popovic T, Skjerve E, et al. Magnetic separation techniques in diagnostic microbiology. Clin Microbiol Rev. 1994;7(1):43–54. | ||
Hatch GP, Stelter RE. Magnetic design considerations for devices and particles used for biological high-gradient magnetic separation (HGMS) systems. J Magn Magn Mater. 2001;225(1–2):262–276. | ||
Icoz K, Iverson BD, Savran C. Noise analysis and sensitivity enhancement in immunomagnetic nanomechanical biosensors. Appl Phys Lett. 2008;93:103902. | ||
Gusenbauer M, Nguyen H, Reichel F, et al. Guided self-assembly of magnetic beads for biomedical applications. Phys B Condens Matter. 2013;435:21–24. | ||
Malhotra R, Patel V, Chikkaveeraiah B V, et al. Ultrasensitive detection of cancer biomarkers in the clinic by use of a nanostructured microfluidic array. Anal Chem. 2012;84(14):6249–6255. |
 © 2016 The Author(s). This work is published and licensed by Dove Medical Press Limited. The
full terms of this license are available at https://www.dovepress.com/terms
and incorporate the Creative Commons Attribution
- Non Commercial (unported, 3.0) License.
By accessing the work you hereby accept the Terms. Non-commercial uses of the work are permitted
without any further permission from Dove Medical Press Limited, provided the work is properly
attributed. For permission for commercial use of this work, please see paragraphs 4.2 and 5 of our Terms.
© 2016 The Author(s). This work is published and licensed by Dove Medical Press Limited. The
full terms of this license are available at https://www.dovepress.com/terms
and incorporate the Creative Commons Attribution
- Non Commercial (unported, 3.0) License.
By accessing the work you hereby accept the Terms. Non-commercial uses of the work are permitted
without any further permission from Dove Medical Press Limited, provided the work is properly
attributed. For permission for commercial use of this work, please see paragraphs 4.2 and 5 of our Terms.