Back to Journals » Clinical Ophthalmology » Volume 12
Macular ganglion cell asymmetry for detecting paracentral scotoma in early glaucoma
Authors Yang HY, Chang YF, Hsu CC ![]() , Ko YC
, Ko YC ![]() , Liu CJL, Chen MJ
, Liu CJL, Chen MJ ![]()
Received 26 July 2018
Accepted for publication 22 September 2018
Published 5 November 2018 Volume 2018:12 Pages 2253—2260
DOI https://doi.org/10.2147/OPTH.S181551
Checked for plagiarism Yes
Review by Single anonymous peer review
Peer reviewer comments 3
Editor who approved publication: Dr Scott Fraser
Hsin-Yu Yang,1 Yu-Fan Chang,1,2 Chih-Chien Hsu,1,2 Yu-Chieh Ko,1–3 Catherine Jui-Ling Liu,1,3 Mei-Ju Chen1,3
1Department of Ophthalmology, Taipei Veterans General Hospital, Taipei, Taiwan; 2Institute of Clinical Medicine, National Yang-Ming University, Taipei, Taiwan; 3School of Medicine, National Yang-Ming University, Taipei, Taiwan
Purpose: We evaluated macular ganglion cell asymmetry as a tool for diagnosing paracentral scotoma (PCS) in early glaucoma.
Patients and methods: This prospective study compared 58 patients with early glaucoma and PCS to 58 age-matched control individuals. All glaucomatous eyes had scotoma within the central 12 degrees of fixation and confined to one hemifield. We measured circumpapillary retinal nerve fiber layer (cpRNFL) thickness, macular ganglion cell-inner plexiform layer (GCIPL) thickness, and optic nerve head (ONH) parameters with Cirrus spectral domain optical coherence tomography. Macular ganglion cell asymmetry was expressed as the absolute differences and the ratios between the inferior and superior hemispheres, inferotemporal (IT) and superotemporal (ST) areas, IT and superonasal (SN) areas, IT and inferonasal (IN) areas, and ST and IN areas. The asymmetry index was the absolute log10 of the ratio. The area under the receiver operating characteristics curve (AUROC) and partial AUROC (pAUROC, specificities ≥90%) were analyzed for each parameter.
Results: All GCIPL parameters and most cpRNFL parameters were significantly lower in early glaucoma than in controls. The best discriminating parameters were inferior RNFL thickness, average RNFL thickness, and minimum GCIPL thickness. The macular ganglion cell asymmetry parameters with the largest AUROCs were the log IT/ST index, the absolute difference in IT-ST GCIPL thicknesses, and the log IT/SN index. Performance was comparable between the log IT/ST index and the cpRNFL (inferior RNFL thickness, P=0.129), GCIPL (minimum GCIPL thickness, P=0.358), and ONH parameters (vertical cup-to-disc ratio, P=0.475).
Conclusion: The IT/ST asymmetry index may be useful as a new parameter for detecting structural changes in glaucoma patients with PCS.
Keywords: macular ganglion cell, paracentral scotoma, glaucoma, optical coherence tomography
Introduction
Glaucoma is characterized by the progressive death of retinal ganglion cells (RGCs), loss of RGC axons, and corresponding visual field (VF) defects. Glaucomatous eyes with paracentral scotoma (PCS) carry the highest risk of visual acuity loss. The introduction of spectral domain optical coherence tomography (OCT) has allowed reproducible, successful segmentation of the inner macular layers. Several studies have shown thinning of the inner retina or RGC complex within the macular area in early glaucoma.1–3 The abnormally thinned macular area typically defined on OCT significance maps may be a useful predictor of the presence of PCS.4,5
In eyes with early glaucoma, OCT studies have revealed a step-like arcuate defect of the temporal macular ganglion cell-inner plexiform layer (GCIPL) map.6 This defect was explained by the vertical asymmetry in the GCIPL thickness distribution between the superior and inferior hemispheres, which could be detected with spectralis posterior pole asymmetry analyses7–10 or customized software available with the Cirrus OCT.11,12 However, localized thinning of the ganglion cell layer might be detected less frequently with hemisphere-based measurements, compared with sector-based analysis, in eyes with PCS. In this study, we evaluated the diagnostic values of the absolute difference, asymmetry ratio, and asymmetry index between six parafoveal macular scans. We compared analyses of asymmetry in the GCIPL thicknesses with traditional analyses of circumpapillary retinal nerve fiber layer (cpRNFL), GCIPL, and optic nerve head (ONH) parameters for accuracy in the diagnosis of patients with early glaucoma and PCS.
Patients and methods
We recruited patients with early glaucoma and PCS who visited the outpatient clinic of Taipei Veterans General Hospital between July 2014 and December 2015. We also enrolled age-matched control subjects by recruiting healthy volunteers who came for a routine eye examination. The study protocol was approved by the Institutional Review Board of our hospital. The study design was in accordance with the Declaration of Helsinki. Written informed consent was obtained from all subjects.
Early glaucoma was defined as eyes with RNFL defects that corresponded to glaucomatous optic disc changes and a mean deviation of VF defect of ≥−6.0 dB. A RNFL defect was defined as a dark, wedge-shaped area, with an apex touching the optic disc border in the brightly striated pattern of the surrounding RNFL13 or a generalized loss of RNFL visibility in the retina.14 Glaucomatous optic disc changes were defined as follows: a >0.7 vertical cup-to-disc ratio (C/D); a >0.2 asymmetric C/D between the glaucomatous and normal eyes; and neuroretinal rim thinning, notching, or excavation on color disc photography. All images were evaluated by three glaucoma specialists (M-JC, Y-CK, and CJ-LL), who were blinded to the clinical evaluation results. A glaucomatous VF was defined as three contiguous, non-edge points within the same hemifield, which showed a pattern standard deviation (PSD) P-value <0.05, and with at least one point with a P-value <0.01, evaluated with two reliable VF tests, or classified as outside the normal limits with a glaucoma hemifield test.15 A reliable VF test was defined as having a fixation loss rate <20%, a false positive rate <33%, and a false negative rate <33%. A diagnosis of early glaucoma was based on a VF mean deviation ≥−6 dB.16 All glaucomatous eyes had scotoma confined to one hemifield. PCS was defined as a scotoma within the central 12 degrees of fixation, with at least one point with a P-value <0.01 within the central 6 degrees of fixation on the PSD plot.17
All subjects underwent a comprehensive ophthalmic examination, which included a best corrected visual acuity assessment, automated refraction and keratometry, Goldmann applanation tonometry, slit-lamp examination, gonioscopy, dilated fundus exam, red-free fundus photography, and automated VF examination (Humphrey 24–2 SITA standard algorithm). Axial length was measured with an IOLMaster (Carl Zeiss Meditec AG, Jena, Germany), and central corneal thickness was determined with a DGH 55 Pachmate (DGH Technology, Exton, PA, USA). For study enrollment, subjects had to meet the following criteria: age ≥20 years, best corrected visual acuity ≥20/40, open angle structure upon gonioscopic examination, and astigmatism ≤3 D. Control subjects were required to have a normal anterior segment on slit-lamp examination, no glaucomatous changes of the ONH, and normal VF. Eyes were excluded when they showed retinal or neurologic diseases; ocular inflammation; prior ocular surgery within 3 months; prior refractive surgery; or concurrent disease that could interfere with intraocular pressure (IOP) measurements or OCT imaging or that could cause VF defects.
Cirrus HD-OCT (Carl Zeiss Meditec, Dublin, CA, USA) was performed after pupillary dilation. All the scans were performed by a qualified technician blinded to the diagnosis of all subjects. The Cirrus HD-OCT Optic Disc Cube 200×200 protocol was used to measure the ONH rim area, disc area, average C/D, vertical C/D, cup volume, average cpRNFL thickness, and the cpRNFL thicknesses in quadrants and in 12 clock-hour sectors. The Macular Cube 200×200 protocol was used to calculate the average, minimum, and regional GCIPL thicknesses in six wedge-shaped sectors (Figure 1). GCIPL thickness in the superior hemisphere (S) was calculated as the sum of superonasal (SN), superior, and superotemporal (ST) thicknesses. GCIPL thickness in the inferior hemisphere (I) was calculated as the sum of inferonasal (IN), inferior, and inferotemporal (IT) thicknesses. We compared the differences between hemispheres (I–S), and between sectors (IT–ST, IT–SN, IT–IN, and ST–IN). Macular ganglion cell asymmetry was expressed as the absolute difference (eg, I–S) and as the ratio (eg, I/S) between thicknesses of the designated areas. Also, an asymmetry index was calculated as the absolute value of the log10 of the ratio (eg, log10 I/S). Images were excluded when they exhibited signal strengths <7, motion artifacts, poor centration, segmentation errors, artifacts caused by ocular pathology, or missing data on the peripapillary region. There was a time interval of <3 months between the HD-OCT and the other ophthalmic examinations (eg, VF).
 | Figure 1 The Cirrus HD-OCT macular cube 200×200 protocol provides regional GCIPL thickness in six wedge-shaped sectors. |
For each subject, one eye was randomly chosen when both eyes were eligible. Statistical analyses were performed with SPSS version 12.0 (SPSS Inc., Chicago, IL, USA) and STATA version 12.1 (Stata Corp LP, College Station, TX, USA). For continuous variables, the normality of data distributions was verified with the Shapiro–Wilk test. We employed the Student’s t-test for normally distributed data, and the Mann–Whitney U-test for non-normally distributed data to analyze differences between early glaucoma and normal groups. The sex ratios were compared with the chi-squared test. To evaluate each parameter for the ability to discriminate between early glaucoma and normal eyes, we calculated the area under the receiver operating characteristic curve (AUROC) and the partial AUROC (pAUROC), with specificities ≥90% and 95%. The diagnostic performances quantified with AUROC and pAUROC values were compared with the methods from DeLong et al.18 P-values <0.05 were considered statistically significant.
Results
This study included 58 eyes with early glaucoma and PCS and 58 age-matched normal control eyes. There were 30 eyes with primary open angle glaucoma and 28 eyes with normal tension glaucoma. Fifty-five eyes (95%) were treated with antiglaucoma drugs, while three eyes (5%) were not treated with drugs. Twenty-five (46%) eyes used one drug, 16 (29%) used two drugs, 11 (20%) used three drugs, and three (5%) used four drugs. For eyes treated with one drug, seven eyes (28%) used beta blockers, three eyes (12%) used alpha two agonists, one eye (4%) used carbonic anhydrase inhibitors, and 14 eyes (56%) used prostaglandins. For eyes treated with two drugs, beta blockers and prostaglandins were the most common combination of 11 (69%) eyes. Table 1 shows the demographic and clinical characteristics of the subjects. There were no significant between-group differences in age, spherical equivalence, axial length, central corneal thickness, or IOP. There were significant differences in the VF mean deviation between the groups.
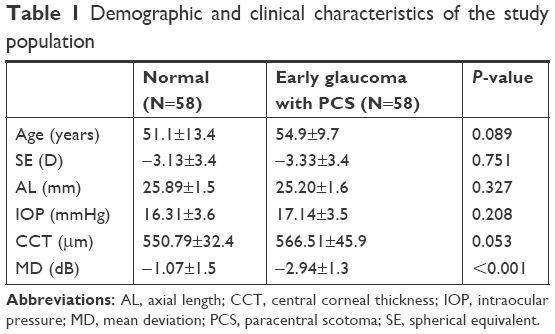 | Table 1 Demographic and clinical characteristics of the study population |
All GCIPL thicknesses and most cpRNFL thicknesses (except at the nasal quadrant) measured with HD-OCT were significantly lower in early glaucoma than in normal eyes (P<0.001; Table 2). PCS eyes had significantly larger disc areas, average C/Ds, vertical C/Ds, and cup volumes and significantly smaller rim areas compared with normal controls. PCS eyes also had significantly greater absolute differences in GCIPLs and asymmetry indices compared with controls. The GCIPL asymmetry ratios were significantly different between glaucomatous eyes with PCS and normal eyes, with the exception of the ST/IN ratio. Table 3 shows the AUROC and pAUROC values for all the thickness parameters and asymmetry parameters. The inferior RNFL thickness had the largest AUROC value (0.934), followed by average RNFL thickness (0.914), minimum GCIPL thickness (0.911), vertical C/D (0.910), IT GCIPL thickness (0.896), and IT/ST asymmetry index (0.894; Figure 2). The macular ganglion cell asymmetry parameters with the largest AUROCs were the IT/ST asymmetry index, the IT/SN asymmetry index (0.867), and the IT–ST GCIPL thickness (0.862). The best individual asymmetry parameters were the IT–ST absolute difference, the IT/SN asymmetry ratio (0.777), and the log10 (IT/ST) asymmetry index. Table 4 shows the P-values for pairwise comparisons of AUROC and pAUROC values between the best measures of each GCIPL asymmetry analysis and the cpRNFL, GCIPL, and ONH parameters that performed best. Based on AUROC values, the diagnostic performance was comparable between the best performing GCIPL asymmetry analyses and the traditional parameters, except for the GCIPL asymmetry ratio. The diagnostic performance was comparable between the best IT/ST asymmetry index and the inferior RNFL thickness (P=0.129), minimal GCIPL thickness (P=0.358), and vertical C/D (P=0.475). Based on the pAUROCs ≥90% and 95% specificities, the diagnostic performance of the best measure of all GCIPL asymmetry analyses was comparable to that of the best of the traditional parameters (all P>0.05).
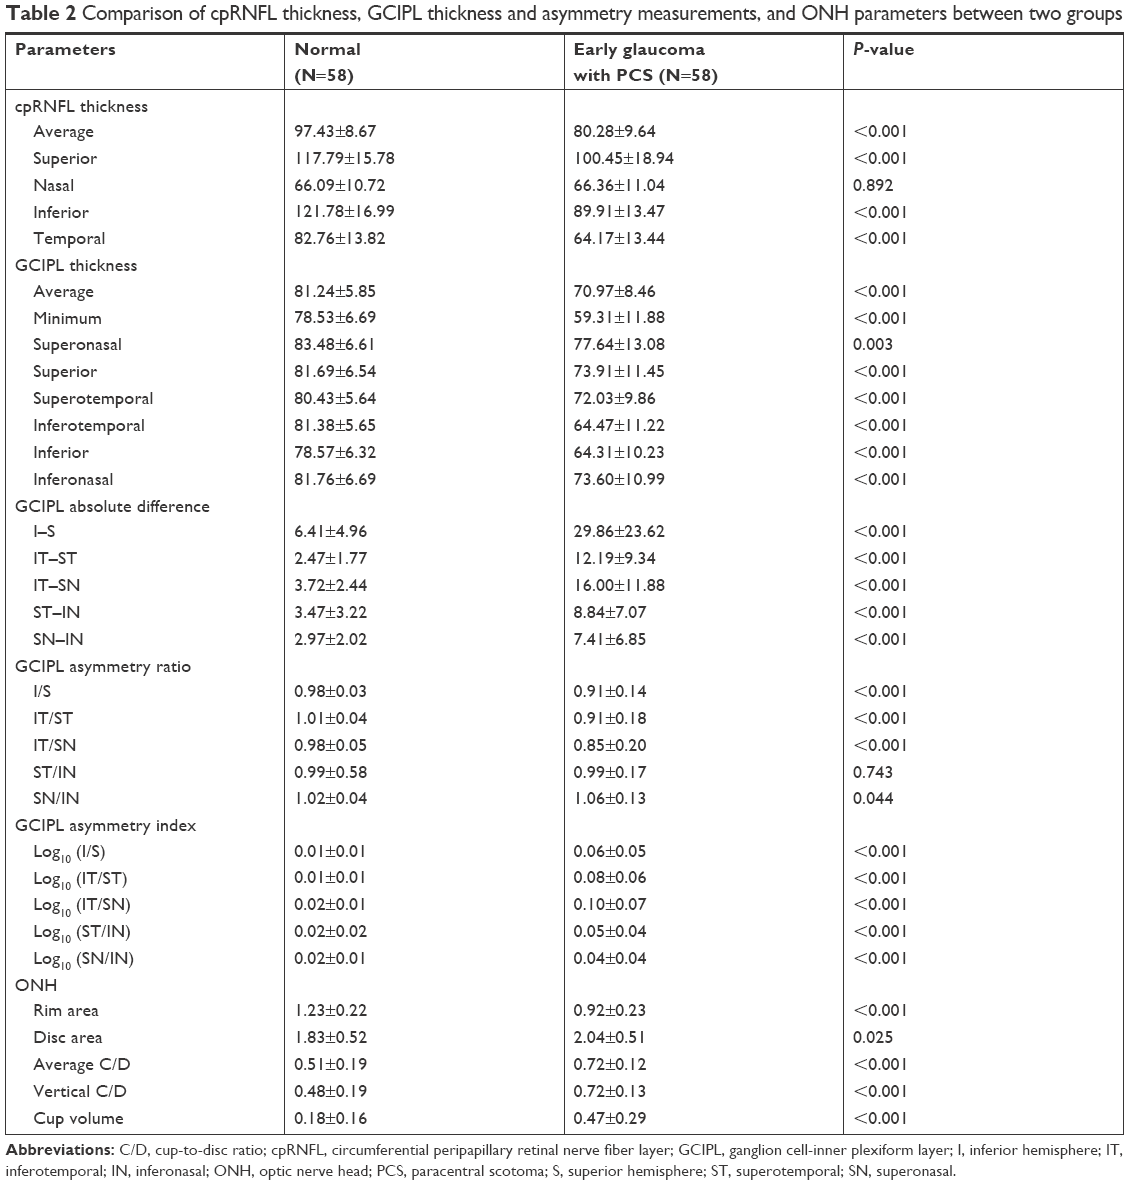 | Table 2 Comparison of cpRNFL thickness, GCIPL thickness and asymmetry measurements, and ONH parameters between two groups |
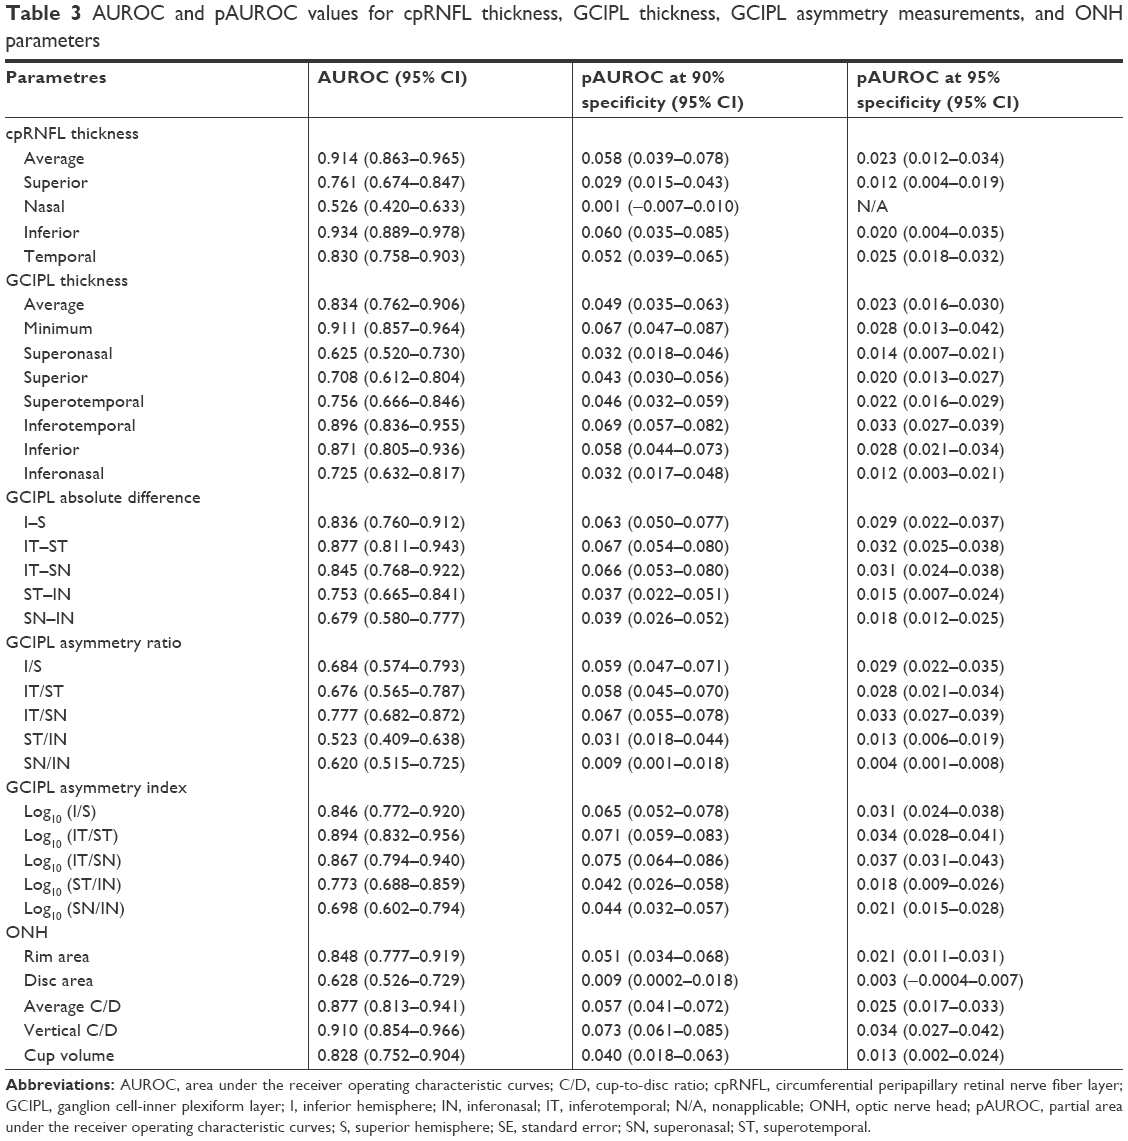 | Table 3 AUROC and pAUROC values for cpRNFL thickness, GCIPL thickness, GCIPL asymmetry measurements, and ONH parameters |
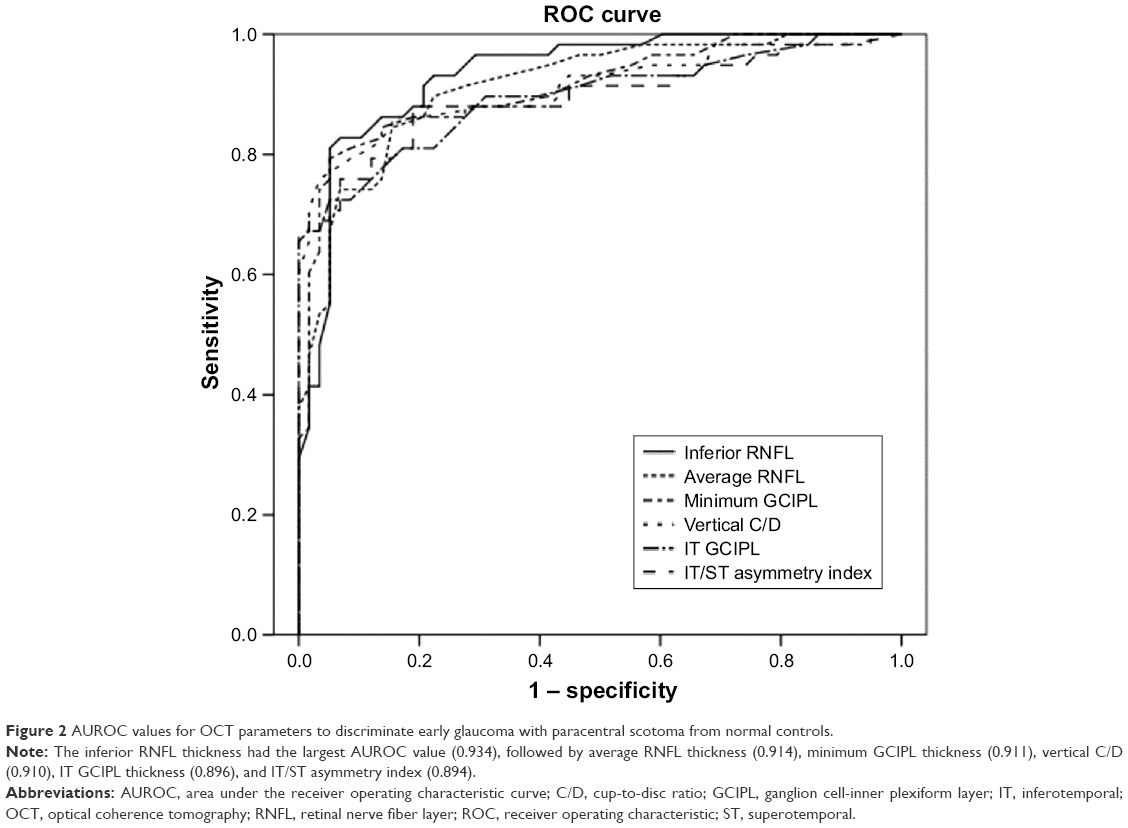 | Figure 2 AUROC values for OCT parameters to discriminate early glaucoma with paracentral scotoma from normal controls. |
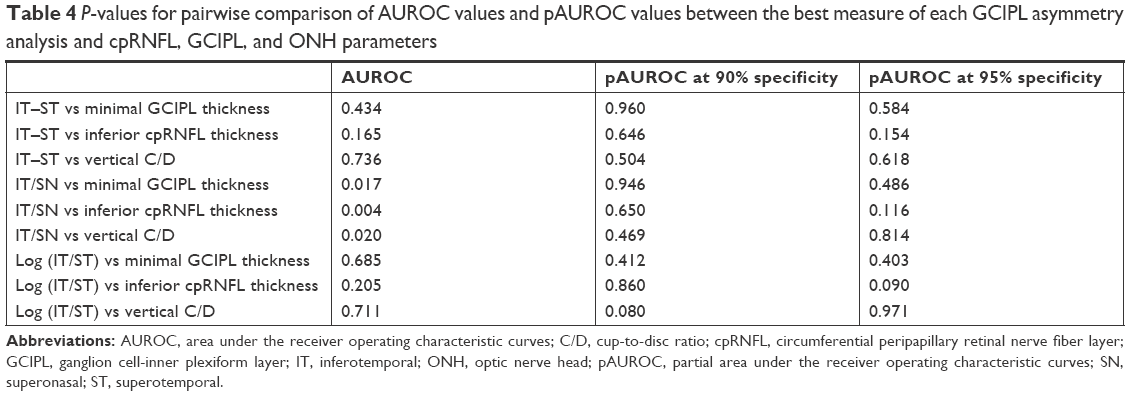 | Table 4 P-values for pairwise comparison of AUROC values and pAUROC values between the best measure of each GCIPL asymmetry analysis and cpRNFL, GCIPL, and ONH parameters |
Discussion
Glaucomatous eyes with PCS are at higher risk of losing central vision compared to eyes with peripheral scotoma. In addition to an automated VF examination, a subjective alternative is necessary for an accurate evaluation of paracentral glaucomatous damage. Measurements of macular structure with OCT may be an effective and time-saving method for detecting the presence of PCS in glaucoma. In the present study, we found that the best discriminating parameters were the inferior RNFL thickness, followed by the average RNFL thickness, minimum GCIPL thickness, vertical C/D, IT GCIPL thickness, and IT/ST asymmetry index, in early glaucoma with PCS. To differentiate early glaucoma from controls, the GCIPL parameters showed diagnostic capabilities similar to those of the RNFL and ONH parameters, consistent with findings from previous studies.3,6,19 With OCT, the RGC damage in the macula is as detectable as the RNFL damage in the classic arcuate regions.20 The diagnostic ability of GCIPL parameters increased significantly, when the RNFL defects were closer to the fovea.21 This feature was more evident in eyes with PCS than in eyes with peripheral scotoma.22 The number of abnormal macular sectors might serve as an effective predictor of central involvement in VF defects in early glaucoma.5 However, given the fact that the OCT data were compared with the built-in normal database, the abnormal, thinned macular area defined on the color-coded significance map might be incorrect (eg, in myopic eyes). It might be more appropriate to compare the sector-based, real thickness values to evaluate the asymmetric GCIPL distribution in early glaucoma.
Glaucoma frequently starts as a localized thinning of the ganglion cell layer. Many studies have demonstrated that asymmetry between superior and inferior macular thicknesses could identify early glaucoma equally or better than the cpRNFL.7–10 Yamada et al23 first proposed an asymmetry index of the log10 (lower hemifield thickness/upper hemifield thickness) and showed good diagnostic performance compared with the full thickness or the inner retinal layer thicknesses, for detecting early glaucoma. Similarly, Hwang et al,24 Sharifipour et al,12 and Park et al25 demonstrated that an asymmetry analysis of macular GCIPL thickness was comparable to the sectoral GCIPL thickness for detecting early glaucoma. However, a localized thinning of the ganglion cell layer might be undetected by averaging the GCIPL thicknesses in the designated hemispheric area and the counterpart area. It may be necessary to compare the real GCIPL thicknesses of each parafoveal sector. In the present study, to detect early RGC loss across the horizontal raphe, we expressed asymmetric GCIPL distributions as the absolute difference, the ratio, and the log10 asymmetry index between six parafoveal sections. Our study showed that most GCIPL asymmetry analyses (except the asymmetry ratio) were comparable in diagnostic ability to the traditional cpRNFL thickness, GCIPL thickness, and ONH parameters. We also found that the IT/ST GCIPL asymmetry index was the best asymmetry parameter for discriminating between early glaucoma with PCS and normal control eyes. Topographically, GCIPL thinning occurred in the inferior and temporal portions of the macula in patients with early glaucoma.26 The IT GCIPL was shown to be the most diagnostically sensitive sector.27 In the macula, histological studies have also shown that the temporal and inferior sectors had fewer ganglion cells than the superior and nasal sectors.28 The IT/ST asymmetric distribution correlated well with a demarcation line at the temporal macula on OCT images. Therefore, the IT/ST asymmetry index might be a valuable parameter for diagnosing glaucoma with PCS.
In the present study, we used the absolute difference, the asymmetry ratio, and the calculated log10 asymmetry index to evaluate the asymmetric GCIPL distribution. Due to the different natures of these asymmetry analyses, the results might be expected to vary among the different methods. Furthermore, the log10 asymmetry index amplifies the relative amount of change, due to the logarithmic transformation, and it previously demonstrated good diagnostic performance for detecting early glaucoma.17,18 With an approach similar to that used in our study, Sharifipour et al12 observed that the simple difference between superior and inferior macular thicknesses showed worse diagnostic performance compared with the asymmetry index for detecting early glaucoma. The log10 asymmetry index appeared to be the best among the various methods of asymmetry explored; thus, it could be considered as a new indicator of early glaucoma with paracentral VF defects.
The present study had several limitations. First, the sample size was relatively small. Second, all study subjects were of Chinese ethnicity, and thus, the results might not be generalizable to patients of other ethnicities. Third, the 10–2 program for VF testing (two degrees between test points) was more appropriate for detecting PCS compared with the 24–2 program (six degrees between test points). However, we chose the 24–2 program, because it was routinely implemented for all patients with glaucoma. Consequently, the glaucomatous eyes that we enrolled might have had relatively high damage in the central/paracentral macula, which may have led to overestimations of the diagnostic abilities of GCIPL parameters. Fourth, comparison should have been made with patients with early glaucoma without PCS and/or early glaucoma with peripheral scotoma only as well. The current conclusions are valid only when compared with healthy eyes, so the results might not be generalizable to all patients with early glaucoma. Fifth, this is a cross-sectional study. A longitudinal study is required to assess the potential role of this index to detect structural changes in diagnosing glaucoma. Finally, we did not conduct the reproducibility test or consider the influence of test–retest variability on the asymmetry analysis. The performance of the HD-OCT software algorithm might have influenced the results. Despite these limitations, our results are relevant to clinical practice, with regard to discriminating between PCS and normal eyes. Compared with previous methods that used exported raw images of the macular GCIPL layers and segmentation with custom software,11,12 our method did not require any special software, and the parameters were readily calculated. Thus, GCIPL asymmetry measurements appeared to be useful for the detection of glaucoma with PCS.
Conclusion
Our results suggested that the log10 asymmetry index was comparable to the cpRNFL, GCIPL, and ONH analyses, for detecting glaucoma with PCS. The IT/ST asymmetry index performed best among all the asymmetry analyses tested. These findings suggest that the IT/ST asymmetry index have promise as an ancillary diagnostic tool and might serve as a new parameter for detecting structural changes in the clinical practice. Further large-scale and longitudinal studies are warranted to evaluate the exact potential of this index in diagnosing glaucomatous damage in eyes with paracentral VF defects.
Disclosure
The authors report no conflicts of interest in this work.
References
Tan O, Chopra V, Lu AT, et al. Detection of macular ganglion cell loss in glaucoma by Fourier-domain optical coherence tomography. Ophthalmology. 2009;116(12):2305–2314.e1–2. | ||
Kotera Y, Hangai M, Hirose F, Mori S, Yoshimura N. Three-dimensional imaging of macular inner structures in glaucoma by using spectral-domain optical coherence tomography. Invest Ophthalmol Vis Sci. 2011;52(3):1412–1421. | ||
Mwanza JC, Durbin MK, Budenz DL, et al. Glaucoma diagnostic accuracy of ganglion cell-inner plexiform layer thickness: comparison with nerve fiber layer and optic nerve head. Ophthalmology. 2012;119(6):1151–1158. | ||
Kimura Y, Hangai M, Matsumoto A, et al. Macular structure parameters as an automated indicator of paracentral scotoma in early glaucoma. Am J Ophthalmol. 2013;156(5):907–917.e1. | ||
Lee J, Hangai M, Kimura Y, Takayama K, Kee C, Yoshimura N. Measurement of macular ganglion cell layer and circumpapillary retinal nerve fiber layer to detect paracentral scotoma in early glaucoma. Graefes Arch Clin Exp Ophthalmol. 2013;251(8):2003–2012. | ||
Hwang YH, Jeong YC, Kim HK, Sohn YH. Macular ganglion cell analysis for early detection of glaucoma. Ophthalmology. 2014;121(8):1508–1515. | ||
Asrani S, Rosdahl JA, Allingham RR. Novel software strategy for glaucoma diagnosis: asymmetry analysis of retinal thickness. Arch Ophthalmol. 2011;129(9):1205–1211. | ||
Seo JH, Kim TW, Weinreb RN, Park KH, Kim SH, Kim DM. Detection of localized retinal nerve fiber layer defects with posterior pole asymmetry analysis of spectral domain optical coherence tomography. Invest Ophthalmol Vis Sci. 2012;53(8):4347–4353. | ||
Um TW, Sung KR, Wollstein G, Yun SC, Na JH, Schuman JS. Asymmetry in hemifield macular thickness as an early indicator of glaucomatous change. Invest Ophthalmol Vis Sci. 2012;53(3):1139–1144. | ||
Sullivan-Mee M, Ruegg CC, Pensyl D, Halverson K, Qualls C. Diagnostic precision of retinal nerve fiber layer and macular thickness asymmetry parameters for identifying early primary open-angle glaucoma. Am J Ophthalmol. 2013;156(3):567–577.e1. | ||
Kim YK, Yoo BW, Kim HC, Park KH. Automated Detection of Hemifield Difference across Horizontal Raphe on Ganglion Cell – Inner Plexiform Layer Thickness Map. Ophthalmology. 2015;122(11):2252–2260. | ||
Sharifipour F, Morales E, Lee JW, et al. Vertical Macular Asymmetry Measures Derived From SD-OCT for Detection of Early Glaucoma. Invest Ophthalmol Vis Sci. 2017;58(10):4310–4317. | ||
Hoyt WF, Frisén L, Newman NM. Fundoscopy of nerve fiber layer defects in glaucoma. Invest Ophthalmol. 1973;12(11):814–829. | ||
Jeoung JW, Kim SH, Park KH, Kim TW, Kim DM. Quantitative assessment of diffuse retinal nerve fiber layer atrophy using optical coherence tomography: diffuse atrophy imaging study. Ophthalmology. 2010;117(10):1946–1952. | ||
Budenz DL. Altas of Visual Fields. Philadelphia, PA: Lippincott-Raven; 1997. | ||
Hodapp E, Parrish RK, Anderson DR. Clinical Decisions in Glaucoma. St. Louis, MO: Mosby-Year Book; 1993. | ||
Cho HK, Lee J, Lee M, Kee C. Initial central scotomas vs peripheral scotomas in normal-tension glaucoma: clinical characteristics and progression rates. Eye (Lond). 2014;28(3):303–311. | ||
DeLong ER, DeLong DM, Clarke-Pearson DL. Comparing the areas under two or more correlated receiver operating characteristic curves: a nonparametric approach. Biometrics. 1988;44(3):837–845. | ||
Begum VU, Addepalli UK, Yadav RK, et al. Ganglion cell-inner plexiform layer thickness of high definition optical coherence tomography in perimetric and preperimetric glaucoma. Invest Ophthalmol Vis Sci. 2014;55(8):4768–4775. | ||
Hood DC, Raza AS, de Moraes CG, Liebmann JM, Ritch R. Glaucomatous damage of the macula. Prog Retin Eye Res. 2013;32:1–21. | ||
Kim MJ, Jeoung JW, Park KH, Choi YJ, Kim DM. Topographic profiles of retinal nerve fiber layer defects affect the diagnostic performance of macular scans in preperimetric glaucoma. Invest Ophthalmol Vis Sci. 2014;55(4):2079–2087. | ||
Shin HY, Park HL, Jung KI, Choi JA, Park CK. Glaucoma diagnostic ability of ganglion cell-inner plexiform layer thickness differs according to the location of visual field loss. Ophthalmology. 2014;121(1):93–99. | ||
Yamada H, Hangai M, Nakano N, et al. Asymmetry analysis of macular inner retinal layers for glaucoma diagnosis. Am J Ophthalmol. 2014;158(6):1318–1329.e3. | ||
Hwang YH, Ahn SI, Ko SJ. Diagnostic ability of macular ganglion cell asymmetry for glaucoma. Clin Exp Ophthalmol. 2015;43(8):720–726. | ||
Park JW, Jung HH, Heo H, Park SW. Validity of the temporal-to-nasal macular ganglion cell-inner plexiform layer thickness ratio as a diagnostic parameter in early glaucoma. Acta Ophthalmol. 2015;93(5):e356–e365. | ||
Hood DC, Raza AS, de Moraes CG, Johnson CA, Liebmann JM, Ritch R. The Nature of Macular Damage in Glaucoma as Revealed by Averaging Optical Coherence Tomography Data. Transl Vis Sci Technol. 2012;1(1):3. | ||
Seol BR, Jeoung JW, Park KH. Glaucoma Detection Ability of Macular Ganglion Cell-Inner Plexiform Layer Thickness in Myopic Preperimetric Glaucoma. Invest Ophthalmol Vis Sci. 2015;56(13):8306–8313. | ||
Curcio CA, Allen KA. Topography of ganglion cells in human retina. J Comp Neurol. 1990;300(1):5–25. |
 © 2018 The Author(s). This work is published and licensed by Dove Medical Press Limited. The
full terms of this license are available at https://www.dovepress.com/terms
and incorporate the Creative Commons Attribution
- Non Commercial (unported, 3.0) License.
By accessing the work you hereby accept the Terms. Non-commercial uses of the work are permitted
without any further permission from Dove Medical Press Limited, provided the work is properly
attributed. For permission for commercial use of this work, please see paragraphs 4.2 and 5 of our Terms.
© 2018 The Author(s). This work is published and licensed by Dove Medical Press Limited. The
full terms of this license are available at https://www.dovepress.com/terms
and incorporate the Creative Commons Attribution
- Non Commercial (unported, 3.0) License.
By accessing the work you hereby accept the Terms. Non-commercial uses of the work are permitted
without any further permission from Dove Medical Press Limited, provided the work is properly
attributed. For permission for commercial use of this work, please see paragraphs 4.2 and 5 of our Terms.