Back to Journals » Therapeutics and Clinical Risk Management » Volume 12
Low-back pain at the emergency department: still not being managed?
Authors Rizzardo A ![]() , Miceli L, Bednarova R, Guadagnin GM, Sbrojavacca R, Della Rocca G
, Miceli L, Bednarova R, Guadagnin GM, Sbrojavacca R, Della Rocca G
Received 6 July 2015
Accepted for publication 24 December 2015
Published 12 February 2016 Volume 2016:12 Pages 183—187
DOI https://doi.org/10.2147/TCRM.S91898
Checked for plagiarism Yes
Review by Single anonymous peer review
Peer reviewer comments 2
Editor who approved publication: Professor Garry Walsh
Alessandro Rizzardo,1 Luca Miceli,1 Rym Bednarova,2 Giovanni Maria Guadagnin,1 Rodolfo Sbrojavacca,3 Giorgio Della Rocca1
1Department of Anesthesia and Intensive Care, Academic Hospital of Udine, University of Udine, Udine, 2Pain Medicine and Palliative Care, Health Company Number 2, Gorizia, 3Emergency Department, Academic Hospital of Udine, Udine, Italy
Background: Low-back pain (LBP) affects about 40% of people at some point in their lives. In the presence of “red flags”, further tests must be done to rule out underlying problems; however, biomedical imaging is currently overused. LBP involves large in-hospital and out-of-hospital economic costs, and it is also the most common musculoskeletal disorder seen in emergency departments (EDs).
Patients and methods: This retrospective observational study enrolled 1,298 patients admitted to the ED, including all International Classification of Diseases 10 diagnosis codes for sciatica, lumbosciatica, and lumbago. We collected patients’ demographic data, medical history, lab workup and imaging performed at the ED, drugs administered at the ED, ED length of stay (LOS), numeric rating scale pain score, admission to ward, and ward LOS data. Thereafter, we performed a cost analysis.
Results: Mean numeric rating scale scores were higher than 7/10. Home medication consisted of no drug consumption in up to 90% of patients. Oxycodone–naloxone was the strong opioid most frequently prescribed for the home. Once at the ED, nonsteroidal anti-inflammatory drugs and opiates were administered to up to 72% and 42% of patients, respectively. Imaging was performed in up to 56% of patients. Mean ED LOS was 4 hours, 14 minutes. A total of 43 patients were admitted to a ward. The expense for each non-ward-admitted patient was approximately €200 in the ED, while the mean expense for ward-admitted patients was €9,500, with a mean LOS of 15 days.
Conclusion: There is not yet a defined therapeutic care process for the patient with LBP with clear criteria for an ED visit. It is to this end that we need a clinical pathway for the prehospital management of LBP syndrome and consequently for an in-hospital time-saving therapeutic approach to the patient.
Keywords: low-back pain, health policies, emergency department, cost analysis
Introduction
Globally, about 40% of people experience low-back pain (LBP) at some point in their lives,1 with estimates reaching 80% in the developed world.2 Approximately 9%–12% of people (632 million) experience back pain at any given moment in time, and almost a quarter of them (23.2%) say they have suffered for about a month.1,3 These aches usually begin between 20 and 40 years of age. LBP is most common among people aged between 40 and 80 years. The total number of people affected is expected to increase with the aging of the population.1,4 LBP can be classified by duration, as acute (pain lasting less than 6 weeks), subacute (6–12 weeks), or chronic (more than 12 weeks). Most cases of LBP do not have a clear cause, but are believed to be the result of musculoskeletal problems, such as sprains or muscle strains.5 In most episodes of LBP, a specific underlying cause is not identified or even sought.6 In chronic patients, of course, or in the presence of a red flag, imaging has a precise role to play. Nevertheless, the use of such investigations in cases of LBP appears to have increased, due to a protective attitude.7 LBP involves large in-hospital and out-of-hospital economic costs. It is one of the most common causes of pain in adults, and is responsible for a large number of lost working days. It is also the most common musculoskeletal disorder seen in emergency departments (EDs).5
Patients and methods
With the approval of the Friuli Venezia Giulia Regional Institutional Review Board, we undertook a retrospective observational study of 1,298 patients admitted to the ED in the Academic Hospital of Udine from January 1, 2013 to December 31, 2013 with clinical signs of LBP, including all International Classification of Diseases 10 discharge diagnosis codes for sciatica, lumbosciatica, and lumbago. With the permission of the Institutional Review Board, the collection of patient data was done in an anonymous manner and without explicit patient consent. We collected data regarding age and sex, comorbidities, numeric rating scale (NRS) at admission, home medication history, lab workup and imaging performed at the ED, drugs administered at the ED, ED length of stay (LOS), NRS at discharge from the ED, admission to ward and ward LOS, outcome at hospital discharge, and mortality rate. Data are expressed as means ± standard deviation, medians, absolute and relative percentages, and frequency. A cost analysis was performed on the basis of Italian National Institute for Statistics data regarding income per capita in the Friuli–Venezia Giulia region and upon regional costs for medical services provided in hospital for both inpatients and outpatients. The cost analysis evaluated patients who were and were not admitted to a ward, and took into consideration lab-workup panels carried out at the ED per single patient, imaging performed (ultrasonography, X-ray, computed tomography scan, magnetic resonance imaging scan), other diagnostic tests done, and medical consultations requested by the ED physician; we added a hospital-admission regional tariff for each patient. This way, we were able to estimate each patient’s medical expense. For ward-admitted patients, we also calculated fixed costs for hospitalization and added the costs of any additional diagnostic tests, lab workup, imaging, or medical consultation during the hospital stay. We could not estimate a per capita expense for drugs administered in the wards or other medical treatments during the LOS.
Results
Among the 1,298 patients, 3.55 patients per day presented at the ED; 51% of patients were male, mean ages were 67.2 years among females and 59.8 years among males; and 746 patients received diagnoses of lumbago, 512 of lumbosciatica, and 31 sciatica. Most patients (n=930) entered the ED with a green triage code, fewer (n=227) with a white code, 71 with a yellow code, and one with a red code. Despite low-grade triage coding, mean admission NRS scores were between 7.7 and 8.4. Patients who were admitted to a ward had admission mean NRS scores higher than 9, with a median score of 9.5. No patients were admitted to a ward due to sciatica, 25 were admitted for lumbago, and 18 for lumbosciatica. Home medication data was scheduled and recorded in fewer than 10% of patients. In the overall population, home drugs recorded were acetaminophen (3.54%), weak opioids (3.39%), strong opioids (2.01%), nonsteroidal anti-inflammatory drugs (4.23%), and Cox-2 inhibitors (0.62%). The most prescribed strong opioid was oxycodone–naloxone (1.39%) (Table 1). Imaging was performed in up to 56% of patients at the ED, consisting of vertebral column standard X-ray (51%) or other skeleton segments or projections (44%), head and vertebral column computed tomography scans (4%), and vertebral column magnetic resonance imaging scans (1%). Once patients were at the ED, nonsteroidal anti-inflammatory drugs and opiates were administered to up to 72% and 42%, respectively. Overall mean ED LOS was 4 hours and 14 minutes, rising to a mean ED LOS of 9 hours and 40 minutes in ward-admitted patients. Among 1,298 patients, 43 were admitted to a ward, 69.7% of these to a medical ward, 14.4% to neurosurgery, 9.3% to oncology, 4.65% to emergency medicine, and 2.32% to neurology. Two patients died during hospitalization, both within 30 days of ED access. No patient was hospitalized due to sciatica alone. Expenses for admitted and nonadmitted lumbago and lumbosciatica patients are reported in Table 1.
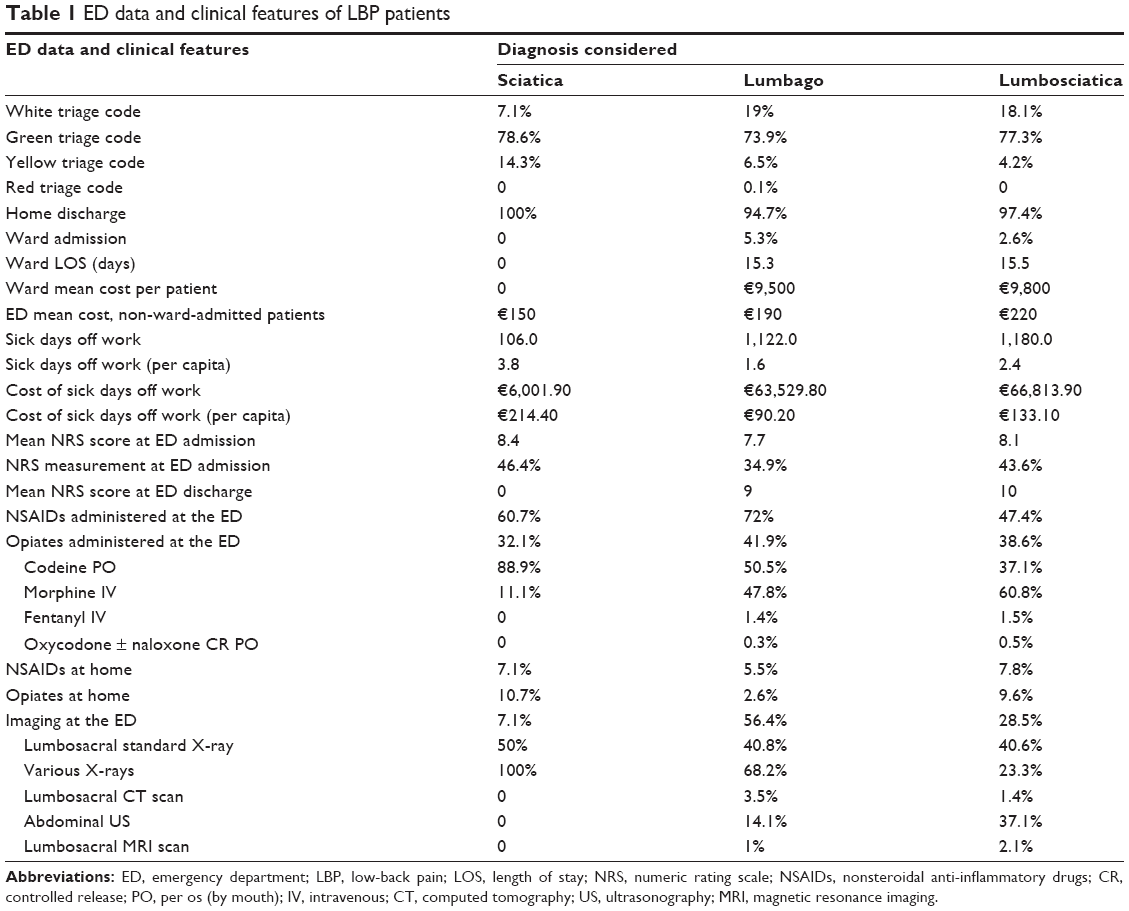 | Table 1 ED data and clinical features of LBP patients |
Non-ward-admitted patients had additional costs, due to sick days off work provided with prognosis at discharge: 721 lumbago patients received a total amount of 1,122 sick days off work, with a mean number of sick days off work of 1.59 days each. This involves an additional cost, calculated over the mean Friuli–Venezia Giulia standardized mean income per capita, of €90.20 per patient. Likewise, 494 non-ward-admitted lumbosciatica patients had additional costs, with a mean number of sick days off work of 2.35 days each. In the same way, the additional cost calculated over mean population income was €133 per non-ward-admitted lumbosciatica patient. Again, we could not estimate a per capita expense for drugs or other medical treatments for nonadmitted patients. In summary, 1,298 patients in the year 2013 cost a total of €806,534 (€621.40/patient), and this estimate must be added to the money refunded by the Regional Government to the Hospital of Udine for each procedure and/or drugs.
Discussion
In our data, we found several hints regarding the management of LBP treatment. First, we found that most of the analyzed population entered the ED on weekdays: this underlines that general practitioners (GPs’) management of LBP is still inadequate, as demonstrated by Crawford et al.8 In fact, less than 11% of patients had home medication for LBP, and a lower percentage consumed any opioids. Strong-opioid therapy was prescribed before ED access in 2.01% of patients. Greater available expenses for GPs’ education and training are needed to empower them to be effective gatekeepers guarding against unnecessary ED access/treatment of patients who have no GP diagnosis or drug prescription at home. Also, we demonstrated that LBP is a serious illness that can cause severe pain, with mean NRS scores up to 9 in the ED. In a study involving 4,839 patients experiencing chronic pain, Breivik et al9 found that 66% had moderate pain (NRS score 5–7), 34% had severe pain (NRS score 8–10), 46% had constant pain, and 54% had intermittent pain. In our opinion, the key data in Breivik et al’s study regarded treatment. They highlighted four important facts: first, that only 2% were currently treated by a pain-management specialist; second, that a third of the chronic pain sufferers were currently not being treated; third, that almost half were taking nonprescription analgesics; and fourth, that two-thirds were taking prescription medicines, which were weak opioids only in 23% of patients and strong opioids only in 5% of patients. The study concluded with the remarkable statement that 40% had inadequate management of their pain. Similarly, we found that in the overall population, home medication consisted of low rates of opiate administration (Table 1). These data are consistent with the findings of White et al.10 When considering the diagnostic side, Chou et al11 showed that lumbar imaging for LBP without indications of serious underlying conditions (ie, red flags) did not improve clinical outcomes. The World Health Organization suggests that drug therapy is the first approach in the management of pain. As yet, however, despite the availability of acute pain services (APSs) in several hospitals to provide this bundle, a solution is not widespread. Rawal12 and Rawal and Berggren13 described a high-cost APS structure consisting of anesthesiologists, residents, specially trained nurses, and pharmacists (costing more than US$200 per patient) and a low-cost nurse-based anesthesiologist-supervised model (costing $3–$4 per patient). Furthermore Stadler et al14 described the cost-utility and -effectiveness of a nurse-based APS in a general hospital, working on a population of 1,975 surgical patients; and the authors concluded that it justified the effort, as it might have reduced complication rates and LOS and had a cost of only €19 per patient per day, but the service must be available 24 hours a day, 7 days a week.
Conclusion
A total of 1,157 of the enrolled patients (89.14%), were white or green triage code, meaning they could and should have been managed by their GP. The keystone of our study is a two-step model for the management of in-hospital and out-of-hospital LBP patients. First, GPs need to be empowered in their management of LBP through specific training programs and technological clinical tools, and second an investment of resources is needed inside the hospital, because LBP patients should not overload the EDs, which are not built to provide such specialist-treatment pathways. An appropriate level of GP knowledge and specific simple care (mainly painkiller prescription) in LBP can reverse patients’ inclinations to seek care from the ED rather than from their GP. Therefore, GP training and patient empowerment (public campaigns, specific web dissemination, brochures in GP clinic) must be carried out together. With regard to prehospital management, this is the purpose behind the creation of the mobile phone application Minosse, available on the App Store, Google Play, and its website (www.minosse.biz). It is free software for GPs that provides a methodology for the classification of the disease and consequently of therapeutic management based on priorities introduced in the algorithm of the software by the general practitioner or by the out-of-hospital specialist who evaluates the patient, and guides the physician in the proper management of the patient.15 Therefore, the spread in utilization of a 24-hour, 7-day APS in the management of LBP is a desirable and cost-effective solution, while prompt treatment and discharge of patients could justify the economic effort and represent a further reduction of costs to society and the Italian National Health Service.
Study limitations
This study was conducted in a single ED center, in a limited time window (1 year), and in an urban area (easy access to ED, high number of clinicians available in hospital). In rural and/or smaller centers, perhaps patient and clinician behavior would be different.
Disclosure
The authors report no conflicts of interest in this work.
References
Hoy D, Bain C, Williams G, et al. A systematic review of the global prevalence of low back pain. Arthritis Rheum. 2012;64(6):2028–2037. | ||
Yao FS, Fontes ML, Malhotra V. Yao and Artusio’s Anesthesiology: Problem-Oriented Patient Management. 7th ed. Philadelphia: Lippincott Williams & Wilkins; 2011. | ||
Vos T, Flaxman AD, Naghavi M, et al. Years lived with disability (YLDs) for 1160 sequelae of 289 diseases and injuries 1990–2010: a systematic analysis for the Global Burden of Disease Study 2010. Lancet. 2012;380(9859):2163–2196. | ||
Casazza BA. Diagnosis and treatment of acute low back pain. Am Fam Physician. 2012;85(4):343–350. | ||
Borczuk P. An evidence-based approach to the evaluation and treatment of low back pain in the emergency department. Emerg Med Pract. 2013;15(7):1–23. | ||
Gilbert FJ, Grant AM, Gillan MG, et al. Low back pain: influence of early MR imaging or CT on treatment and outcome multicenter randomized trial. Radiology. 2004;231(2):343–351. | ||
Miller P, Kendrick D, Bentley E, Fielding K. Cost-effectiveness of lumbar spine radiography in primary care patients with low back pain. Spine. 2002;27(20):2291–2297. | ||
Crawford C, Ryan K, Shipton E. Exploring general practitioner identification and management of psychosocial yellow flags in acute low back pain. N Z Med J. 2007;120(1254):U2536. | ||
Breivik H, Collett B, Ventafridda V, Cohen R, Gallacher D. Survey of chronic pain in Europe: prevalence, impact on daily life, and treatment. Eur J Pain. 2006;10(4):287–333. | ||
White AP, Arnold PM, Norvell DC, Ecker E, Fehlings MG. Pharmacologic management of chronic low back pain: synthesis of the evidence. Spine (Phila Pa 1976). 2011;36(21 Suppl):S131–S143. | ||
Chou R, Fu R, Carrino JA, Deyo RA. Imaging strategies for low-back pain: systematic review and meta-analysis. Lancet. 2009;373(9662):463–472. | ||
Rawal N. 10 Years of acute pain services – achievements and challenges. Reg Anesth Pain Med. 1999;24(1):68–73. | ||
Rawal N, Berggren L. Organization of acute pain services: a low-cost model. Pain. 1994;57(1):117–123. | ||
Stadler M, Schlander M, Braeckman M, Nguyen T, Boogaerts JG. A cost-utility and cost-effectiveness analysis of an acute pain service. J Clin Anesth. 2004;16(3):159–167. | ||
Miceli L, Bednarova R, Sandri M, Rizzardo A, Rocca GD. Use of opioids for pain relief while driving: when the patient meets the police. Pain Pract. 2013;13(4):345. |
 © 2016 The Author(s). This work is published and licensed by Dove Medical Press Limited. The
full terms of this license are available at https://www.dovepress.com/terms
and incorporate the Creative Commons Attribution
- Non Commercial (unported, 3.0) License.
By accessing the work you hereby accept the Terms. Non-commercial uses of the work are permitted
without any further permission from Dove Medical Press Limited, provided the work is properly
attributed. For permission for commercial use of this work, please see paragraphs 4.2 and 5 of our Terms.
© 2016 The Author(s). This work is published and licensed by Dove Medical Press Limited. The
full terms of this license are available at https://www.dovepress.com/terms
and incorporate the Creative Commons Attribution
- Non Commercial (unported, 3.0) License.
By accessing the work you hereby accept the Terms. Non-commercial uses of the work are permitted
without any further permission from Dove Medical Press Limited, provided the work is properly
attributed. For permission for commercial use of this work, please see paragraphs 4.2 and 5 of our Terms.