Back to Journals » Psychology Research and Behavior Management » Volume 8
Longevity expectations in the pension fund, insurance, and employee benefits industries
Authors Zhavoronkov A
Received 6 October 2014
Accepted for publication 10 November 2014
Published 20 January 2015 Volume 2015:8 Pages 27—39
DOI https://doi.org/10.2147/PRBM.S75440
Checked for plagiarism Yes
Review by Single anonymous peer review
Peer reviewer comments 4
Editor who approved publication: Dr Igor Elman
Video abstract presented by Alex Zhavoronkov
Views: 231
Alex Zhavoronkov
Biogerontology Research Foundation, London, United Kingdom
Abstract: Considerable progress has been made in many areas of biomedical science since the 1960s, suggesting likely increases in life expectancy and decreases in morbidity and mortality in the adult population. These changes may pose substantial risks to the pensions and benefits industries. While there is no significant statistical evidence demonstrating rapid decreases in mortality rates, there are conflicting opinions among demographers and biogerontologists on the biological limits of the human lifespan and trends in life expectancy. We administered a survey of the International Employee Benefits Association (IEBA), a large, international industry group. Industry professionals employed by consulting (35%), insurance (24%), pension (14%), and other (27%) companies responded to 32 questions. Respondents showed reasonably conservative views on the future of longevity and retirement, including that for women. The respondents formed their personal longevity expectations based on their family history and, to a lesser degree, on the actuarial life tables. Most of the sample expressed no desire to life past age 100 years, even if the enabling technologies required to maintain a healthy youthful state were available, and only a few respondents in the sample expressed a desire to live for the maximum period (at least) offered by the survey question. The majority of the respondents would not undergo any invasive procedures, and only 56% of the respondents would opt for noninvasive therapies to extend their healthy lifespans to 150 years of age if these were available.
Keywords: life expectancy, gerontology, actuarial, retirement, beliefs
Introduction
Although life expectancies in most developed countries have increased steadily over the course of the 20th century, the gains have been gradual and primarily associated with decreases in child mortality and discoveries of antibiotics.1 Despite the many recent advances in biomedical sciences and information technology, as well as improvements in standards of care for the elderly, there is uncertainty about future trends in life expectancy and disagreement among demographers.2 Most demographers are using stochastic models based on extrapolating historic trends in life expectancy, mortality risks,3 and behavior,4,5 using the Lee–Carter approach and related methods.6 Recent studies include forecasts of incremental increases in life expectancy and decreases in mortality rates,7,8 significant increases in life expectancy,9 and reports suggesting a decline in life expectancy.10 These forecasts appear in prestigious peer-reviewed journals and are often cited in the popular press; consequently, the reports may influence the decisions of pension fund and insurance company managers, policymakers, and actuaries who, in turn, produce forward-looking mortality tables.
Recent views provide grounds for caution.11 And, while it is better to be safe than sorry when it comes to large pension funds and reinsurance companies, stochastic models for developing mortality tables remain popular.10 Some have argued that the maximum lifespan of the human body has already been reached.12 Moreover, given the increasingly widespread adoption of high-calorie diets and sedentary lifestyles leading to obesity, it seems likely that cardiovascular and metabolic diseases may roll back life expectancy.13 On the other hand, progress in science and medicine is likely to yield new technologies that will dramatically extend human lifespans. Some of the common drugs, such as aspirin, metformin, statins, beta-blockers, rapamycin, and many others, have been implicated in extended longevity.14 Certain groups of diabetics taking metformin have longer lifespans than the healthy population.15 Many strategies for the development and validation of drugs with geroprotective properties have been proposed to help maintain homeostasis including drugs that act on specific targets or combinations of molecular pathways16,17 as well as roadmaps for aging-suppressive drug development, rapid screening, validation, and clinical deployment.18 Therapeutic approaches including replacing cells19 and organs, comprehensive strategies for repairing the accumulated damage, using hormetins to activate endogenous repair processes,20,21 modulating the aging processes through specific mutations, gene therapy,22 and small-molecule drugs23 are already reaching the clinic.
Historically, a shortage of expertise, resources, and data led individual pension schemes and insurance companies to outsource the creation of their mortality tables to third parties such as the Continuous Mortality Investigation (CMI) of the Institute and Faculty of Actuaries in the United Kingdom.24 Recently, however, more companies are developing their own forecasting methodologies, albeit with cross-referencing with major industry players.
The investigation of factors affecting clinical judgment has been widely applied in a number of occupations in which skilled clinicians must make predictions about the future under conditions of uncertainty;25 this certainly applies to the study undertaken by those professionals charged with predicting mortality rates. There are no studies evaluating (subjective) expectations of life expectancy among members of the actuarial and employee benefits profession, nor are there studies on the judgment and reasoning processes that might lead such professionals to develop mortality tables on which many individuals and organizations rely.
Longevity expectations may come into play in various ways. For example, longevity expectations may strongly influence retirement behavior;26 retirement expectations likewise influence retirement behavior.27 There is also evidence that the individual longevity expectations are correlated with the actual age of death.28 The person’s health status, well-being, life expectancy in the country of residence, and longevity of the parents are among the factors influencing an individual’s longevity expectations. Parents’ longevity does not strongly influence their children’s mortality, and studies29,30 have found no correlation between the number of parents that a middle-aged person still has alive. Finally, subjective life expectancy, which also depends on parents’ longevity, does not have a large effect on the probability of working at any given time.31 Perhaps in the midst of considering all these factors, the professional’s personal involvements with some of these factors (factors that are, after all, universal, and from which no one may hide) may affect their judgment and decisions.
The goal of this study was to better understand how professionals in the pension fund, insurance, and employee benefits management industries form their personal and collective (as in corporate) longevity expectations; what these expectations are; what factors affect these expectations; and whether biomedical discoveries and predictions by leading gerontologists likewise affect these expectations.
Methods
Survey
To conduct the survey, we contacted a large industry group, the International Employee Benefits Association (IEBA). On behalf of the Biogerontology Research Foundation, a registered UK charity, the executive secretary of IEBA distributed a survey consisting of 27 questions (see Table S1 for a list of the questions and response options) via email to the member base of 1,200 members at the time of the survey, leading to a response rate of 8.66%. Over 45 days, 102 responses were collected and analyzed. Two additional responses that arrived after the 45-day period had closed were not included in the analysis.
The online questionnaire was uploaded to SurveyMonkey.com, an established online survey service. It offers surveys that are easy to navigate and user-friendly. Use of SurveyMonkey has been shown to improve response rates.32 Email contact using a brief survey description informed the participants of the nature and objectives33 of the study, and the participants accessed the survey by following the link. The participants were offered the option to receive the research results upon publication. A survey link was used instead of direct mail, as this has been shown to be an effective way of quickly and easily reaching a wide population of survey participants.32,34 The participants’ names and email addresses were not available to the author of the study, and the survey results were anonymized by the online survey system.
Sample
Of the 102 responses, two were excluded from analysis. One respondent was excluded for providing invented information (claimed both birth in 2000 and widowed status). A second respondent provided no information except birth year and was dropped. Remaining analyses are based on the sample of 100 valid responses. Missing data values were excluded from the frequency counts.
Demographic characteristics
The mean age of the sample was 49.01 years (standard deviation [SD] =10.39 years). Male participants (N=75, or 75%) outnumbered female participants (N=25, or 25%).
The distributions of the sample based on nation of birth and current residence are shown in Table 1. Most respondents lived in Europe, particularly the United Kingdom, Switzerland, Belgium, and Germany. The most interesting finding was a relative outflow of individuals from some countries (eg, the Netherlands, South Africa) and into others (eg, Switzerland, Belgium). This may simply reflect industrial demand in certain industries (eg, life insurance and financial institutions, European Union government positions). However, it may also reflect a degree of calculation among those who think about longevity professionally to relocate to more stable, long-term positions.
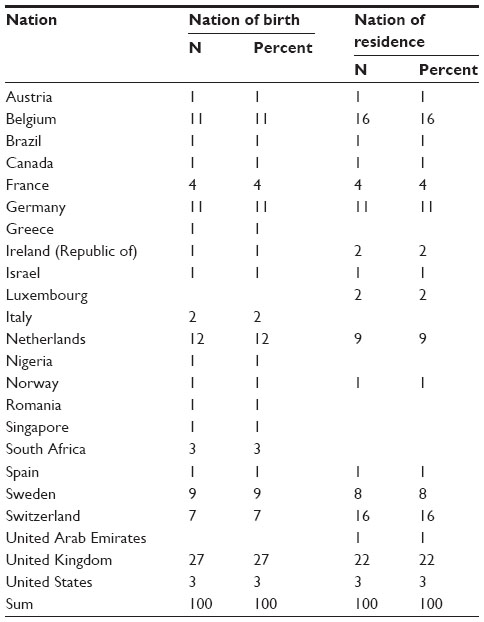 | Table 1 Nations of birth and current residence |
Most (N=72, 72%) members of the sample were married. The remainder were either “single, never married” (N=10), in a “domestic partnership, etc” (N=6), “divorced” (N=5), “single, but cohabiting” (N=5), or selected “prefer not to say” (or simply did not say [N=2]). The mean number of children reported by respondents was 1.70 (SD =1.27). The range was 0 to 5 children. The distribution was bimodal, with the largest modal value for number of children being 2 and the secondary mode being 0.
The most frequently reported degree was a master’s degree (N=59). Other subjects reported having earned a doctorate (N=4), undergraduate degree (N=27), postdoctoral degree (N=1), “no university degree” (N=8), or did not provide a valid response (N=1).
In order of reported frequency, from largest to smallest counts and grouping similar fields together from self-report, the sample reports educational backgrounds in economics (N=41), actuarial science (N=29), law (N=24), arts and social sciences (N=11), languages and linguistics (N=6), and, finally, a range of fields each reporting five or fewer respondents (mathematics, banking, insurance, other business, and other science). Note that respondents could report having more than one educational field.
Employment (type of company)
Most respondents worked for either consulting companies (N=35), insurance companies (N=24), or pension fund providers (N=14). Remaining respondents were distributed across a range of other organizations (industry/manufacturing [N=5]; pharmaceutical [N=3]; nonprofit [N=1]; other [N=12]; and no response [N=6]).
Results
Attitudes, beliefs, life expectations, and hypothetical longevity
Religious identification
Just over one-third of respondents reported either having no religion (N=31), being nondenominational (N=2), or preferred not to say (N=3). The majority of the remainder identified with approaches to Christianity (Protestantism [N=23]; Catholicism [N=20]; Christianity [N=23]). Other religions had smaller counts within the sample (Judaism [N=2]; Buddhism [N=4]; Hinduism [N=2]).
Belief in the afterlife
Table 2 presents the distribution of responses around belief in the afterlife. Most respondents either indicated that they did believe in an afterlife (48%) or failed to affirm a belief in an afterlife (“prefer not to say”, 12%; “do not know”, 8%). Although only 22% believed in a heaven and hell (perhaps surprising, given the relatively larger number of professed Christians in the sample), a full 10% of the sample reported believing in reincarnation, which is 4% more than the sum of the self-reported Buddhists and Hindus in the sample (and there was even some overlap among those cases).
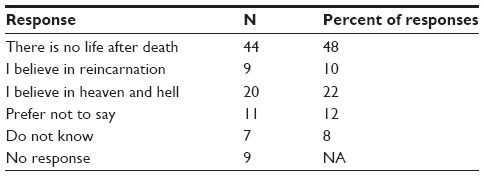 | Table 2 Belief in an afterlife |
Aging as a disease
The vast majority of respondents (88%, N=86) felt that aging was not a disease, but 11% (N=11) did.
Years to live
The sample generally expected a long life and, in some cases, a life much longer than that which is typical today (see Figure 1), although the distribution is bimodal, with the largest part of the sample expecting to live into their early 80s and a couple of respondents well above 100 years. The mean expected personal life expectancy was 87.38 years (SD =10.24 years). The modal value was 85 years, with a broad range, from 55 to 140 years.
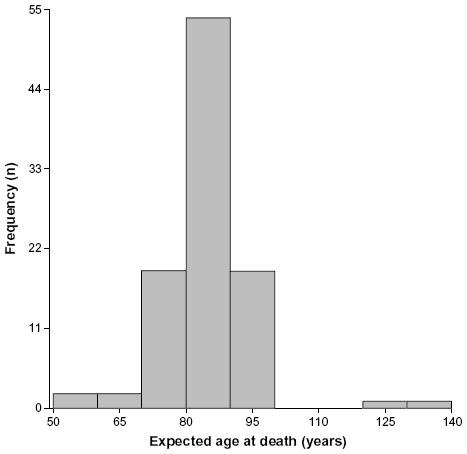 | Figure 1 Expected age of death. |
Years to work
Respondents anticipated a broad range of productive years in their future, with a mean of 22.81 years (SD =12.67 years). This ranged from 5 to 70 years, reflecting the fact that some respondents anticipated living well beyond what is observed in the population today.
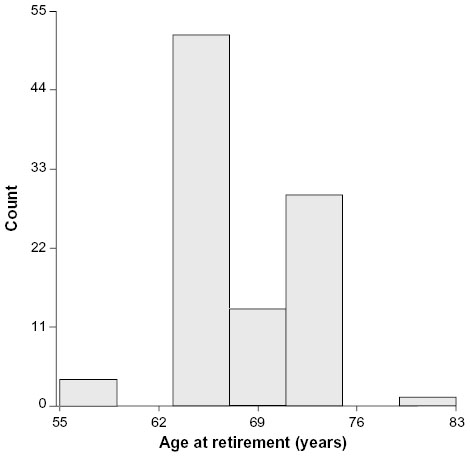
Retirement
Respondents expected a range of retirement ages, with a mean of 65.47 years (SD =5.46 years) and a range from 45 to 80 years. Thus, some anticipated several decades of postretirement life.
Correlations among attitudinal variables
Table 3 shows the Pearson product-moment correlations between several attitudinal variables. The strongest observed relationship (and a positive one) was between the variables the age to which the respondent expected to live and the age by which the respondent expected to retire; in other words, the longer a respondent expected to live, the later they expected to retire (r=0.34, a medium effect size). Positive correlations with small effect sizes (≥0.10 and below 0.30) were observed for several other attitudinal variables, including between the belief that aging is a disease, on the one hand, and the age to which the respondent expected to live, the number of productive years remaining, the age by which the respondent expected to retire, and desire to live longer if technology allowed. In other words, if the respondent sees aging as a disease instead of a natural part of life, they tend to want to live longer. This is a low correlation, and does not account for much of the variance in the variables. Somewhat larger are the relations between how long an individual simply expects to live and other variables, such as productive years remaining, retire by (as previously noted), and desire to live longer if technology allows. There was also a small, positive relationship between productive years remaining and a desire to live longer if technology allows.
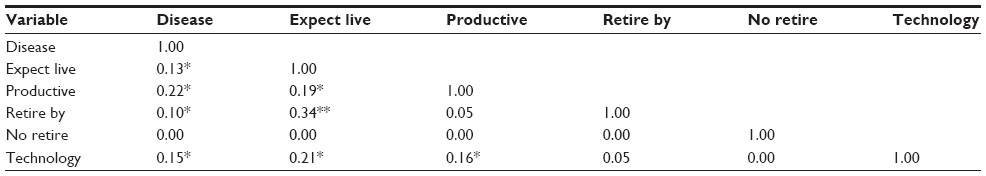 | Table 3 Pearson product-moment correlations among attitudinal variables |
Relations of respondent sex and attitudinal variables
We ran a set of one-way analyses of variance (ANOVAs) to explore the relations between respondent sex and various attitudinal variables related to longevity (see Table 4). Although there was a significant difference between men and women in the sample in the number of their expected productive years left, this result was primarily due to a corresponding mean age difference between women and men of the same level (women =43.48 years; men =50.85 years). Thus, although it is evident in Table 4 that there is a sex difference in terms of expected years until retirement, the anticipated retirement age itself did not differ.
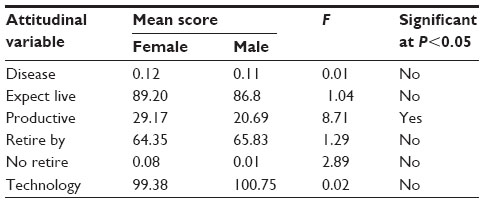 | Table 4 Sex-related differences in attitudes toward the future |
Corporate and personal expectations about longevity
Corporate expectations
Table 5 provides data from questions pertaining to how companies develop their expectations about longevity. It appears that they do so primarily through use of actuarial tables. To a somewhat lesser degree, they rely on analytical reports developed by company staff, and, to a still lesser degree, they rely on simulations involving recent biomedical discoveries.
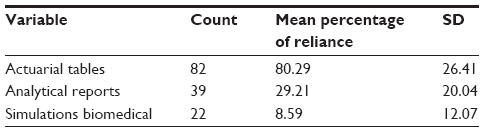 | Table 5 Degree to which companies rely on different variables in developing theories of longevity |
Table 6 shows the counts of reports of how the respondents’ companies adjust their expectations of longevity. The data suggest that the respondents’ companies rely on a range of sources of information in order to question and perhaps change their theories of longevity; no single source of information dominates. Government reports were the most influential of the sources (at 37% of respondents endorsing these as a source), but respondents also pointed to other options, including peer-reviewed publications (28% of respondents), use of analytical reports of an industry association (32%), and internal analytical reports (18%). Interestingly, 29% of respondents indicated that they would not incorporate the possible effects of biomedical discoveries into their estimates.
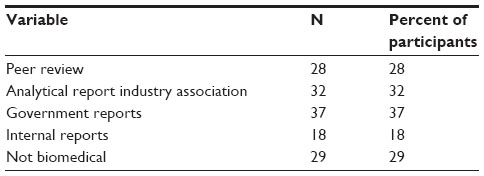 | Table 6 How companies adjust their theories of longevity |
Respondents reported that they sought to influence their companies’ beliefs about longevity through any of several means (see Table 7). In particular, they tended to apply influence through approaches to retirement (52%) and health care policy (42%). Respondent reports of influence were fairly consistent across the remaining categories: government-related lobbying (18%), industrial relations (22%), investment strategy (19%), investment decisions (14%), and other factors (11%).
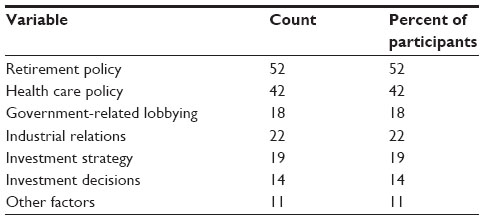 | Table 7 How respondents influence their companies’ theories of longevity |
Personal theories of longevity
The respondents formed their personal theories of longevity based primarily on their family history, although they also consulted other major categories of predictive evidence, including actuarial tables, corporate analytical reports, gerontologists, biomedical research, and other sources (see Table 8). Of interest is that the professional respondents tended to rely on a quite different weighting of factors than did the companies for which they worked when making personal predictions of longevity. In all likelihood, they combined the personal information (on which they relied primarily) with information about specific risk and health factors drawn from research reports (corporate analytical, gerontology, biomedical, or other sources) in tailoring individualized predictions based on complex clinical judgments. Such interaction-level predictors would necessarily be of less value in reference to standard actuarial tables, which are not (or at least have not previously been) based on such complex interaction data. However, this is precisely the direction that big data analytics is taking across a range of fields, and, in all likelihood, the professionals in this study were simply applying to themselves clinical predictive analytics that anticipates what advances in big data analytics will likely apply to the entire business of predicting individual longevity, at least after additional comprehensive family history and behavioral health data become linked to traditional actuarial tables.
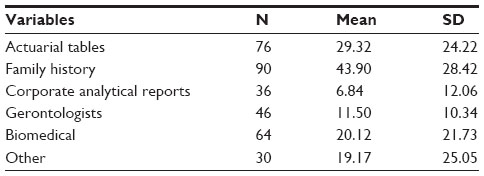 | Table 8 How respondents develop personal theories of longevity |
Asked how strongly news about biomedical discoveries (such as stem cells, gene therapy, or cancer treatment) would affect their longevity expectations, 70% (of those answering the question, N=66) indicated that it would only weakly affect their perceptions, while 30% (again, of those answering the question, N=28) reported that such news would strongly affect their perceptions. We might consider the belief that scientific advances would strongly affect personal theories of longevity to be the result of confidence in a “scientific boost”; that is, scientific advances that could extend or boost longevity.
We examined the possibility that confidence in scientific boost (believing strongly that advances in science would translate into longer lifespans) would be associated with greater belief in aging as a disease, increased personal lifespan, and more years of productive work activity. In each of these cases, although the trends of the data were in the anticipated direction. In no cases did such differences reach statistical significance, and in each case the effect sizes were modest. A portion (20%, N=20) of the sample felt that participating in the survey affected their beliefs about their own life expectancy.
The future of retirement age for women
At what age should women retire?
Respondents predicted, on average, that the retirement age of women now at age 40 years would be 68.47 years (SD =0.58 years), but with a broad range (55 to 80 years). The distribution is highly bimodal (see Figure 2), suggesting that the respondents may perceive two distinct classes of women moving toward retirement: those whose economic resources permit them to exit earlier, typically in their early 60s (or earlier), and those forced by economic requirements to work into their late 60s (or longer). Thus, the predictions about retirement age of women who are now at age 40 years may be more dimensionally complex than this question as written can measure.
 | Figure 2 Expected retirement age (women). |
What should inform decisions about retirement age for women?
Relatively few of the respondents endorsed either of two possible sources for information that might affect decisions regarding retirement age for women. Three respondents (3%) endorsed whatever the government would set as the retirement age for women. This very low percentage of endorsement may suggest that the respondents generally rejected any rationale for setting a retirement age for women that was based only on political expediency and not on scientific data. However, although the respondents did endorse to a greater degree (16%) a statement that the retirement age for women “must be adjusted with the possible impact of biomedical advances in mind”, the level of such endorsement was still rather modest. In fact, it would suggest that the respondents felt that scientific evidence alone might also not provide a complete and satisfactory basis for setting a retirement age for women. The data from the present survey do not provide a basis for anticipating what other sources of evidence might be compelling in regard to establishing a retirement age for women.
Ability of the company to remain solvent with increases in female life expectancy
In response to questions about whether their company would be able to remain solvent if the life expectancy of women increased to various ages, 18 respondents indicated that this would be the case with female life expectancy of 90 years, seven indicated 100 years, and two indicated 120 years or more. However, in response to follow-up questions on related topics, 35 respondents reported that their companies would be able to remain solvent with any life expectancy. Finally, in a third question, 14 respondents suggested that their companies might actually benefit from such increased life expectancies.
What respondents would do to live longer
Acceptable technologies
The respondents differed in their levels of willingness to use various methods that might extend life (see Table 9). A majority – 56% – opted for no invasive procedures. One in approximately four respondents (28%) expressed willingness to use stem cell therapy or injections of drugs that might slow down aging. At least 15% of respondents indicated they would opt for each of the remaining interventions (organ replacement, gene therapy, or blood filtration and enrichment).
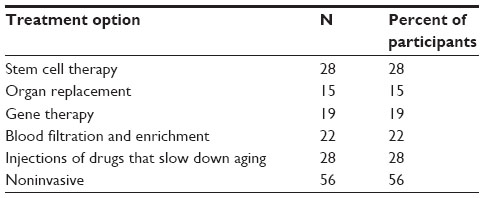 | Table 9 Respondent willingness to engage in therapies to reach 150 years of age |
Desire to live to extreme age
Given access to medical technologies that would enable the individual to maintain good health and a youthful state for as long as they desired, respondents varied greatly in the age to which they would like to live, with a mean of 100.41 years (SD =41.97 years) and a range of 65 to over 200 years. This distribution was highly bimodal (see Figure 3). The fact that the value of desired lifespan given adequate technology was so much higher than the highest age that anyone in the sample expected to reach suggests a lack of confidence either in the development of or their personal access to such technology during their lifetime. It is also interesting to note a strongly bimodal distribution within the sample. Most of the sample expressed no desire to live past age 100 years, even given the technological equivalent of the “fountain of youth”. However, over 10% of the sample expressed a desire to live for the maximum period (at least) offered by the survey question, suggesting that they may simply have desired to live indefinitely far into the future, given access to the enabling technology.
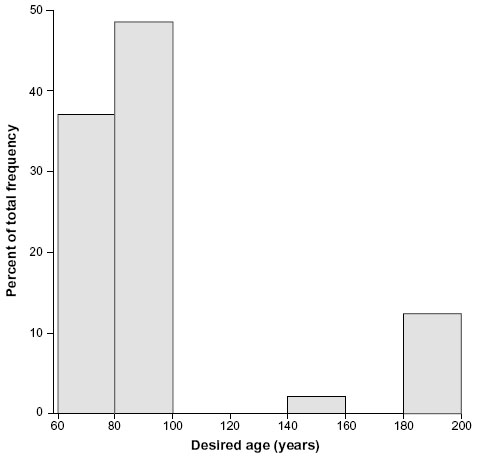 | Figure 3 Age which respondents would desire to reach, given supporting technology. |
Summary of results
Longevity expectations appear to have influenced the respondents’ plans to retire and remain productive. The respondents formed their personal longevity expectations based on their family history and, to a lesser extent, on actuarial life tables. News related to biomedical discoveries affects the personal longevity expectations only weakly and does not significantly affect the life tables used by their respective organizations. Female longevity and life expectancy was used in the survey to limit the number of questions, since females tend to live longer than men and asking questions about female longevity may help ascertain the extremities in longevity expectations. All of the respondents showed a reasonably conservative view on the future of longevity and retirement, estimating the retirement age of women now at age 40 years to be 68.47 years, with a range of 55 to 80 years, implying that female retirement age will not increase significantly over the next 15- to 30-year timeframe. The majority of the respondents did not agree that the retirement age for women should be adjusted with the possible impact of biomedical advances in mind. The majority of the respondents believed that their companies would remain solvent or even benefit from increases in female life expectancy.
Most of the sample expressed no desire to live past age 100 years, even if the enabling technologies required to maintain a healthy youthful state were available, and only a few respondents in the sample expressed a desire to live for the maximum period (at least) offered by the survey question. The majority of the respondents would not undergo any invasive procedures, and only 56% of them would opt for noninvasive therapies to extend their healthy lifespan to 150 years of age, were such measures available.
Discussion
For the pension fund, insurance, and employee benefits industries, stability and conservative approaches make good business sense; their customers are the many millions of families around the world who rely on the prudent and predictable decisions of the managers of these institutions. At its core, a conservative approach to mortality forecasting – the core skill on which these various industries depend – suggests that mortality will remain much the same in the future as it is today. One cannot prove that this conservative approach is wrong, as there is no clear statistical evidence of significant acceleration in life expectancy increases in the near and medium term. However, a rapidly increasing body of scientific knowledge on longevity and associated medical advances suggests that the future may yield such increases.35,36
The results of this study strengthen the argument that the captains of these industries may not use the recent advances in biomedical sciences when forming their personal longevity expectations and engaging in corporate financial planning. Moreover, most of these decision makers do not even appear to show much interest in significantly extending their own longevity should such technologies become available. Considering the recent advances in all areas of biomedical science, the rapid convergence of information technology with biomedicine, and the propagation of these technologies into mainstream clinical and consumer markets, this appears shortsighted, if only from a business perspective. Quite simply, one could lose a lot of money – to the level of affecting the future of the global financial system – by failing to predict these trends correctly. All stakeholders, including pension fund providers, insurance companies, governments, and individuals, may benefit from accelerating biomedical advances and investing in projects that increase productive longevity,37 or at least from taking such research and development work into account when projecting mortality rates into the future.
Limitations of the study and suggestions for research
A major limitation of the study was a relatively small sample of forecasting professionals (N=100). Due to the low sample size and limited granularity, this survey should be considered a pilot for a larger follow-up study.
While it is difficult to obtain access to managers in the insurance, pension fund, pensions, and employee benefits consulting firms, as well as to employee benefits specialists in large corporations, future investigations might increase the size of the sample studied, as well as identify potential segments within the sample based on type of professional experience and educational preparation. In particular, what are the characteristics of the small segment of forecasting professionals who want to live much longer than the current norm? How did they develop those desires, and what do these individuals think about their work and its rationale? Qualitative research methods may aid in understanding the views of such individuals, particularly in that their mindset appears to be discrepant in interesting and perhaps important ways from the norm. One does not know whether to consider such individuals to be prophets or simply aberrant.
Another limitation is the slight discrepancy from demographics of the IEBA. The IEBA’s internal estimates for the distribution of the varying number of its member base (approximately 1,200 members), employers and their pension funds represent 45%; providers of services (insurance or investment) 19%; benefits or investment consulting companies (benefits or investment) 27%; nonprofits 2%; retired members 2%; and 5% cannot be classified. The classification scheme of the survey was different from that of the IEBA, since one of the objectives of the study was to analyze insurance, pensions, and other professionals separately.
We also found rather high variability in answers to some of the questions, including expected age of death and how long individuals would live were they able to have access to new, life-extending methods. We lacked the means to explore the nature of this variability, how it might have arisen (eg, through different types of training or professional development experiences), and what sorts of implications it might hold for the field. Future research might investigate this issue.
Acknowledgments
Hugh Gallagher, Geoffrey Furlonger, Tim Reay, and others from the International Employee Benefits Association (IEBA) provided various types of help, including discussions and sending the survey to the IEBA members. Dr Aubrey de Grey and the UMA Foundation helped with development of the manuscript. Andrew Carson helped with statistical analysis, interpretation, editing, and manuscript preparation.
Disclosure
The author reports no conflicts of interest in this work.
References
Cutler D, Meara E. Changes in the Age Distribution of Mortality over the 20th Century. Working Paper 8556. Cambridge, MA: National Bureau of Economic Research; 2001. | |
Dowd K, Blake D, Cairns AJ. Facing up to uncertain life expectancy: the longevity fan charts. Demography. 2010;47:67–78. | |
Bongaarts J. Trends in causes of death in low-mortality countries: implications for mortality projections. Popul Dev Rev. 2014;40:189–212. | |
Wang YC, McPherson K, Marsh T, Gortmaker SL, Brown M. Health and economic burden of the projected obesity trends in the USA and the UK. Lancet. 2011;378:815–825. | |
Preston SH, Stokes A, Mehta NK, Cao B. Projecting the effect of changes in smoking and obesity on future life expectancy in the United States. Demography. 2014;51:27–49. | |
Booth H, Tickle L. Mortality modelling and forecasting: a review of methods. Annals of Actuarial Science. 2008;3:3–43. | |
Tuljapurkar S, Li N, Boe C. A universal pattern of mortality decline in the G7 countries. Nature. 2000;405:789–792. | |
Mathers CD, Loncar D. Projections of global mortality and burden of disease from 2002 to 2030. PLoS Med. 2006;3:e442. | |
Oeppen J, Vaupel JW. Demography. Broken limits to life expectancy. Science. 2002;296:1029–1031. | |
Olshansky SJ, Passaro DJ, Hershow RC, et al. A potential decline in life expectancy in the United States in the 21st century. N Engl J Med. 2005;352(11):1138–1145. | |
Christensen K, Doblhammer G, Rau R, Vaupel JW. Ageing populations: the challenges ahead. Lancet. 2009;374:1196–1208. | |
Olshansky SJ, Carnes BA, Cassel C. In search of Methuselah: estimating the upper limits to human longevity. Science. 1990;250(4981):634–640. | |
Wyatt SB, Winters KP, Dubbert PM. Overweight and obesity: prevalence, consequences, and causes of a growing public health problem. Am J Med Sci. 2006;331(4):166–174. | |
Zhavoronkov A. The Ageless Generation: How Advances in Biomedicine will Transform the Global Economy. New York, NY: Macmillan; 2013. | |
Holden SE, Currie CJ. Mortality risk with sulphonylureas compared to metformin. Diabetes Obes Metab. 2014;16(10):885–890. | |
Moskalev AA, Shaposhnikov MV. Pharmacological inhibition of phosphoinositide 3 and TOR kinases improves survival of Drosophila melanogaster. Rejuvenation Res. 2010;13:246–247. | |
Zhavoronkov A, Smit-Mcbride Z, Guinan KJ, Litovchenko M, Moskalev A. Potential therapeutic approaches for modulating expression and accumulation of defective lamin A in laminopathies and age-related diseases. J Mol Med (Berl). 2012;90:1361–1389. | |
Zhavoronkov A, Buzdin AA, Garazha AV, Borissov NM, Moskalev AA. Signaling pathway cloud regulation for in silico screening and ranking of the potential geroprotective drugs. Front Genet. 2014;5:49. | |
Rodgerson DO, Harris AG. A comparison of stem cells for therapeutic use. Stem Cell Rev. 2011;7:782–796. | |
Gems D, Partridge L. Stress-response hormesis and aging: “that which does not kill us makes us stronger”. Cell Metab. 2008;7:200–203. | |
Gaman L, Stoian I, Atanasiu V. Can ageing be slowed?: hormetic and redox perspectives. J Med Life. 2011;4:346–351. | |
Bernardes de Jesus B, Vera E, Schneeberger K, et al. Telomerase gene therapy in adult and old mice delays aging and increases longevity without increasing cancer. EMBO Mol Med. 2012;4:691–704. | |
Kennedy BK, Pennypacker, JK. Drugs that modulate aging: the promising yet difficult path ahead. Transl Res. 2014;163(5):456–465. | |
Richards, SJ, Kaufhold K, Rosenbusch S. Creating portfolio-specific mortality tables: a case study. European Actuarial Journal. 2013;3(2):295–319. | |
Garb HN. Studying the Clinician: Judgment Research and Psychological Assessment. Washington, DC: American Psychological Association; 1998. | |
Khan MR, Rutledge MS, Wu AY. Do Longevity Expectations Influence Retirement Plans? [Working Paper WP#2014-1]. Chestnut Hill, MA: Center for Retirement Research at Boston College; 2014. Available from: http://crr.bc.edu/briefs/do-longevity-expectations-influence-retirement-plans/. Accessed August 17, 2014. | |
Benítez-Silva H, Dwyer DS. The rationality of retirement expectations and the role of new information. Rev Econ Stat. 2005;87:587–592. | |
Smith VK, Taylor DH, Sloan FA. Longevity expectations and death: can people predict their own demise? Am Econ Rev. 2001;91:1126–1134. | |
Vandenbroucke JP, Matroos AW, Van der Heide-Wessel C, van der Heide RM. Parental survival, an independent predictor of longevity in middle-aged persons. Am J Epidemiol. 1984;119:742–750. | |
van Doorn C, Kasl SV. Can parental longevity and self-rated life expectancy predict mortality among older persons? Results from an Australian cohort. J Gerontol B Psychol Sci Soc Sci. 1998;53:S28–S34. | |
Bloom DE, Canning D, Moore M, Song Y. The Effect of Subjective Survival Probabilities on Retirement and Wealth in the United States. Working Paper 12688. Cambridge, MA: National Bureau of Economic Research; 2006. | |
Smith CB. Casting the net: surveying an Internet population. J Comput Mediat Commun. 1997;3(1):0. | |
Beauchamp TL, Childress JF. Principles of Biomedical Ethics. 6th ed. Oxford, UK: Oxford University Press; 2008. | |
Hewson C, Yule P, Laurent D, Vogel C. Internet Research Methods: A Practical Guide for the Social and Behavioural Sciences. New Technologies for Social Research Series. London: SAGE Publications; 2003. | |
Zhavoronkov A, Debonneuil E, Mirza N, Artyuhov I. Evaluating the impact of recent advances in biomedical sciences and the possible mortality decreases on the future of health care and Social Security in the United States. Pensions. 2012;17:241–251. | |
Zhavoronkov A, Cantor CR. Methods for structuring scientific knowledge from many areas related to aging research. PLoS One. 2011;6(7):e22597. | |
Zhavoronkov A, Litovchenko M. Biomedical progress rates as new parameters for models of economic growth in developed countries. Int J Environ Res Public Health. 2013;10:5936–5952. |
Supplementary material
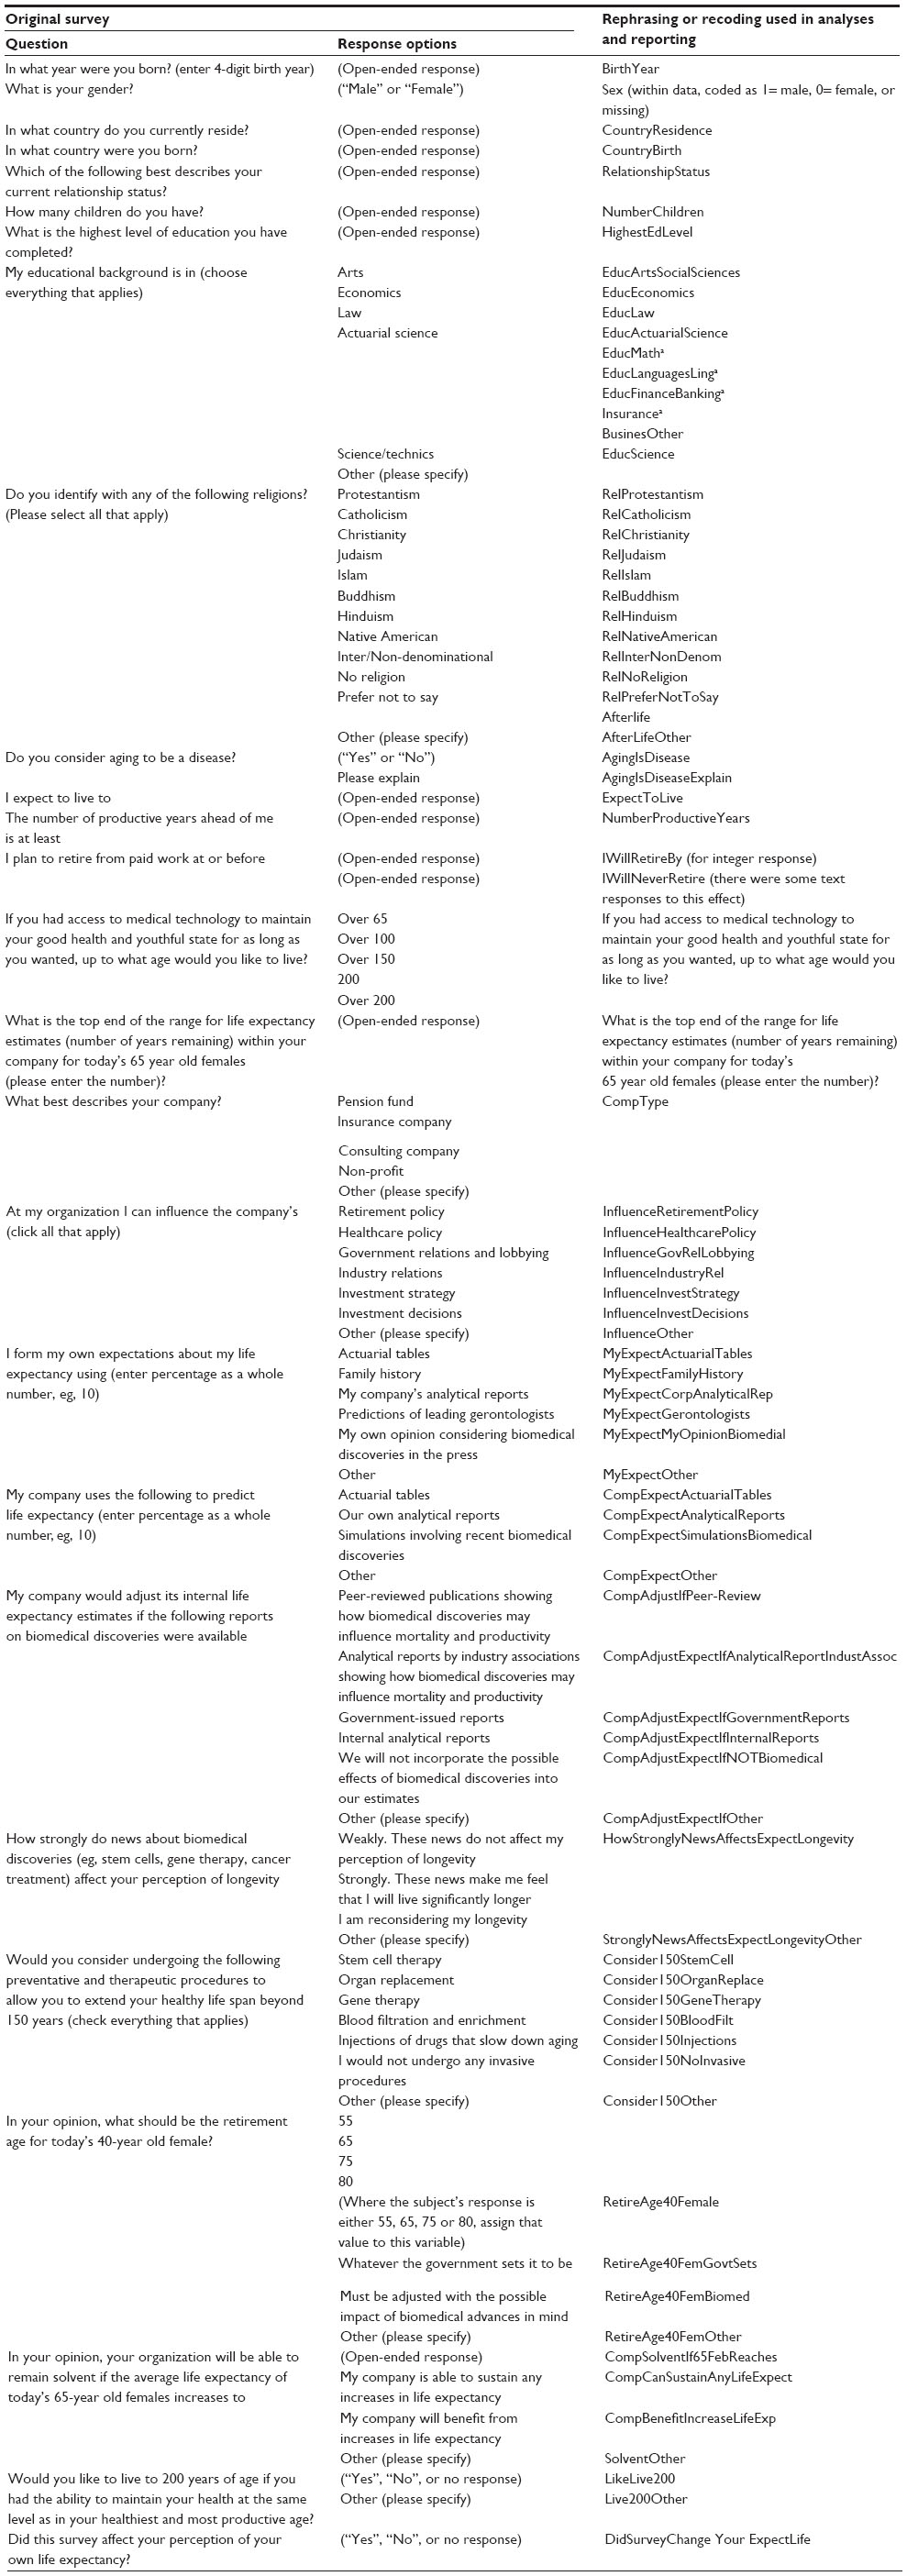 | Table S1 Survey questions and response options |
 © 2015 The Author(s). This work is published by Dove Medical Press Limited, and licensed under a
Creative Commons Attribution License.
The full terms of the License are available at http://creativecommons.org/licenses/by/4.0/.
The license permits unrestricted use, distribution, and reproduction in any medium, provided the
original author and source are credited.
© 2015 The Author(s). This work is published by Dove Medical Press Limited, and licensed under a
Creative Commons Attribution License.
The full terms of the License are available at http://creativecommons.org/licenses/by/4.0/.
The license permits unrestricted use, distribution, and reproduction in any medium, provided the
original author and source are credited.