Back to Journals » Clinical Ophthalmology » Volume 13
Intraocular pressure in patients with human immunodeficiency virus, correlation with TCD4, viral load and demographic characteristics: a case–control study
Authors Cravo LMS, Biancardi AL ![]() , Ronconi TB, Xavier VL
, Ronconi TB, Xavier VL ![]() , Moraes Jr H
, Moraes Jr H
Received 22 May 2019
Accepted for publication 18 June 2019
Published 5 August 2019 Volume 2019:13 Pages 1477—1483
DOI https://doi.org/10.2147/OPTH.S216759
Checked for plagiarism Yes
Review by Single anonymous peer review
Peer reviewer comments 2
Editor who approved publication: Dr Scott Fraser
Leonardo Medlig de Sousa Cravo,1 Ana Luiza Biancardi,2 Thamiles Batista Ronconi,3 Vinicius Layter Xavier,4 Haroldo Moraes Jr5
1Postgraduate Surgical Sciences, Hospital Universitário da Universidade Federal do Rio de Janeiro, Rio de Janeiro, RJ 21941-590, Brazil; 2Uveitis Ophthalmology Department, Hospital Universitário da Universidade Federal do Rio de Janeiro, Rio de Janeiro, RJ 21941-590, Brazil; 3Dermatology, Hospital Universitário da Universidade Federal do Rio de Janeiro, Rio de Janeiro, RJ 21941-590, Brazil; 4Statistics Department, Institute of Mathematics and Statistics, Universidade Estadual do Rio de Janeiro, Rio de Janeiro, RJ 20550-900, Brazil; 5Department of Ophthalmology, Hospital Universitário Da Universidade Federal do Rio de Janeiro, Rio de Janeiro, RJ 21941-590, Brazil
Purpose: To compare if patients with HIV have lower intraocular pressure than patients without HIV.
Methods: The association of intraocular pressure corrected by pachymetry and the relationship with viral load (VL) and TCD4 cells was studied. A total of 99 patients with HIV (91 who were on regular treatment and in control of the disease – group 1; and 8 who were without treatment – group 2) and 100 controls were studied.
Results: Only age was of statistical significance; the group with HIV without control of the disease was the youngest. There was a decrease of −1.54 mmHg in the IOP of group 1 in relation to the controls and −3.63 mmHg in the IOP of group 2 in relation to the controls.
Conclusion: HIV patients had lower IOP than the control population. However, the relationship between IOP, VL and TCD4 was not found.
Keywords: HIV, acquired immunodeficiency syndrome, intraocular pressure, ophthalmopathy
Introduction
HIV infection is a serious immunodeficiency caused by HIV infection, through qualitative and quantitative deficiency of the T helper lymphocytes, which have the CD4+ surface receptor, target of HIV.1 The ophthalmologic changes associated with HIV are related to TCD4+ counts, if the count is <100 cells/mm3, it will allow for retinal diseases such as retinitis and retinal microangiopathy.1
AIDS is pandemic composed of multiple HIV epidemics, each occurring in specific geographic regions and populations. The main (M) group of HIV type 1 viruses is responsible for the majority of AIDS cases and has 9 subtypes (classified with the letters A-D, F-H, J and K) with a complex distribution worldwide. Furthermore, recombinant viruses can appear in regions where different subtypes are prevalent. Subtypes A1, B, C are the most prevalent HIV-1 forms and are associated with >75% of AIDS cases worldwide. In Brazil, the most common subtype is B.2,3
Ocular changes in HIV-infected patients are common, affecting 70–80% of these individuals at some point in the course of the disease,1,4 which reinforces the role of the ophthalmologist in monitoring individuals with the virus.
Several studies have been carried out to determine the incidence and prevalence of ocular manifestations in patients with HIV. The results are varied, and this may be related to methodological and epidemiological differences and the time the study was done, ie, before or after the introduction of antiretroviral therapy (ARVT).4
The most common ocular change in patients is retinal microvasculopathy, others are described as opportunistic infection, neoplasias and neuro-ophthalmological disorders.1,4,5
However, the IOP evaluation of these patients still remains undefined, since it is believed that there is a trend toward lower IOP when compared to the non-HIV population. In 1999, a study raised the hypothesis that the virus is capable of acting in the ciliary body by decreasing the production of aqueous humor.6
Therefore, this study evaluates the differences in IOP between HIV patients and non-HIV patients and among HIV patients, treatment and without treatment groups. The study seeks to understand which clinical and demographic factors contribute to low IOP values, in addition to assessing the amount of TCD4 and VL with IOP fluctuation.
Materials and methods
This is an observational, cross-sectional and comparative study with the participation of HIV patients, followed at the outpatient clinic of infectious parasitic diseases at the University Hospital Clementino Fraga Filho, Federal University of Rio de Janeiro (UFRJ), between October and December of 2017. The study was conducted in accordance with the ethical principles established in the Declaration of Helsinki, after approval by the Research Ethics Committee of UFRJ.
It is important to emphasize that the group with patients with HIV infection and without treatment was composed by patients who had a recent diagnosis and had not started any type of ARVT, abandonment of treatment or refusal to start medication. Antiretroviral medication was not stopped of being supplied to patients..
All participants selected for the study were over 18 years of age, with a previous diagnosis of HIV infection, established through clinical and laboratory criteria by an infectious disease specialist at the UFRJ Hospital. Patients with factors that could alter IOP in significant ways were excluded. These include the diagnosis of glaucoma, active uveitis, retinal detachment, use of antiglaucomatous eye drops, previous surgery on the cornea, recent eye surgery (up to 3 months after), ocular trauma, use of systemic carbonic anhydrase, and antivascular endothelial growth factor injection therapy. All patients had orientation about the research and signed the Informed Consent Term. The same criteria were used for the control group.
The participants were submitted to ophthalmologic investigation in the ophthalmology outpatient clinic of the University Hospital of UFRJ. The anamnesis and the ocular examination followed a protocol form. They were questioned in the interview about the identification, gender, race (described by the patient himself in white, brown, black or other, according to the Brazilian Institute of Geography and Statistics classification), age, previous pathological history, family history of glaucoma, form of contagion, medications in use against HIV and use of eye drops; VL and TCD4 counts closer to the ophthalmologic consultation were noted.
In the ophthalmologic examination, the following questions were evaluated: refraction and visual acuity for 6 m with better optical correction, tear film rupture time (BUT), anterior segment biomicroscopy, Goldmann aplanation tonometry, fundoscopy and corneal pachymetry.
The controls were submitted to the same examinations of patients with the virus, but serologies for HIV were not collected. Those who came as medical assistants at the hospital or patients who were in an outpatient clinic of another specialty who met the inclusion criteria were selected. We used the pairing criterion based on the same age (range of ±2 years), sex and race of the study’s target patients, during the selection.
A recent evaluation of VL and TCD4 count was analyzed only in groups exposed to HIV. Both data were subdivided into three categories for better analysis. Viral load (VL) were categorized into ≤10,000, 10,001 to 100,000, >100,000 HIV/mL ribonucleic acid (RNA). VL ≤10,000 HIV/mL was classified as undetectable.
In relation to TCD4, the values were considered >500 cells/mm3 for controlled disease, between 500 and 300 cells/mm3 intermediate control or <300 cells/mm3 for uncontrolled disease.
Thus, the patients were able to be divided into three final study groups—group 1: patients with HIV in regular treatment with ARVT; group 2: patients with HIV without regular treatment with ARVT; group 3: control patients.
Fisher’s exact test was applied to the qualitative variables. In the quantitative variables, the Student’s t-test was used to evaluate the difference between the mean of two groups, ANOVA was used to evaluate the difference between the mean of more than 2 groups and the Kruskal–Wallis test to assess whether populations have the same distribution.
To evaluate the assumptions of ANOVA, the Bartlett test and the Shapiro–Wilk test of normality were used only in group 3, since it is the group with the lowest number of people. After ANOVA, the Tukey test was used to identify the groups in which the means are different. Similarly, after the Kruskal–Wallis test, the Dunn test was applied to identify which groups have different distributions.
A linear regression model was adjusted using the stepwise variable selection method, with Akaike information criterion (AIC). IOP of the right eye (OD) considered the dependent variable and age, race, sex, CD4 count, VL, group association 1,2 and 3, family history of glaucoma, biomicroscopy, optic, pachymetry, BUT and comorbidities were considered as independent variables.
In the logistic regression model, the stepwise variable selection method with the AIC criterion was also applied considering the same independent variables used in the linear regression model. The dependent variable of this model consists of the standardization of the IOP of OD variable. In this way, the binary variable low pressure was created. This variable assumes the value 1 for IOP values in OD of ≤10 mmHg and assumes the value zero for IOP values in OD >10 mmHg. This same treatment was adopted by Young et al (2017).7 Thus, all patients contributed 1 eye for analysis. In addition, the OR was calculated with the variables selected in the logistic regression model.
All the statistical analysis was performed with program R 3.4.0 and with its MASS libraries [Venables et. Al.], Pgirmess [Giraudoux, Patrick] and dunn.test [Dinno, 2017].
Results
A total of 199 patients were evaluated, which included 100 control patients (group 1), 91 HIV-positive patients who were receiving ARVT (group 2) and 8 patients without HIV treatment (group 3).
The characteristics of the studied population are summarized in Table 1. The sample did not present a statistically significant difference between the participants of the three groups, regarding sex (P=0.962), race (P=0.967), family history of glaucoma (P=0.608), comorbidities (P=0.058) and form of virus acquisition (P=0.801). However, in relation to the age variable, a low P-value (P=0.03) was observed, with the patients in group 3 being the youngest.
 |
Table 1 Characteristics of the study population |
In the evaluation of TCD4 and VL, it was important to note that there was a difference between groups 2 and 3. Both data were statistically significant (P=0.01 in TCD4 and 0.02 in VL) Table 1.
Statistical significance was observed in OD and OS IOP (0.002 and 0.001, respectively). However, it was not observed in OD biomicroscopy, OD BUT, OD optic disc excavation evaluation and OD and OS pachymetry Table 1.
Figure 1 presents the boxplot of the variable IOP OD for the three groups. It is important to note in the analysis of this type of graph the three measures of position: first quartile, median and third quartile. All three measures of position of group 1 present higher values than the measures of position of group 2, which in turn, present higher values than those of group 3.
 |
Figure 1 Boxplot of intraocular pressure (IOP) of right eye (OD) for each group. Notes: The graph shows the IOP (Y) in each group (X). It is shown that group 1 had higher IOP than group 2, which had higher IOP than group 3. Group 1: control group. Group 2: patients with controlled HIV disease. Group 3: patients with uncontrolled HIV disease. |
Figure 2 shows the probability density function of the IOP OD of each group. The mode of group 1 is on the left of the mode of group 2 that in turn is in the left of the mode of group 3. The mode is the most frequent value; thus, it is the highest value in each group density.
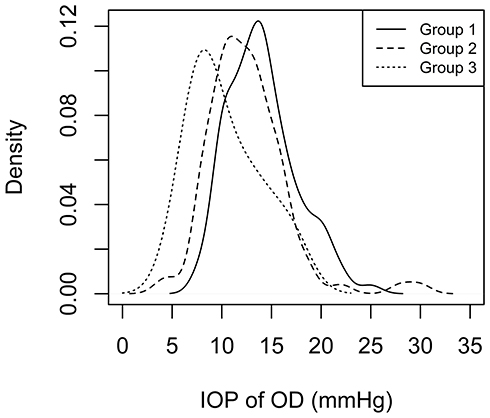 |
Figure 2 Probability density function of the intraocular pressure (IOP) of right eye (OD) variable. Notes: In the graph, the Y coordinate shows the density and the X coordinate shows the IOP. Group 1: control group. Group 2: patients with controlled HIV disease. Group 3: patients with uncontrolled HIV disease. |
As a function of ANOVA, the Barlett test for IOP of OD was used. This test has as null hypothesis the equality of the variance of each group (P=0.368). The normality test was applied for group 3, the group with the lowest number of patients (P=0.3917). ANOVA indicates the existence of the difference between the means of the groups (P=0.00208).
The Tukey test was applied to identify in which groups are the means significantly different (P<0.05). The means of groups 1 and 2 were significantly different, with p-value =0.01485 and groups 1 and 3, with P-value =0.0211947. The same does not occur in the comparison between groups 2 and 3, with p-value =0.2597 Figure 3.
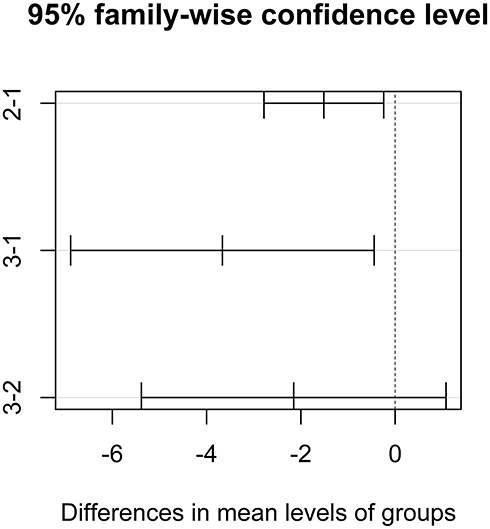 |
Figure 3 Tukey test–95% family-wise confidence level. Notes: The graph shows, for each combination of groups, the value of the difference between the means and their respective 95% CI. The vertical dashed line indicates the point where the difference between the means is equal to zero, that is, the means are equal. It is important to note that in the comparison between groups 1–2 and groups 1–3, the vertical line does not cut the 95% CI. The same does not occur between groups 2 and 3. Group 1: control group. Group 2: patients with controlled HIV disease. Group 3: patients with uncontrolled HIV disease. |
The Kruskal–Wallis nonparametric test indicated that there was a difference between the IOP distributions of the three groups (P=0.000604). Dunn’s multiple-comparison test was used to identify which groups have different distributions. The comparisons that presented differences between in the group distributions (P<0.05) were groups 1 and 2 (P=0.0007) and groups 1 and 3 (P=0.0032), but were not confirmed due to differences between groups 2 and 3 (P=0.0716).
Linear regression was used to evaluate the effect of all variables (virus carrier, gender, age, race, comorbidities, family history of glaucoma, use of eye drops, OD BUT, OD BIO, optic disc excavation and pachymetry of OD), considered here as independent, in relation to IOP which is the dependent variable of OD.
The stepwise method selects the linear regression model presented in Table 2. The model was significant (F-statistic: P=0.0001637), with adjusted R2=0.08372. All variables in the model were significant (P<0.05).
 |
Table 2 Stepwise odds ratio of HIV groups and the relation with optic disc excavation and pachymetry of right eye |
Analogous to the linear regression model, the same independent variables and the same variable selection criterion were used in the logistic regression model. The group carriers of virus controlled was statistically significant (P=0.0379) and (P=0.0138) for patients with the uncontrolled virus). The model also includes the variables optic disc excavation of OD (P=0.1336) and OD Paquimetry (P=0.0972). The value of the Nagelkerke R2 for this model was 0.096.
Table 2 shows the OR and the 95% CI of OR, calculated on the basis of logistic regression. The result confirms that the virus is a risk factor for decreasing IOP, but was not observed in relation to optic disc excavation of OD and OD pachymetry.
Discussion
Few studies have been conducted in an attempt to investigate how IOP works in patients with HIV, and this question remains controversial.
No relevance to demographic data was reported in any other study reviewed,7,8–13 but it was observed in this study that age was a factor with statistical relevance for IOP decrease. It is also added that in the analysis of patients with HIV without treatment was the group with the lowest mean age. It raises a hypothesis of possible carelessness, ignorance, negligence and nonadherence to treatment or sexual intercourse without condoms as justifications for the age of the group.
Recently, IOP was compared in patients with HIV under treatment and without treatment with the control group. The results were promising in knowing that the IOP of HIV patients was lower than the control, and there was a direct relationship with the amount of TCD4 in the patients, where HIV patients were 7 times more likely to have a decrease of IOP and if the TCD4 count was <700 cells/mm3 there is 13 times greater chance of having a reduction in IOP.7 This study obtained the same pattern of patient division. The results obtained were emphatic in describing that patients with HIV had lower IOP than the control group.
Cited by many authors,7,8,10 a direct relationship of IOP with TCD4 in this study was not found, probably because the groups of patients with the virus under treatment were very homogeneous (well controlled of their disease) and the N of patients with the virus without treatment was small.
A cohort compared patients with HIV with and without CMV co-infection.8 The mean IOP was 10.3 mmHg in the group with HIV and CMV and 12.7 mmHg in the group with HIV and without CMV. This data complements the above information, since CMV patients are found to have very low CD4+ and very high CD4 rates.
However, in another analysis, in a case–control study in which patients with HIV were evaluated using ARVT and a control group, no statistical relevance was identified in relation to IOP, TCD4 or VL.9 This information goes against the information obtained so far.
Another study evaluated the dynamics of aqueous humor in patients with and without CMV retinitis.6 They found that HIV was associated with lower water flow rates versus controls independent of CMV status. They concluded that the cause of lower IOP in HIV-infected individuals may be related to decreased aqueous production rather than increased output. The same authors also performed another analysis using PCR-RT to measure HIV VLin plasma and aqueous humor of patients with AIDS and ocular manifestations including CMV retinitis and HIV retinopathy. They observed a decrease in the levels of HIV viruses in the aqueous in these individuals after the initiation of ARVT and the recovery of the CD4+ T group.11
Other studies corroborate that the presence of HIV may lead to reduced IOP. One study highlighted the evaluation of IOP in HIV patients, both with and without cytomegalovirus (CMV) retinitis.12 They compared these populations to a control group without HIV and concluded that patients with HIV had statistically significantly lower IOP than controls, and TCD4 was an important association for this.
The association between medications used in patients with HIV and changes in IOP is also being investigated. Cidofovir is a medication known to cause ocular hypotension. Through a cohort, they showed that IOP reduced after intravitreal injection of cidofovir in an attempt to treat retinal CMV.11 It is believed that this medication acts on the ciliary body, decreasing the production of aqueous humor. Another cohort showed a decrease in IOP in patients receiving cidofovir via parenteral compared to CMV patients without the use of the medication. Previous uveitis was a common finding in patients taking cidofovir.13
In none of the literature articles that investigated the IOP of HIV patients and compared with the control group, without the use of intravitreous medications, the patients’ pachymetry was evaluated. This fact is very important given that it may falsify the IOP. A thicker cornea can simulate a high IOP, just as the opposite is also true. This study compared the pachymetry of all patients and had their values adjusted based on articles with pachymetry documentation expected. An example is the study by Sánchez et al that documents the pachymetry with the value of 544.34 μm.14 A difference of 2.5 mmHg was observed for every 100 μm difference in corneal thickness. In this study, pachymetry was similar in the control and HIV controlled groups and higher in the HIV group without treatment. This difference is basically due to the fact that the number of patients is lower in the group with HIV without treatment.
It is known that IOP is a major factor associated with glaucoma, which is the leading cause of irreversible blindness in the world. Therefore, understanding how the virus behaves intraocular can help in the creation of new medications with the objective of reducing the IOP, besides creating guidelines for the health professional when performing the ophthalmological examination of a patient with the virus.
Therefore, more study is needed to understand how IOP behaves in patients with the virus under treatment and without treatment. Another approach is the relationship of medications to virus control and their potential to decrease IOP.
Abbreviations
AIC, Akaike information criterion; ARVT, antiretroviral therapy; BIO: biomicroscopy; BUT, breakup time; CMV, cytomegalovirus; mmHg, millimeters of mercury; OD, right eye; OS, left eye; RNA: ribonucleic acid; TCD4, T cells with differentiation count 4; UFRJ, Rio de Janeiro Federal University; VL, viral load.
Data statement
To foster transparency, our data are available for analysis.
Acknowlegment
This research did not receive any specific grant from funding agencies in the public, commercial or not-for-profit sectors.
Disclosure
The authors report no conflicts of interest in this work.
References
1. Feroze KB, Wang J. Ocular Manifestations of HIV. In: StatPearls. Treasure Island (FL): StatPearls Publishing; 2017. Available from: http://www.ncbi.nlm.nih.gov/books/NBK441926/. Accessed November 5, 2017.
2. Tebit A, Arts B. Tracking a century of global expansion and evolution of HIV to drive understanding and to combat disease. Lancet Infect Dis. 2011;11:45–56. doi:10.1016/S1473-3099(10)70186-9
3. Librelotto CS, Gräf T, Simon D, et al. HIV-1 epidemiology and circulating subtypes in the countryside of South Brazil. Revista Da Sociedade Brasileira De Medicina Tropical. 2015;48(3):249–257. doi:10.1590/0037-8682-0083-2015
4. Newman H, Gooding C. Viral ocular manifestations: a broad overview. Rev Med Virol. 2013;23(5):281–294. doi:10.1002/rmv.1749
5. Jabs DA. OCULAR MANIFESTATIONS OF HIV INFECTION. Trans Am Ophthalmol Soc. 1995;93:623–683.
6. Banker AS, Arevalo JF, Azen SP, et al. Fluorophotometry in patients with human immunodeficiency virus with and without cytomegalovirus retinitis. Ophthalmology. 1999;106(3):590–593. doi:10.1016/S0161-6420(99)90121-5
7. Young MT, Melvani RT, Khan FA, Braich PS, Bansal S. Association of intraocular pressure with human immunodeficiency virus. Am J Ophthalmol. 2017;176:203–209. doi:10.1016/j.ajo.2017.01.021
8. Kozak I, LaBree L, Azen SP, Cheng L, Reagan NL, Freeman WR. Long-term study of intraocular pressure changes in patients with human immunodeficiency virus treated with highly active antiretroviral therapy. Ophthalmology. 2006;113(3):451–455. doi:10.1016/j.ophtha.2005.10.033
9. Park RJ, Mudumbai RC, Chen PP. Intraocular pressure in patients with human immunodeficiency virus and treated with highly active antiretroviral therapy. Am J Ophthalmol. 2003;136(2):360–361. doi:10.1016/S0002-9394(03)00198-3
10. Kim YS, Sun HJ, Kim TH, Kang KD, Lee SJ. Ocular Manifestations of Acquired Immunodeficiency Syndrome. Korean J Ophthalmol. 2015;29(4):241. doi:10.3341/kjo.2015.29.4.241
11. Banker AS, Arevalo JF, Munguia D, et al. Intraocular pressure and aqueous humor dynamics in patients with AIDS treated with intravitreal cidofovir (HPMPC) for cytomegalovirus retinitis. Am J Ophthalmol. 1997;124(2):168–180. doi:10.1016/S0002-9394(14)70781-0
12. Arevalo JF, Munguia D, Faber D, et al. Correlation between intraocular pressure and CD4+ T-lymphocyte counts in patients with human immunodeficiency virus with and without cytomegalovirus retinitis. Am J Ophthalmol. 1996;122(1):91–96. doi:10.1016/S0002-9394(14)71968-3
13. Akler ME, Johnson DW, Burman WJ, Johnson SC. Anterior uveitis and hypotony after intravenous cidofovir for the treatment of cytomegalovirus retinitis. Ophthalmology. 1998;105(4):651–657. doi:10.1016/S0161-6420(98)94019-2
14. Sánchez-Tocino H, Bringas-Calvo R, Iglesias-Cortiñas D. Correlación entre presión intraocular, paquimetría y queratometría en una población normal. Archivos de la Sociedad Española de Oftalmología. 2007;82(5). doi:10.4321/S0365-66912007000500004
 © 2019 The Author(s). This work is published and licensed by Dove Medical Press Limited. The
full terms of this license are available at https://www.dovepress.com/terms
and incorporate the Creative Commons Attribution
- Non Commercial (unported, 3.0) License.
By accessing the work you hereby accept the Terms. Non-commercial uses of the work are permitted
without any further permission from Dove Medical Press Limited, provided the work is properly
attributed. For permission for commercial use of this work, please see paragraphs 4.2 and 5 of our Terms.
© 2019 The Author(s). This work is published and licensed by Dove Medical Press Limited. The
full terms of this license are available at https://www.dovepress.com/terms
and incorporate the Creative Commons Attribution
- Non Commercial (unported, 3.0) License.
By accessing the work you hereby accept the Terms. Non-commercial uses of the work are permitted
without any further permission from Dove Medical Press Limited, provided the work is properly
attributed. For permission for commercial use of this work, please see paragraphs 4.2 and 5 of our Terms.