Back to Journals » Clinical Ophthalmology » Volume 10
Intersession test—retest variability of conventional and novel parameters using the MP-1 microperimeter
Authors Wong E ![]() , Mackey D, Morgan W, Chen F
, Mackey D, Morgan W, Chen F
Received 8 July 2015
Accepted for publication 15 October 2015
Published 23 December 2015 Volume 2016:10 Pages 29—42
DOI https://doi.org/10.2147/OPTH.S92018
Checked for plagiarism Yes
Review by Single anonymous peer review
Peer reviewer comments 3
Editor who approved publication: Dr Scott Fraser
Evan N Wong,1 David A Mackey,1 William H Morgan,1,2 Fred Kuanfu Chen1,2
1Centre for Ophthalmology and Visual Science, (Lions Eye Institute), The University of Western Australia, Perth, WA, Australia; 2Department of Ophthalmology, Royal Perth Hospital, Perth, WA, Australia
Purpose: To investigate the intersession test–retest variability (TRV) of topography- and threshold-based parameters derived from the Nidek MP-1.
Design: Prospective observational study.
Methods: Sixteen participants with and without central scotoma underwent microperimetry in one eye over three sessions at 1-month intervals in a single institution. We calculated 95% coefficient of repeatability (CR) for the number of normal-suspect (NS) loci, relative scotoma (RS) and dense scotoma (DS), median macular sensitivity (MS), mean sensitivity of responding loci (RLS), perilesional loci (PLS), and extralesional loci (ELS). Topographical agreement score of mapping NS and DS loci (TASNS and TASDS) were also calculated for each patient.
Results: Mean (range) age was 50 (21–86) years. The CR (95% confidence intervals) for NS, RS, and DS were 9.9 (6.5–13.3), 9.5 (6.2–12.7), and 3.0 (1.1–4.1) respectively. CR (95% CIs) for median MS, mean RLS, PLS, and ELS were 3.4 (2.3–4.5), 1.6 (1.1–2.2), 1.8 (0.9–2.6), and 2.8 (1.5–4.0) dB. We found significant change in thresholds between Test 1, and Tests 2 and 3 (both P=0.03), but not between Tests 2 and 3 (P=0.8). Medians (range) TASNS and TASDS were 74% (39%–100%) and 77% (0%–97%), respectively, between Tests 2 and 3.
Conclusion: We recommend the use of four DS loci (upper limit of CR) as the limit of TRV for assessing change. There was large interindividual variability in NS or DS mapping agreement. We recommend discarding the first microperimetry test and caution the use of a change in spatial distribution to determine disease progression.
Keywords: test–retest variability, TASNS, TASDS, Nidek MP-1
Introduction
There is an increasing use of microperimetry in clinical trials. Based on the US National Institutes of Health clinical trials registry, 18 and 40 clinical trials included microperimetry to measure retinal sensitivity between the years of 2001–2010 and 2011–2015, respectively.1 Despite the increasing popularity, there is no consensus on the type of retinal sensitivity parameters that should be used for analysis of treatment response or disease progression. This controversy is partly related to a lack of information on test–retest variability (TRV) of the various types of retinal sensitivity parameters derived from microperimetry.
Microperimetry is an enhanced form of static automated perimetry by virtue of its ability to continuously track fundus landmarks, thus providing reliable measures of retinal sensitivity in the absence of stable or foveal fixation.2 The MP-1 microperimeter is one of four commercially available microperimeters. In most clinical studies, threshold-based parameters such as the mean of overall or regional sensitivities have been used to determine treatment effect and their TRVs have been reported in several studies.3–12 However, it may not be appropriate to use the arithmetic mean to describe overall macular thresholds in conditions where the distribution of sensitivity values in the macula is not Gaussian because of significant number test loci with no response to light. Therefore, in clinical trials of geographic atrophy or macular dystrophy, it may be more meaningful to report topography-based parameters directly related to the size of dense scotoma (DS) (in the area of atrophy) or the number of loci with normal sensitivity (in the unaffected zone). Indeed, several studies have reported individualized topography-based outcomes in the form of total number of or proportion of loci with scotoma, and individualized threshold-based parameters such as the mean sensitivity of test loci outside the DS or in the perilesional and extralesional zones.13–17 To date, the intersession TRV of these topography-based and individualized microperimetry parameters has not been examined in detail.
The purpose of this study was to explore the intersession TRV of topography-based and individualized threshold-based microperimetry measures in subjects with and without scotoma. Short-term intersession TRV of conventional global and pointwise measures using the MP-1 microperimeter are also reported.
Methods
Participants
This study adhered to the tenets of the Declaration of Helsinki and was approved by the Human Research Ethics Committee of the Sir Charles Gairdner Hospital (protocol: 2011-063) and registered with the Therapeutic Goods Administration of the Australian Government (CTN: 263/2012). Written informed consent was obtained from all participants before they were enrolled in the study. Participants were examined by a retinal specialist (FKC) or a glaucoma specialist (WHM) to confirm diagnoses and were recruited from their clinics at the Lions Eye Institute between January 2012 and July 2013. Patients and healthy subjects over the age of 20 years were approached. They were excluded if they were deemed to have an ocular condition that could potentially progress or regress within the duration of the study (2 months), if they had significant media opacity, prior experience with microperimetry, or if they were unable to give informed consent. Participants with prior experience of performing non-fundus-controlled visual field tests were not excluded. Normal subjects were recruited from relatives or friends of participants, or staff at the eye clinic. The participants were recruited as part of a larger study involving two microperimeters – the MP-1 (Nidek Technologies Srl, Padua, Italy) and the CenterVue MAIA (CenterVue, Padua, Italy). We only present the results using the 10-2 grid from the MP-1 (Nidek Technologies Srl) microperimeter here.
Examination protocol
Participants were seen at three separate visits (Tests 1, 2, and 3), with a 1-month interval in-between these visits. At the baseline visit (Test 1), one eye was randomly chosen to be the study eye using a random number generator (random.org) if both eyes were eligible for the study. All participants underwent a visual acuity assessment using the Early Treatment Diabetic Retinopathy Study chart (Lighthouse International, New York, NY, USA). Prior to any slit-lamp examination or imaging of the retina, the study eye was tested on both MAIA (CenterVue) and MP-1 (Nidek Technologies Srl) microperimeters consecutively in a randomized order, assigned by the random number generator. The microperimetry testing order for each participant was generated prior to recruitment. Microperimetry was performed in a dark room according to the protocol detailed in the “Microperimetry examination” section. If small pupil precluded fundus tracking by the MP-1 (Nidek Technologies Srl) microperimeter during the first visit, phenylephrine 2.5% was applied to the eye and the test reattempted after 5 minutes. A participant requiring pupil dilation at the first visit was also dilated for the subsequent two study visits. Following completion of microperimetry, all participants underwent spectral-domain optical coherence tomography (SD-OCT) at each visit using the Spectralis HRA + OCT device (Heidelberg Engineering, Heidelberg, Germany) to acquire an en-face infrared reflectance image, macular cube volume scans, and optic disc nerve fiber layer circular scans. SD-OCT scans were examined to ensure no progression of disease state had occurred during the three study visits.
Microperimetry examination
Microperimetry was performed using the Nidek MP-1 (Nidek Technologies SrL) and the CenterVue MAIA (CenterVue) in a randomized order. Participants were given identical instructions on how to perform the assessment at each visit. Although there was no practice test prior to the first session, patients were shown the response trigger and given the opportunity to familiarize with the finger pressure required to trigger a response. Microperimetry was performed in a dedicated, quiet psychophysics dark room, and the lights were turned off after the nonstudy eye was patched and the patient comfortably positioned at the device with chin on the chin rest and finger ready to press the response trigger.
For the MP-1 examination, the fixation target was the standard 2° diameter red cross set against a dim white background with a luminance level of 1.27 cd/m2; the maximum stimulus intensity was 126.4 cd/m2 producing a dynamic range of 0–20 dB; stimulus size was Goldmann III; duration was 200 ms; and testing protocol was 4-2 threshold strategy. At the first test, the starting stimulus luminance was manually preset as 16 dB from which the 4-2 strategy would commence. At subsequent follow-up tests (Tests 2 and 3), however, the starting stimulus luminance was variable, corresponding to the threshold determined at the first test. The standard 10-2 grid was used, which consisted of 68 test loci arranged in a Cartesian pattern covering the central 20°.
The MP-1 (Nidek Technologies Srl) microperimeter has a built-in software function that allows follow-up tests to be registered to the baseline (reference) test to enable accurate reassessment of retinal sensitivity at the same test loci examined during the baseline test. The MP-1 (Nidek Technologies Srl) requires manual selection of two retinal landmarks or regions of interest based on the infrared image acquired prior to microperimetry test. In our study, Tests 2 and 3 were performed using the follow-up protocol to allow identical test loci to be examined across all three study visits. It is important to note that the starting luminance for test loci for both Tests 2 and 3 are identical as they were based on the same reference examination (Test 1).
Microperimetry parameters
A unique code (loci 01-68) was assigned to each one of the 68 test loci in the right and left study eyes so that pairs of corresponding test loci between the two eyes have the same code to enable direct comparison.
Retinal sensitivity values ranged from −1 to 20 dB. An arbitrary value of −1 dB was assigned to any locus where the subject did not respond to the brightest stimulus. The MP-1 (Nidek Technologies Srl) records a value of 0 dB for test locus where the subject was only able to respond to the brightest stimulus. At each locus, the retinal sensitivity is also classified into one of four categories – “normal threshold”, “suspect threshold”, “relative scotoma” (RS), and “absolute scotoma” by the MP-1 software (NAVIS version 3.6.8, Nidek Technologies Srl). This local defect classification (LDC) is provided in the “local defect map” analysis in which all loci falling within the central 20° are compared to normative data set derived from healthy eyes.
We allocated a new category, “normal-suspect” (NS), to those loci with either “normal threshold” or “suspect threshold” because both of these categories are within the 95% confidence interval (CI) of threshold values found in normal population. Those loci with values below the 95% CI were designated as “RS”. It is important to note that the cutoff sensitivity value varies with retinal location (based on the MP-1 normative dataset). If the brightest possible stimulus is not responded to, the locus is designated an “absolute scotoma”. We considered the term “DS” more appropriate because patients may have responded to the stimulus if it was even brighter.
Microperimetry analysis was performed in three ways:
- Pooled-cohort analysis
Cohort-based analysis involved pooling data from all subjects.- Total number and proportion change of NS, RS, and DS loci (assigned by NAVIS software) between visits from the entire cohort. Results from individual patients were also reported.
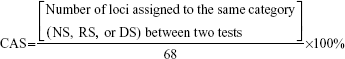
- Category agreement score (CAS) calculated for whole cohort, according to the following formula. CASs for each subject were also reported.
- 95% Coefficient of repeatability (CR) for pooled pointwise sensitivity (PWS). A CR was calculated for each of the 68 loci by aggregating all subjects’ data for each of the 68 loci. CR was derived according to the method by Bland and Altman18 and is described under the “Statistical methods” section.
- Topography-based analysis
Topography-based analysis was based on Traquair’s analogy of visual field in which regions of retina with measureable sensitivity were “hills” of vision, and areas of DS were “lakes” of blindness.- CR for the number of NS, RS, and DS loci across study visits.
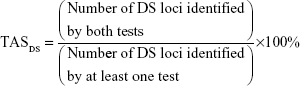
- Topographical agreement score for dense scotomatous loci (TASDS) for each subject across three pairs of test comparisons.20 This is a measure of the consistency in which MP-1 (Nidek Technologies Srl) can map regions of DS or NS at the identical loci across pairs of examination (Test 1–2, Test 1–3, and Test 2–3). While the number of loci with a certain category provides information about the size of “functional scotoma”,17 TAS provides additional spatial information.
- Topographical agreement score for normal-suspect loci (TASNS), similar to TASDS.
- Threshold-based analysis
- CR for the overall mean of macular sensitivity
 was calculated for each examination.
 - CR for median of macular sensitivity
 . Although CR for has been used extensively for microperimetry analysis, it has a major limitation in clinical use because the distribution of sensitivity values across the 68 test loci in the macula is not always Gaussian.3,4,6–11,20 Therefore, we also calculated the CR for
  .
. - Individualized mean of retinal thresholds in loci with measureable sensitivity (responding loci sensitivity;
 , mean of sensitivity within the perilesional loci
  and mean of sensitivity within the extralesional loci
  ) as proposed by Chen et al13 and Meleth et al17 has been used to determine disease progression. Perilesional loci are defined as any locus with a recorded sensitivity value (0–20 dB) adjacent to a DS locus, and extralesional loci refers all remaining loci that are not classified as DS or perilesional. Variance in the individualized ,
  , and , were calculated to derive CR.
- CR for the overall mean of macular sensitivity
Statistical methods
Demographic variables were reported in proportions, means, and medians. Agreements and variabilities in pointwise defect classification and retinal thresholds were analyzed for each subject and across all study subjects.
Contingency tables were created for each pair of examinations (Test 1–2, Test 1–3, and Test 2–3) for each subject and the entire cohort to examine intervisit agreement in LDC across 68 loci. Unweighted κ coefficients were calculated for each pair of comparison in LDC in each patient and the entire cohort. Proportion of all loci with perfect agreement in LDC (CAS) was calculated for each pair of tests of each subject and the entire cohort. Symmetry of distribution was investigated by using the binomial probability test (two-sided) against the null hypothesis of equal proportion of test loci with improvement and those with decline in LDC. Differences in PWS between pairs of examinations were calculated for Test 1–2, Test 2–3, and Test 1–3. Binomial probability test was also used to detect asymmetry. Variance in PWS across study visits for each of the 68 loci was calculated to derive CR for PWS for each of 68 test loci.
For topography-based and threshold-based analyses, Friedman’s analysis of variance (ANOVA) and Wilcoxon signed-rank tests were performed to determine if there was a statistically significant change in retinal sensitivity across all three study visits. Intersession CR were calculated based on the formula as recommended by Bland and Altman:18
|
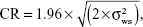
where  is mean within subject variance. 95% Confidence intervals were calculated for the CR based on the formula:
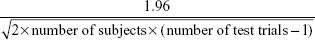
95% CI of CR = CR ± CR × (standard error), |
where standard error =
|
We used Bland–Altman plots to assess test–retest characteristics for CR.21 All statistical analyses were performed on the commercially available Statistical Package for Social Sciences (SPSS, software version 21, IBM Corporation, New York, NY, USA).
Results
A total of 16 participants (eight male, eight female) with mean age (range) of 50 (21–86) years were included in the study. Participants had a range of ophthalmic conditions (Table 1), including five normal subjects, five with optic neuropathy (glaucoma), and six with retinopathy. None of the subjects were pseudophakic. None of the study subjects had disease progression based on clinical examination and review of SD-OCT macular cube and nerve fiber layer scans during the study. Median (range) intervals between both Tests 1 and 2, and Tests 2 and 3 were 30 (21–56) days and 29 (21–35) days, respectively. Median (range) visual acuities across the three study visits were 0.02 (1.50 to −0.16), −0.02 (1.30 to −0.18), and −0.02 (1.32 to −0.20) logMAR, respectively (Snellen equivalent: 20/20 [7/20 to 20/16], 20/20 [10/20 to 20/12.5], and 20/20 [10/20 to 20/12.5], respectively). Of the 16 participants, only one required dilating drops to enable fundus tracking by the MP-1. The median (range) duration for each microperimetry examination was 10 minutes 13 seconds (3 minutes 08 seconds −22 minutes 30 seconds), 9 minutes 14 seconds (4 minutes 00 seconds −13 minutes 39 seconds), and 10 minutes 36 seconds (3 minutes 40 seconds −13 minutes 42 seconds) for the three study visits, respectively (P=0.779, Friedman’s ANOVA). Bivariate contour ellipse areas (BCEA) of the fixation loci were not normally distributed. Median BCEA encompassing 68.2%, 95.4%, and 99.6% of fixation points were 0.20, 0.60, and 1.05 degree2 at Test 3. There was no statistically significant difference in the BCEA over the three visits (Friedman’s test, P=0.944, P=0.984, P=0.984, respectively, for each of the three sizes of BCEA).
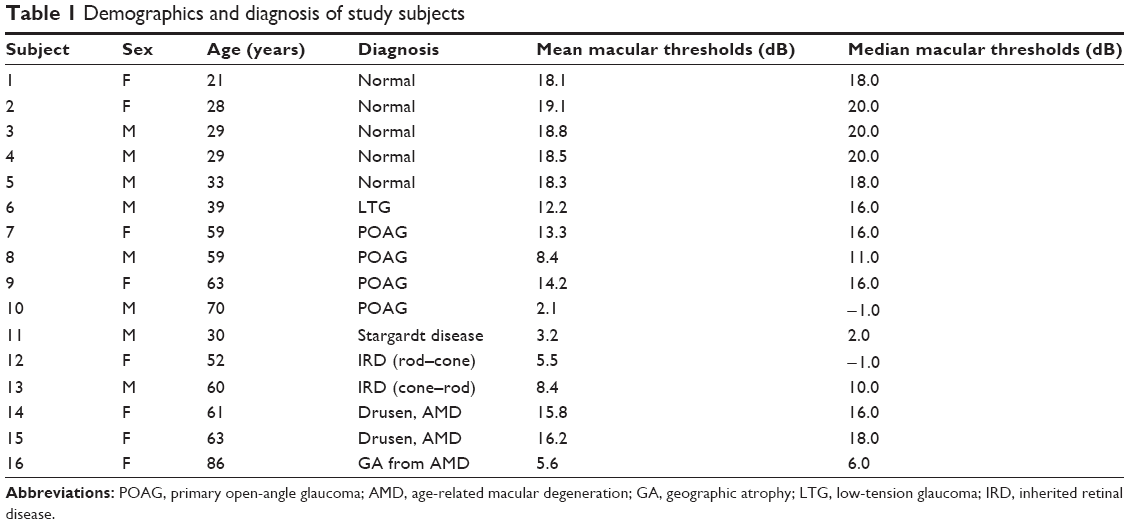 | Table 1 Demographics and diagnosis of study subjects |
Pooled-cohort analysis
Out of the possible 3,264 retinal threshold measurements from either the left or the right eyes of 16 subjects over three microperimetry sessions, dataset from 12 loci were excluded due to lack of LDC or retinal sensitivity value in any of the three visits, leaving 3,252 loci (1,084 loci per visit) for further analysis.
The total number (proportion) of loci classified as NS, RS, and DS were 625 (58%), 279 (26%), and 180 (16%), respectively, at the first examination (Table 2). There was moderate agreement in LDC between Tests 1 and 2 (κ =0.62), Tests 1 and 3 (κ =0.67), and Tests 2 and 3 (κ =0.68) (Table 3). However, the range of κ values for each subject varied from slight (κ =0.08, Subject 1) to almost perfect (κ =0.93, Subject 13) due to skewed distribution in LDC in certain subjects. The overall mean CAS between pairs of examinations across all subjects was 77%, 80%, and 80% between Tests 1–2, 1–3, and 2–3, respectively. The median (range) CAS were 77.9% (41.2%–100.0%), 82.1% (47.1%–97.1%), and 83.8% (41.2%–95.6%) between Tests 1–2, 1–3, and 2–3, respectively (Table 3). Figure 1 outlines the proportion of loci that remained stable, improved, or declined between each visit.
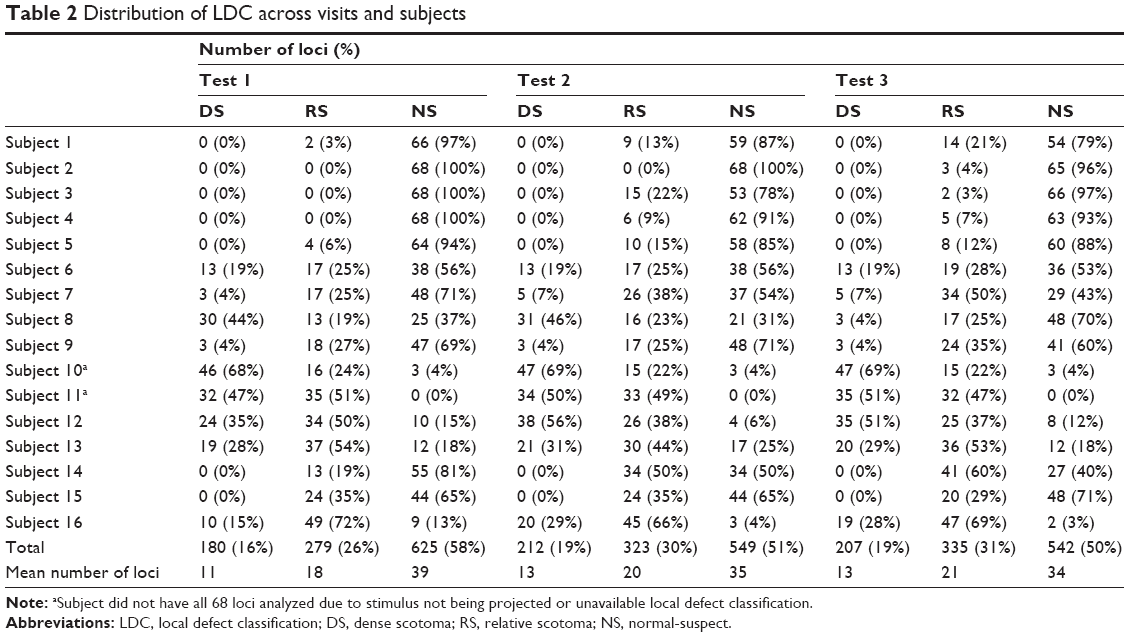 | Table 2 Distribution of LDC across visits and subjects |
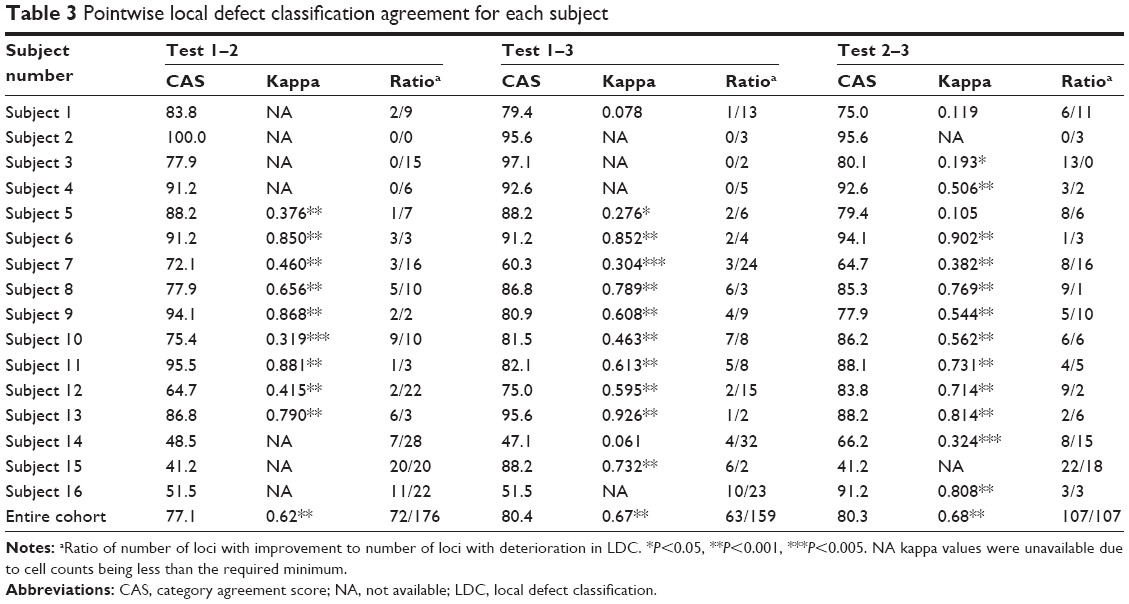 | Table 3 Pointwise local defect classification agreement for each subject |
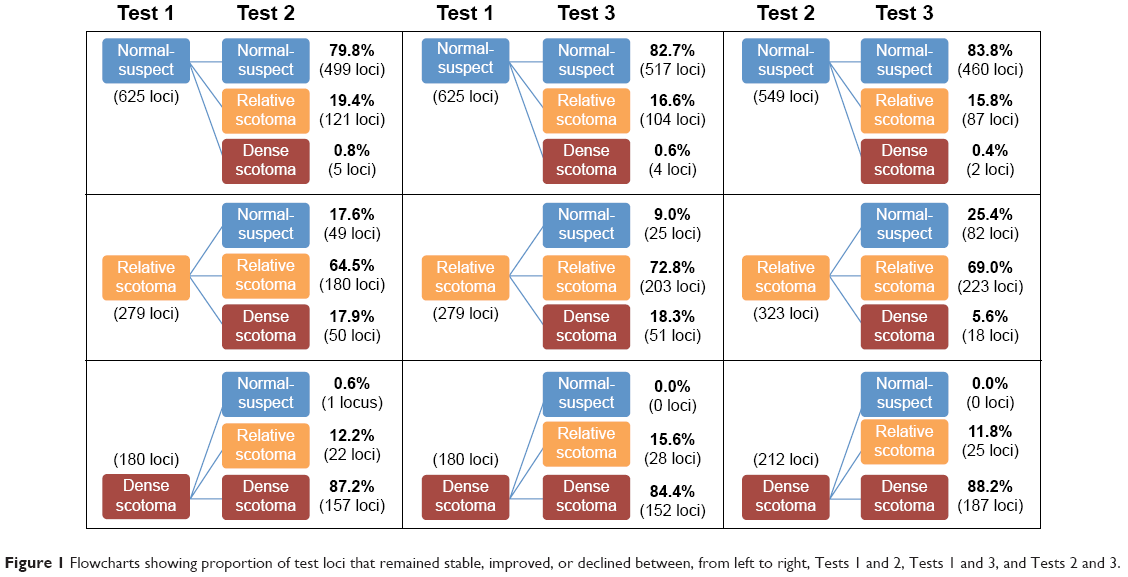 | Figure 1 Flowcharts showing proportion of test loci that remained stable, improved, or declined between, from left to right, Tests 1 and 2, Tests 1 and 3, and Tests 2 and 3. |
A total of 46.7%, 48.2%, and 51.2% of all pairs of test loci had no change in PWS between Tests 1–2, 1–3, and 2–3, respectively. Up to 99% had a change of −12 and +12 dB across all comparisons. Binomial test of asymmetry showed significantly higher proportion of loci showing −3 to −4 dB compared to +3 to +4 dB between Tests 1 and 2 and Tests 1 and 3 (P<0.001), but not between Tests 2 and 3 (P=0.507) (Figure 2). Mean (SD) CR for PWS was 5.35 (1.82) dB and ranged from 2.35 (95% CI: 1.56–3.14) dB to 11.23 (95% CI: 7.45–15.00) dB across 68 test loci (Figure 3).
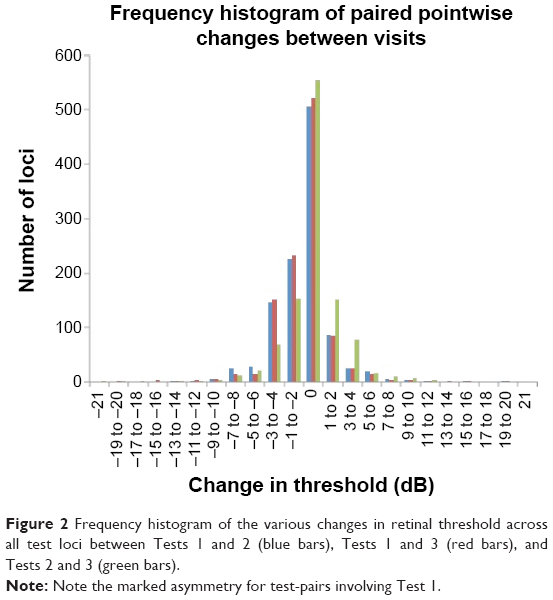 | Figure 2 Frequency histogram of the various changes in retinal threshold across all test loci between Tests 1 and 2 (blue bars), Tests 1 and 3 (red bars), and Tests 2 and 3 (green bars). |
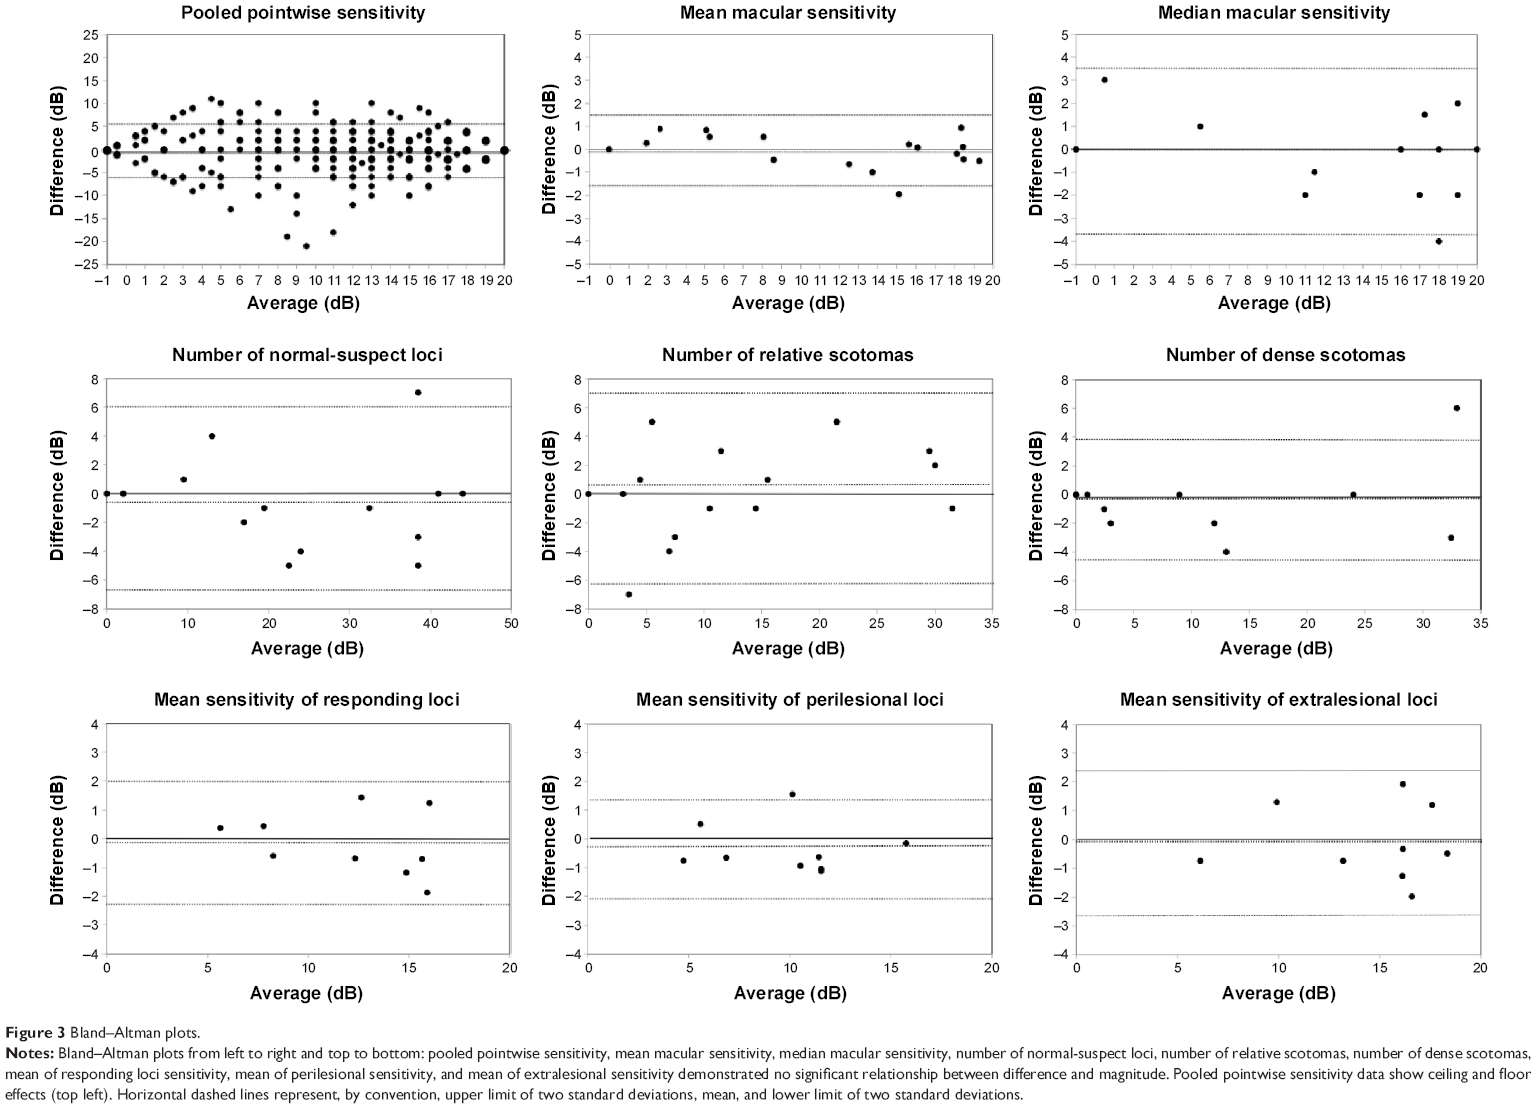 | Figure 3 Bland–Altman plots. |
Topography-based analysis
There was a statistically significant change in number of NS and DS over the three visits (P=0.021 and P=0.040), but not in number of RS (P=0.861) (Friedman’s test). For NS and DS, further analysis with Wilcoxon signed-rank test showed significant difference between Tests 1 and 2 (P=0.027 and P=0.017) and Tests 1 and 3 (P=0.016 and P=0.010), but not between Tests 2 and 3 (P=0.550 and P=0.157). Therefore, we discarded results from Test 1 and only used data from Tests 2 and 3 in the calculation of CR for the number of NS, RS, and DS (Figure 3). The CR for the number of NS, RS, and DS were 9.9 (95% CI: 6.5–13.3), 9.5 (95% CI: 6.2–12.7), and 3.0 (95% CI: 1.1–4.1), respectively.
Nine of 16 subjects had at least one nonresponding (DS) locus at one of three examinations, and they were included in the analysis of TASDS. The median (range) of TASDS were 69.1% (3.4%–96.8%), 67.5% (3.6%–100.0%), and 77.4% (0.0%–96.8%) (Table 4) for Test 1–2, 1–3, and 2–3, respectively. Topographical representations of DS and NS agreement for each of the nine subjects are shown in Figure 4. Only one of 16 subjects did not have any loci with LDC of NS; therefore, 15 subjects were used in the analysis of TASNS. The median (range) of TASNS were 73.5% (9.1%–100.0%), 79.6% (39.0%–100.0%), and 73.8% (33.3%–100.0%) for Tests 1–2, 1–3, and 2–3, respectively.
 | Table 4 TASDS and TASNS scores |
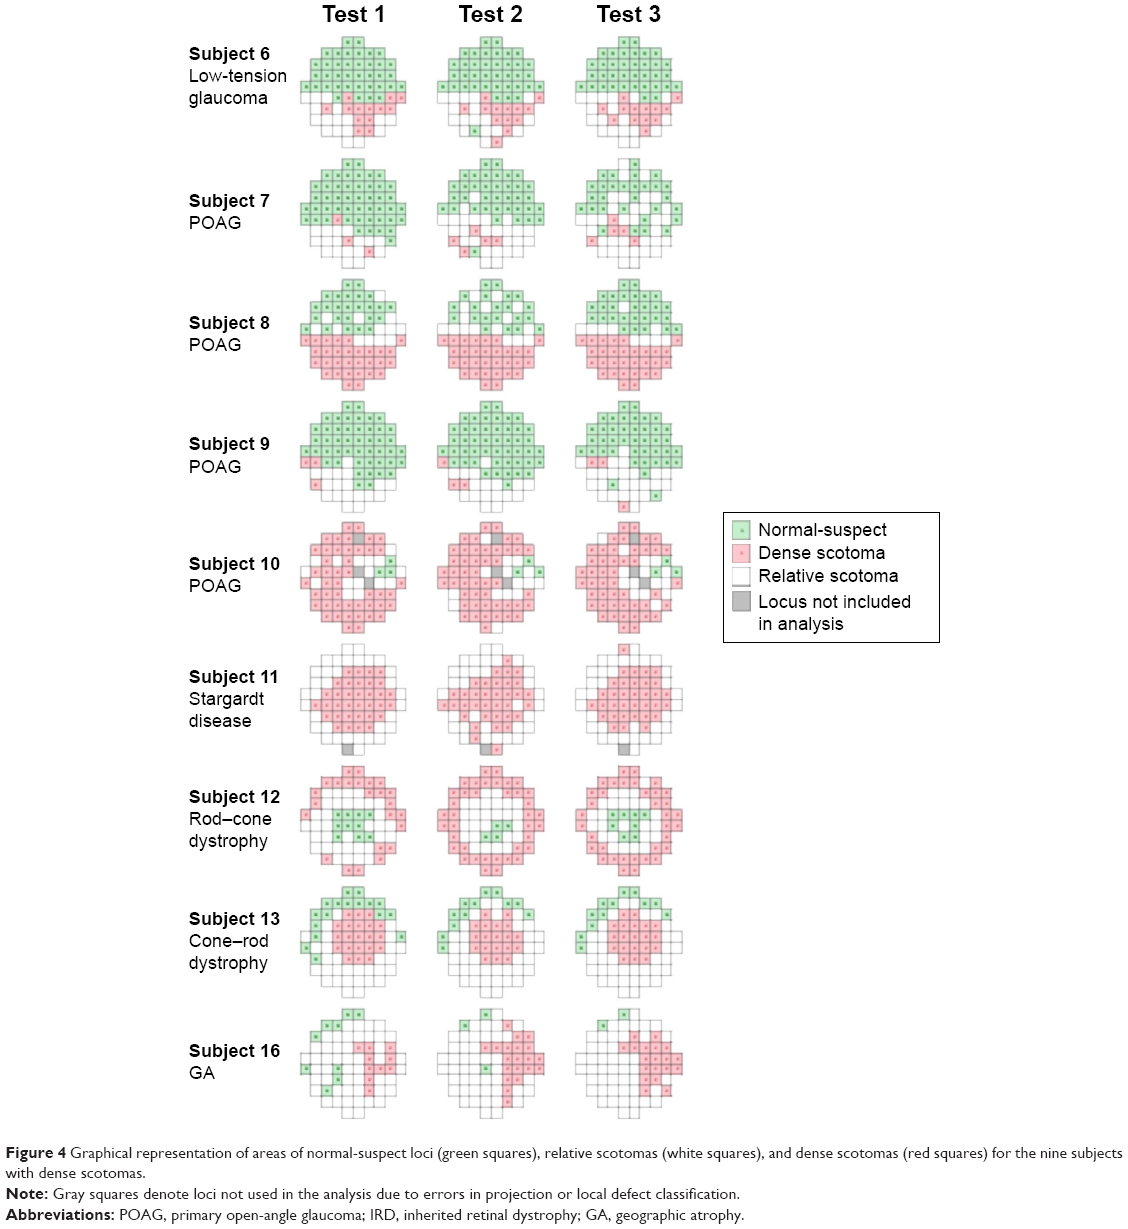 | Figure 4 Graphical representation of areas of normal-suspect loci (green squares), relative scotomas (white squares), and dense scotomas (red squares) for the nine subjects with dense scotomas. |
Threshold-based analysis
The  and
and  for each subject at Test 3 are shown in Table 1. There was a statistically significant difference in both and over the three test visits (P=0.019 and P=0.010, Friedman’s ANOVA). Two pairs of comparison showed significant difference for both and respectively: Tests 1 and 2 (P=0.007 and P=0.028), and Tests 1 and 3 (P=0.003 and P=0.030). There was no significant difference in and between Tests 2 and 3 (P=0.918 and P=0.836). Therefore, we excluded the results from Test 1 and used results from Tests 2 and 3 to determine outcome measures.
Bland–Altman plots for threshold-based parameters are shown in Figure 3. The CRs for and were 1.46 (95% CI: 0.99–1.94) dB and 3.44 (95% CI: 2.31–4.56) dB, respectively. The CRs for , , and  were 1.63 (95% CI: 1.10–2.16) dB, 1.76 (95% CI: 0.95–2.58) dB, and 2.76 (95% CI: 1.48–4.03) dB, respectively. The number of loci used in each subject for the calculation of these measures is shown in Table 5.
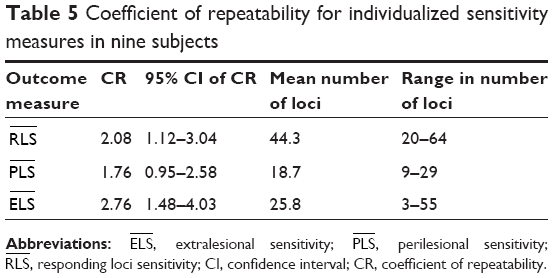 | Table 5 Coefficient of repeatability for individualized sensitivity measures in nine subjects |
Discussion
The arithmetic mean of overall retinal threshold is unable to detect subtle functional changes in atrophic macular disease. Several studies have recognized this limitation and investigated the use of additional scotoma-related measures to detect progression, including number and/or proportion of NS,17 DS,15,16 ,14–17 , and .13–17 In the light of this, we reported TRV values for each of these measures in our cohort. Additionally, we analyzed median (range) of CAS, TASNS, and TASDS as possible novel parameters for assessing change.
As a psychophysical measure, microperimetry is subject to inherent TRV. To successfully employ it in monitoring and detection of disease progression or treatment response, it is essential to have an estimate of this variability. A number of studies have investigated TRV of threshold-based measures (mean sensitivity, PWS, and various sections of test grids) in the MP-1,4–7,11 OCT/SLO,22 and MAIA;9–11 and TRV of fixation stability in the MP-123 and MAIA.9 Previously reported CR values for TRV in the MP-1 are summarized in Table 6. Our reported CR values for retinal sensitivity measurement and fixation stability are comparable to what has been published for the MP-1. However, the TRV of individualized topography-based or threshold-based measures of macular function have not been investigated.
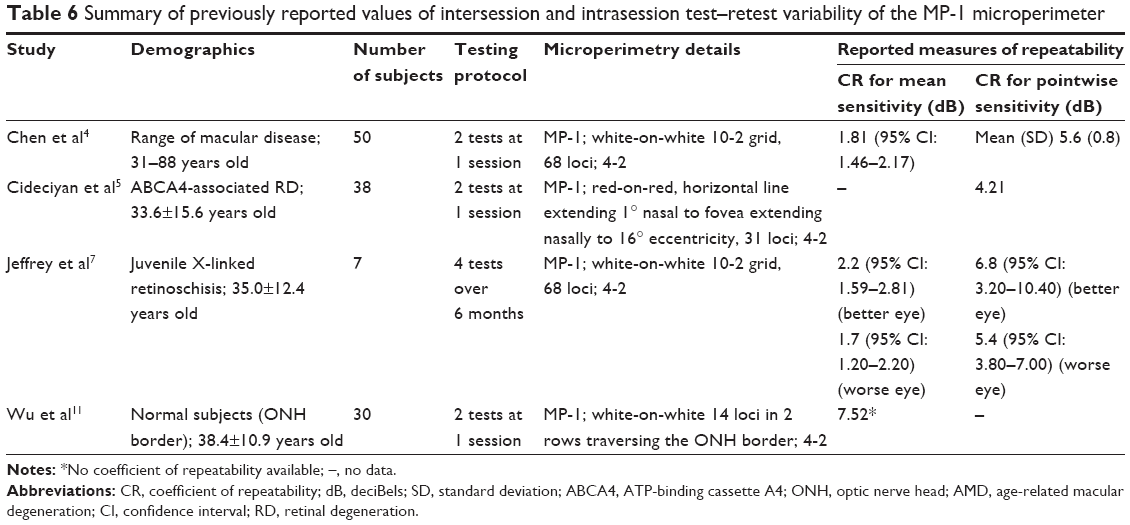 | Table 6 Summary of previously reported values of intersession and intrasession test–retest variability of the MP-1 microperimeter |
The use of the number of NS and DS arise from the concept of scotoma size in kinetic perimetry. Therefore, they are only estimates of the true size of these regions. The use of color fundus photographs, fundus autofluorescence, and OCT is well established in the assessment of the atrophic area;24–29 however, they are unable to differentiate regions of normal and subnormal function. Similar to retinal imaging, we have demonstrated variability in the assessment of the size of the regions with DS or NS LDC. Even in subjects with stable scotoma, with no progression detected on SD-OCT, CR for the number of NS and DS was 10 and 3 loci, respectively. This needs to be taken into consideration when performing structure and function correlation analysis and when interpreting changes in microperimetry of subjects with macular disease or glaucoma. The factors that give rise to inherent TRV in microperimetry and other perimetric assessments have been well documented.4,30,31
, , and are measures that assess the remaining “seeing region” of the macula and are logical alternative parameters that may be used to detect progressive loss of retinal sensitivity. The use of these measures is akin to removing the additional peak at −1 dB in the lower two graphs of Figure 5 and analyzing the remaining values. We found them to have good repeatability in our cohort, with values similar to CR for overall MS. However, there is an intrinsic bias in analyzing the change in these values because the number of test loci used to calculate these values will vary from subject to subject, and also between tests within subjects as well. The greater the number of the “seeing” test loci used, the larger the “averaging-out” effect on the final result. Readers need to be aware of this in interpreting these measures in detecting change in subjects with atrophic disease. Practically speaking, the task of manually selecting loci for each of these measures is also laborious.
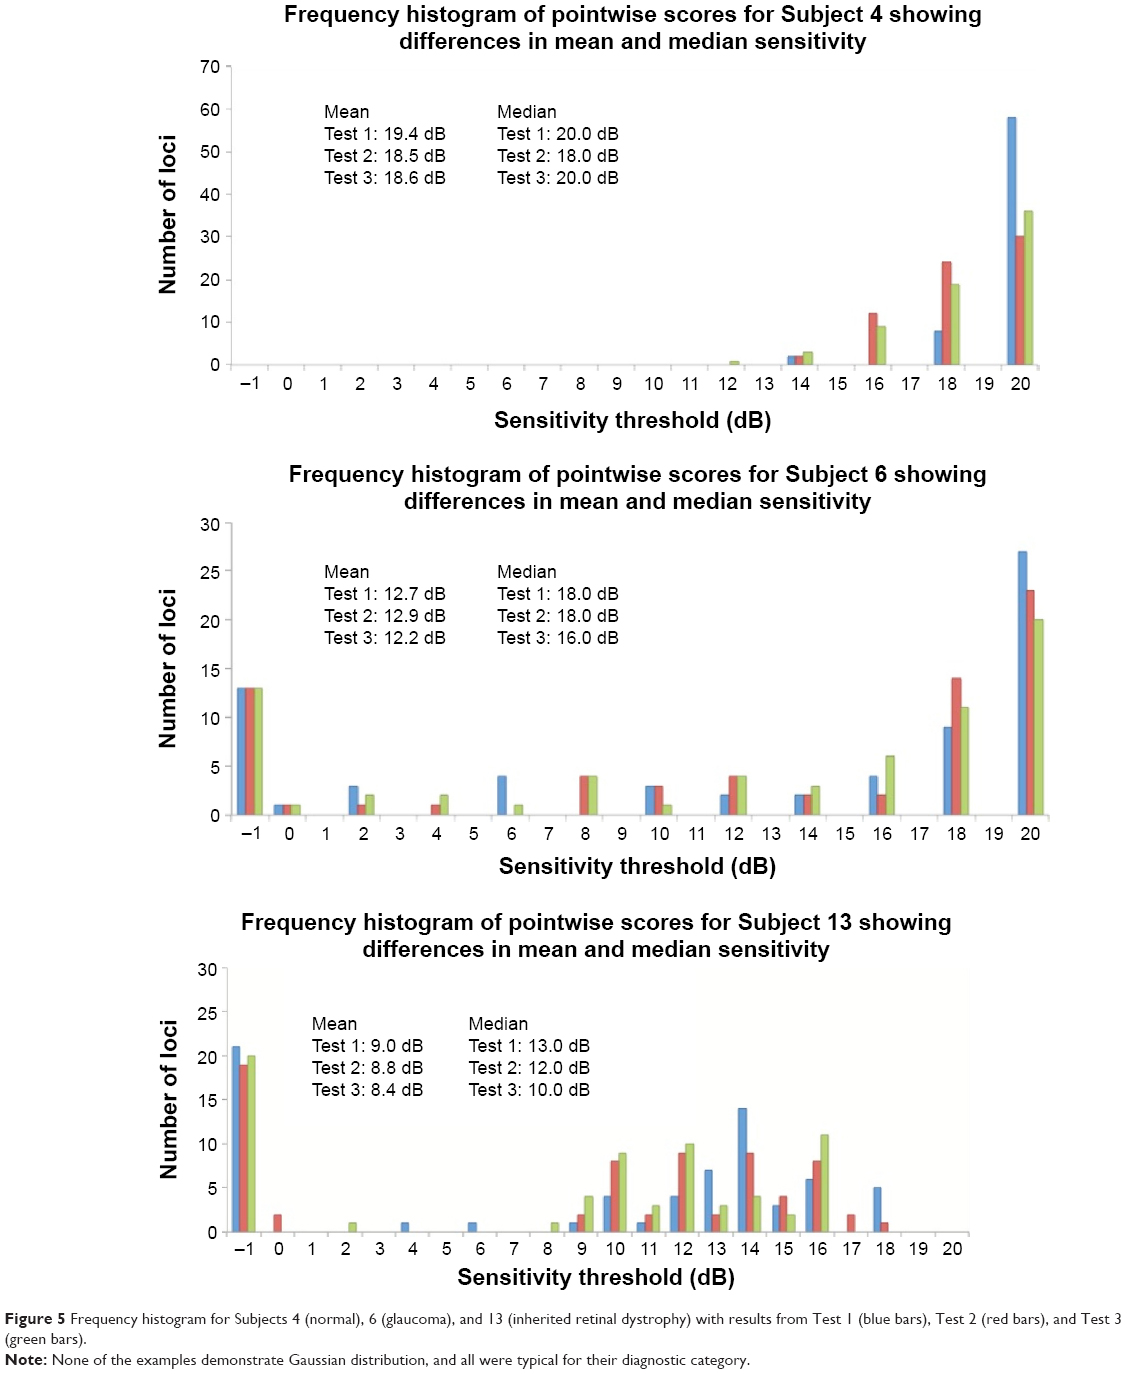 | Figure 5 Frequency histogram for Subjects 4 (normal), 6 (glaucoma), and 13 (inherited retinal dystrophy) with results from Test 1 (blue bars), Test 2 (red bars), and Test 3 (green bars). |
We further explored the use of three novel measures to assess TRV: the CAS, TASNS, and TASDS. We used the default NAVIS software provided by Nidek to assign the categories as outlined in the “Methods” section, resulting in three categories, namely, “NS”, “RS”, and “DS”. CAS is a measure of what percentage of loci initially assessed to be in each category subsequently remained in their original categories. We found that between the second two examinations, for individual subjects, a median (range) of 83.8% (41.2%–95.6%) of the loci had stable LDC. In other words, approximately one in six (and at the worst, more than one in two) loci were liable to experience a change in LDC. By pooling all 1,084 available pairs of loci between Tests 2 and 3, 16.2%, 31.0%, and 11.8% of NS, RS, and DS changed categories. This represents a large amount of variability in stable eyes. Therefore, we recommend caution in the use of this parameter and further study is required.
TASDS is a measure of the spatial accuracy of the mapping of functional scotoma. This has previously been reported under the terminology “topographical reproducibility rate” (TRR) in the use of a computer-assisted moving eye campimeter to assess mapping of the physiological blind spot in ten normal subjects.20 We renamed it “topographical agreement score” as it is similar in concept to the calculation of observed agreement in a contingency table. Mutlukan20 reported a mean (SD; range) TRR (or TASDS) of 73 (5, 64–80) % in their cohort. The median score was comparable to our results; however, we found more interindividual variability, from 0% to 96.8% between Tests 2 and 3. On careful review of Subject 9 with TASDS of 0%, we found that on follow-up the test grid had shifted temporally, resulting in a complete mismatch in scotoma-mapping (Figure 6). TASDS is a useful means of assessing the accuracy of functional scotoma mapping; however, the large interindividual variability raises questions of the reliability of topographical mapping of DS in the MP-1 device. Values of TASNS were approximately equivalent to those of TASDS.
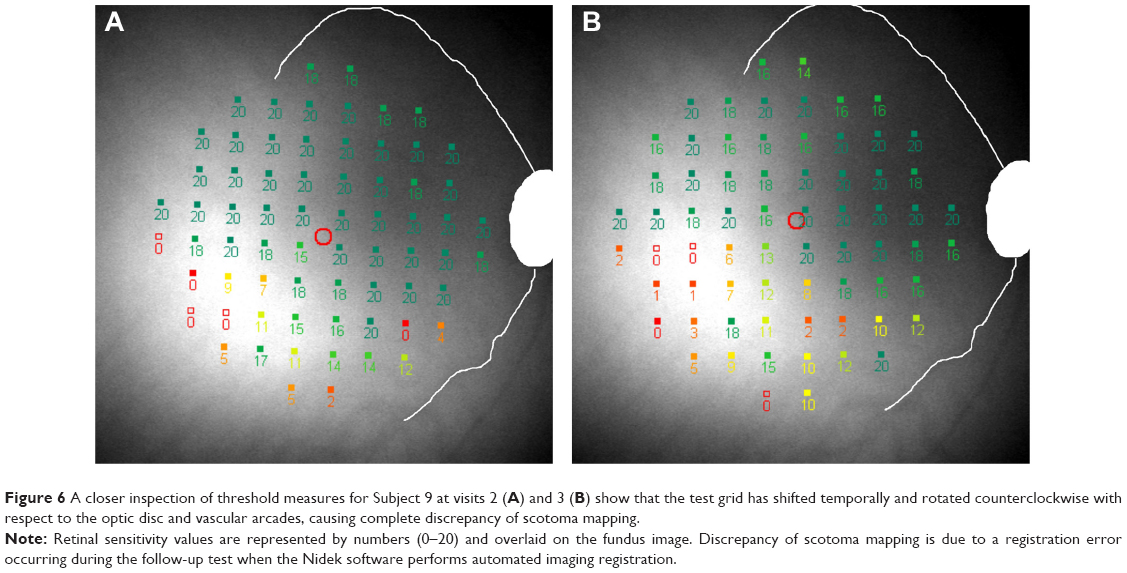 | Figure 6 A closer inspection of threshold measures for Subject 9 at visits 2 (A) and 3 (B) show that the test grid has shifted temporally and rotated counterclockwise with respect to the optic disc and vascular arcades, causing complete discrepancy of scotoma mapping. |
Finally, we detected an unusual phenomenon during the course of the study. While we were expecting to identify either a learning effect,10 or no detectable difference between baseline and follow-up,5 we found instead a statistically significant decline in MS values between Test 1 and Tests 2 and 3. Wu et al11 documented this in the MP-1 device and suggested that the significant ceiling effect due to the narrow luminance range of the MP-1 was the cause of the phenomenon. Further studies are required to elucidate the reasons behind this. We recommend that future studies should consider discarding the very first examination and use only the first follow-up examination as the baseline for future comparison.
Our study has several limitations. The generalizability of our results remains to be ascertained in future larger studies. Despite the small sample size, we have selected a pilot cohort of patients with a wide range of macular function that did not progress over the course of investigation (2 months) in order to explore topographical- and threshold-based analysis of microperimetry results and determine TRV in these outcome measures. There may be disease-specific TRV that will require further study. We did not perform a fourth, fifth, or sixth microperimetry examination to determine the longer term fluctuation. This design is important in future studies to confirm that the stability in thresholds and topography between Tests 2 and 3 continues to Tests 3 and 4, Tests 4 and 5, and so on.
Conclusion
We recommend the use of four loci (upper limit of 95% CI for CR for the number of DS) as the limit of TRV for assessing extension of functional scotoma in a 10-2 test grid on the Nidek MP-1. Other scotoma-related measures are subject to intrinsic bias. We explored and found large interindividual variability in the use of CAS and TAS scores to analyze the repeatability of categorical mapping in microperimetry, and advise caution in their usage. Finally, we detected a statistically significant decline in MS from the first to both second and third tests and caution the use of the very first test as a baseline examination for future comparison.
Acknowledgments
Funding was provided by the National Health & Medical Research Council Early Career Fellowship (FKC), The University of Western Australia (FKC), Lions Eye Institute (FKC, DAM), and Ophthalmic Research Institute of Australia (FKC).
Disclosure
The authors report no conflicts of interest in this work.
References
ClinicalTrials.gov [Internet]. clinicaltrials.gov. 2015. Available from: http://clinicaltrials.gov. Accessed July 1, 2015. | ||
Rohrschneider K, Bültmann S, Springer C. Use of fundus perimetry (microperimetry) to quantify macular sensitivity. Prog Retin Eye Res. 2008;27(5):536–548. | ||
Anastasakis A, McAnany JJ, Fishman GA, Seiple WH. Clinical value, normative retinal sensitivity values, and intrasession repeatability using a combined spectral domain optical coherence tomography/scanning laser ophthalmoscope microperimeter. Eye (Lond). 2010;25(2): 245–251. | ||
Chen FK, Patel PJ, Xing W, et al. Test-retest variability of microperimetry using the Nidek MP1 in patients with macular disease. Invest Ophthalmol Vis Sci. 2009;50(7):3464–3472. | ||
Cideciyan AV, Swider M, Aleman TS, et al. Macular function in macular degenerations: repeatability of microperimetry as a potential outcome measure for ABCA4-associated retinopathy trials. Invest Ophthalmol Vis Sci. 2012;53(2):841–852. | ||
Ismail SA, Kaur S, Mutalib HA, Ngah NF. Macular retinal sensitivity using MP-1 in healthy Malaysian subjects of different ages. J Optom. 2015;8(4):266–272. doi:10.1016/j.optom.2015.04.001. | ||
Jeffrey BG, Cukras CA, Vitale S, Turriff A, Bowles K, Sieving PA. Test–retest intervisit variability of functional and structural parameters in X-linked retinoschisis. Transl Vis Sci Technol. 2014;3(5):5. doi:10.1167/tvst.3.5.5. | ||
Liu H, Bittencourt MG, Wang J, et al. Retinal sensitivity is a valuable complementary measurement to visual acuity – a microperimetry study in patients with maculopathies. Graefes Arch Clin Exp Ophthalmol. 2015. Epub 2015 March 7. doi:10.1007/s00417-015-2974-6. | ||
Molina-Martín A, Piñero DP, Pérez-Cambrodí RJ. Reliability and intersession agreement of microperimetric and fixation measurements obtained with a new microperimeter in normal eyes. Curr Eye Res. 2015. Epub 2015 August 19. doi:10.3109/02713683.2015.1020170. | ||
Wu Z, Ayton LN, Guymer RH, Luu CD. Intrasession test-retest variability of microperimetry in age-related macular degeneration. Invest Ophthalmol Vis Sci. 2013;54(12):7378–7385. | ||
Wu Z, Jung CJ, Ayton LN, Luu CD, Guymer RH. Test-retest repeatability of microperimetry at the border of deep scotomas. Invest Ophthalmol Vis Sci. 2015;56(4):2606–2611. | ||
Parodi MB, Triolo G, Morales M, et al. MP1 and MAIA fundus perimetry in healthy subjects and patients affected by retinal dystrophies. Retina. 2015;35(8):1662–1669. doi:10.1097/IAE. 0000000000000504. | ||
Chen FK, Patel PJ, Webster AR, Coffey PJ, Tufail A, Da Cruz L. Nidek MP1 is able to detect subtle decline in function in inherited and age-related atrophic macular disease with stable visual acuity. Retina. 2011;31(2):371–379. | ||
Pilotto E, Guidolin F, Convento E, Stefanon FG, Parrozzani R, Midena E. Progressing geographic atrophy: choroidal thickness and retinal sensitivity identify two clinical phenotypes. Br J Ophthalmol. 2015;99(8):1082–1086. doi:10.1136/bjophthalmol-2014-306338. | ||
Pilotto E, Benetti E, Convento E, et al. Microperimetry, fundus autofluorescence, and retinal layer changes in progressing geographic atrophy. Can J Ophthalmol. 2013;48(5):386–393. | ||
Pilotto E, Guidolin F, Convento E, et al. Fundus autofluorescence and microperimetry in progressing geographic atrophy secondary to age-related macular degeneration. Br J Ophthalmol. 2013;97(5): 622–626. | ||
Meleth AD, Mettu P, Agron E, et al. Changes in retinal sensitivity in geographic atrophy progression as measured by microperimetry. Invest Ophthalmol Vis Sci. 2011;52(2):1119–1126. | ||
Bland JM, Altman DG. Agreement between methods of measurement with multiple observations per individual. J Biopharm Stat. 2007;17(4):571–582. | ||
Cideciyan AV, Swider M, Aleman TS, et al. ABCA4-associated retinal degenerations spare structure and function of the human parapapillary retina. Invest Ophthalmol Vis Sci. 2005;46(12):4739–4746. | ||
Mutlukan E. Topographical reproducibility of small scotoma using computerised dynamic fixation target. Doc Ophthalmol. 1996;91(3):223–231. | ||
Bland JM, Altman DG. Statistical methods for assessing agreement between two methods of clinical measurement. Lancet. 1986;1(8476):307–310. | ||
Jang HS, Sepah Y, Bittencourt M, et al. Test-retest reliability of microperimetry using the Optos OCT SLO in eyes with and without known retinal diseases. In: Proceedings of the Association for Research in Vision and Ophthalmology (ARVO) Annual Meeting; 2013 May 5–9; Seattle, Washington. Invest Ophthalmol Vis Sci. 2013;54:3432. | ||
Chen FK, Patel PJ, Xing W, et al. Intrasession repeatability of fixation stability assessment with the Nidek MP-1. Optom Vis Sci. 2011;88(6):742–750. | ||
Parodi MB, Iacono P, Triolo G, et al. Morpho-functional correlation of fundus autofluorescence in Stargardt disease. Br J Ophthalmol. 2015;99(10):1354–1359. doi:10.1136/bjophthalmol-2014-306237. | ||
Duncker T, Marsiglia M, Lee W, et al. Correlations among near-infrared and short-wavelength autofluorescence and spectral-domain optical coherence tomography in recessive Stargardt disease. Invest Ophthalmol Vis Sci. 2014;55(12):8134–8143. | ||
Testa F, Melillo P, Di Iorio V, et al. Macular function and morphologic features in juvenile Stargardt disease. Ophthalmology. 2014;121(12):2399–2405. | ||
van Huet RAC, Bax NM, Haaften SCW-V, et al. Foveal sparing in Stargardt disease. Invest Ophthalmol Vis Sci. 2014;55(11):7467–7478. | ||
Abdillahi H, Enzmann V, Wittwer VV, Wolf S, Wolf-Schnurrbusch UEK. Vitreoretinal interface changes in geographic atrophy. Ophthalmology. 2014;121(9):1734–1739. | ||
Chun R, Fishman GA, Collison FT, Stone EM, Zernant J, Allikmets R. The value of retinal imaging with infrared scanning laser ophthalmoscopy in patients with Stargardt disease. Retina. 2014;34(7):1391–1399. | ||
Johnson CA, Adams CW, Lewis RA. Fatigue effects in automated perimetry. Appl Opt. 1988;27(6):1030–1037. | ||
Johnson CA. Psychophysical factors that have been applied to clinical perimetry. Vision Res. 2013;90:25–31. |
 © 2015 The Author(s). This work is published and licensed by Dove Medical Press Limited. The
full terms of this license are available at https://www.dovepress.com/terms
and incorporate the Creative Commons Attribution
- Non Commercial (unported, 3.0) License.
By accessing the work you hereby accept the Terms. Non-commercial uses of the work are permitted
without any further permission from Dove Medical Press Limited, provided the work is properly
attributed. For permission for commercial use of this work, please see paragraphs 4.2 and 5 of our Terms.
© 2015 The Author(s). This work is published and licensed by Dove Medical Press Limited. The
full terms of this license are available at https://www.dovepress.com/terms
and incorporate the Creative Commons Attribution
- Non Commercial (unported, 3.0) License.
By accessing the work you hereby accept the Terms. Non-commercial uses of the work are permitted
without any further permission from Dove Medical Press Limited, provided the work is properly
attributed. For permission for commercial use of this work, please see paragraphs 4.2 and 5 of our Terms.