Back to Journals » International Journal of Nanomedicine » Volume 10 » Issue 1
Insight into molecular dynamics simulation of BRAF(V600E) and potent novel inhibitors for malignant melanoma
Received 1 January 2015
Accepted for publication 5 March 2015
Published 23 April 2015 Volume 2015:10(1) Pages 3131—3146
DOI https://doi.org/10.2147/IJN.S80150
Checked for plagiarism Yes
Review by Single anonymous peer review
Peer reviewer comments 4
Editor who approved publication: Dr Thomas Webster
Video abstract presented by Hsin-Chieh Tang
Views: 2846
Hsin-Chieh Tang,1 Yu-Chian Chen1–3
1Department of Biomedical Informatics, Asia University, Taichung, Taiwan; 2Human Genetic Center, Department of Medical Research, 3Research Center for Chinese Medicine and Acupuncture, China Medical University Hospital, Taichung, Taiwan
Abstract: BRAF inhibitors have changed the standard therapeutic protocol for advanced or metastatic melanoma which harbored notorious BRAF(V600E) single mutation. However, drug resistance to BRAF inhibitors happens just like other cancer treatment. In this study, we constructed the ideal BRAF(V600E)-modeled structure through homology modeling and introduced the method of structure-based docking or virtual screening from the large compound database. Through certain methods of molecular dynamics simulation, we realized that BRAF(V600E) had quite prominent difference of molecular character or structural variation from the wild-type BRAF protein. It might confer the metamorphic character of advanced melanoma for the patients who harbored BRAF(V600E) mutation. By the methods of ligand-based quantitative structure-activity relationship and molecular dynamics simulation, we further recommend that aknadicine and 16beta-hydroxy-19s-vindolinine N-oxide from the traditional Chinese medicine are potent novel inhibitors for the management of malignant melanoma in the future.
Keywords: BRAF inhibitor, structure-based, virtual screening, docking, ligand-based, quantitative structure-activity relationship (QSAR)
Letter to the editor published
Introduction
Drug use of BRAF inhibitors has become the exciting option of treatment for malignant melanoma patients who harbor B-RAF (BRAF) Val600Glu (V600E) single mutation.1 BRAF inhibitors have been one of the first choices of treating metastatic melanoma.2 More than half of the advanced melanomas contain BRAF gene mutation.3 Dozens of BRAF mutations have been verified, but BRAF(V600E) is the most notorious one. It replaces the normal amino acid valine (V) with glutamic acid (E) at position 600.4 Normal BRAF receives upstream signal from the growth factor receptor, receptor tyrosine kinase. BRAF regulates the mitogen/extracellular-activated protein kinase (MEK) and extracellular signal-regulated kinase (ERK) pathway. BRAF-MEK-ERK pathway controls the survival of the melanocytes in nevi or melanoma lesions.5 RRAF(V600E) mutation leads to uncontrolled cell growth in the melanoma patients.6 Traditional chemotherapy is insufficient for treating advanced or metastatic melanoma.7 Developing BRAF inhibitors is the milestone for the management of melanoma harboring BRAF(V600E) mutation.8 Vemurafenib was the first BRAF inhibitor approved by the US Food and Drug Administration in 2011.9 Vemurafenib (PLX4032) is the derivate from the experimental precursor, PLX4720.10 It improves the survival rates in advanced melanoma patients.11 Many clinical trials have proved amazing efficacy with vemurafenib treatment.12 Dabrafenib is the other approved BRAF inhibitor for advanced melanoma, which harbors BRAF(V600E) mutation.13 It has a dramatic effect in treating metastatic melanoma patients.14
However, the satisfaction of treatment just remains for a short period.15 Drug resistance to single BRAF inhibitor treatment occurs vigorously.16 The patients who were responsive to previous BRAF inhibitor suffer from disease progression.17 Many mechanisms explain why the resistance to BRAF inhibitors happens.18 There are mechanisms of primary and acquired resistance to RRAF inhibitor.19 Acquired resistance or compensatory reactivation of MEK/ERK signaling pathway is one reason for resistance.20 The reactivation of MEK/ERK pathway relies on aberrantly spliced BRAF(V600E) protein. BRAF(V600E) copy number amplification is sufficient for the resistance to BRAF inhibitor.21 MEK mutation has been implicated in BRAF inhibitor resistance, too.22 Upregulation and activation of the upstream receptor tyrosine kinase and expression of mutant N-RAS block the effect of BRAF inhibitor.23 NRAS and C-RAF cooperate to drive the resistance to BRAF inhibitor.24,25 Primary resistance includes loss or inactivation of essential tumor suppressors. Both the phosphatase and tensin homolog and retinoblastoma susceptibility gene are implicated in BRAF inhibitor resistance.26 Thus, we need combined strategy and alternative treatment to rescue advanced melanoma patients.27
BRAF protein has 766 amino acids and is composed of three main domains.28 The most important catalytic domain that phosphorylates consensus substrates is residues 457–717, conserved region 3. There are two lobes that are connected by a short hinge region. N-lobe (residues 457–530) is responsible for adenosine triphosphate (ATP) binding. C-lobe (residues 535–717) binds substrate proteins.29 Val471, Ala481, Leu514, Thr529, Trp531, and Cys532 form a pocket in which ATP is anchored. Asp(D)594, Phe(F)595, and Gly(G)596 compose a DFG motif, which determines the inactive or active state of BRAF protein. DFG-out or active state indicates that DFG motif moves out the pocket for ATP binding. DFG-out or active state indicates that DFG motif moves out of the pocket following ATP binding.30–32 ATP binding in N-lobe and substrate protein binding in C-lobe facilitate the phosphorylation of substrate protein. Thus, most BRAF inhibitors are designed to bind with the hinge region (residues 530–535) to prevent contact of ATP and substrate protein.33
In this study, we attempted to explore if there was any difference between wild-type BRAF and mutant BRAF(V600E) protein by computational simulation. Then we could discover the molecular character of this metamorphic protein. Investigation of the structural variation of BRAF(V600E) helped us understand the possible mechanism why the inhibitor resistance occurred in the conformational study.34 Systems biology is an indispensable science in modern biology and chemistry.35,36 Computer-aided drug design offers an alternative method in medicinal and biochemical technique of drug candidates searching. It has the advantage of screening out appropriate compounds for medicinal purpose efficiently. There are two major methods, structure-based and ligand-based, in computer-aided drug design. Structure-based method depends on three-dimensional (3D) structure and active sites of the target protein to survey the interaction, binding affinity, and steric relationship between the ligand and protein.37,38
As mentioned previously in the literature, searching BRAF inhibitors through structure-based virtual screening was a viable way to find out the potent compounds and their derivatives for further investigation from the large molecular database. In this study, we tried to identify if there was any compound better than the existing or experimental BRAF inhibitors by virtual screening from the large traditional Chinese medicine (TCM) compound database.39–42 Ligand-based methods depend on the features of the ligand when it interacts with the target protein. This technique adopts statistical algorithms to link the conformational features and biological activities when a ligand interacts with the protein. The other novelty and significance of this study is molecular dynamics (MD) simulation. It is one of the most powerful tools in the biological study. The interaction of a ligand and protein is a dynamic process. Because molecular interaction contains a large number of atoms, it is necessary to analyze the enormous data of atom deviation or fluctuation by MD simulation. It provides detailed information about dynamic changes of the ligand and conformational changes of the protein. Through MD simulation, we could explore the mystery of wild-type BRAF from BRAF(V600E) protein. In addition, we could examine if the selected potent inhibitors bound with BRAF(V600E) protein successfully and stably.
Materials and methods
Homology modeling
We obtained the sequence of human BRAF protein (residues 1–766) from the UniProt Knowledgebase (P15056, human) and 3D conformation (residues 445–723) from Protein Data Bank (ID: 2FB8, human). Homology modeling of BRAF(V600E) with crystal structure of wild-type BRAF (2FB8) was constructed by the Build Homology Models program of Accelrys Discovery Studio (DS). We further confirmed the BRAF(V600E)-modeled structure by a Ramachandran plot with Rampage program and by Verify score with Profiles-3D program in DS.43
Structure-based docking or virtual screening
We prepared structure-based docking procedure for SB-590885 and made all the small molecular compounds from TCM Database@Taiwan to dock with BRAF(V600E) protein. LigandFit module in DS was conducted to perform the docking procedure. Key position of the binding sites was set at the residues 530–535. We minimized all docking poses between the ligand and BRAF(V600E) protein by the force field of Chemistry at HARvard Molecular Mechanics. LIGPLOT module in DS was adopted to illustrate hydrogen bond (H-bond) or other binding forces between the ligand and BRAF(V600E) protein.44
Ligand-based quantitative structure–activity relationship (QSAR) models
We obtained 36 compounds and the pIC50 data of BRAF inhibitors to draw two-dimensional and 3D structures of these compounds by ChemBioDraw software.45 Calculate Molecular Property program and Genetic Function Approximation (GFA) algorithm in DS were conducted to find the appropriate molecular descriptors. These descriptors were verified by libSVM and Matlab Statistics Toolbox to construct the multiple linear regression (MLR) and support vector machine (SVM) models. We conducted Bayes Net Toolbox (BNT) for Bayesian network modeling to predict the pIC50 value of any given compound. These predicted models adopted fivefold cross-validation. We calculated the activity of square correlation coefficient (R2) by the pros and cons of each model. The highest R2 of SVM, MLR, and Bayesian network, which were chosen to be the predictive models, had sufficient capacity to predict the activity of selected candidates and the control (SB-590885).46
MD simulation
We illustrated the trajectories of MD simulation by the program of GROningen MAchine for Chemical Simulations. Each ligand, protein as well as complex passed through four phases: minimization, heating, equilibration, and production. We drew the trajectories of root mean square deviation (RMSD), mean square deviation (MSD), gyration radius (Gyrate), and solvent-accessible surface area (SASA) for the ligand, protein, and complex. Ligands included the first two selected candidates (top1,2) and the control (SB-590885). Protein included BRAF alone (apo), BRAF(V600E) alone (mutants-apo), the corresponding BRAF(V600E) of the candidates, and the control. Complex included the candidate–BRAF(V600E) complex and the control–BRAF(V600E) complex. Total energy, root mean square fluctuation, principal component analysis, cluster analysis, and occupancy of H-bond were also conducted in this study.47
Results and discussion
Homology modeling
We substituted the amino acid valine (V) with glutamic acid (E) at position 600 in the sequence of BRAF protein and constructed the BRAF(V600E)-modeled structure based on the wild-type BRAF template (2FB8, human). Because the most significant catalytic domains that phosphorylated consensus substrates were residues 457–717, the conformation of 445–723 amino acids was sufficient to represent BRAF and BRAF(V600E)-modeled structure. Ramachandran plot of BRAF(V600E)-modeled structure displayed that 81.8% of residues were in the favored region, 14.6% were in the allowed region, and only 3.6% were in the outlier region (Figure 1). Verify score of wild-type BRAF (2FB8) and BRAF(V600E) protein showed that almost all the residues had positive values (Figure 2).
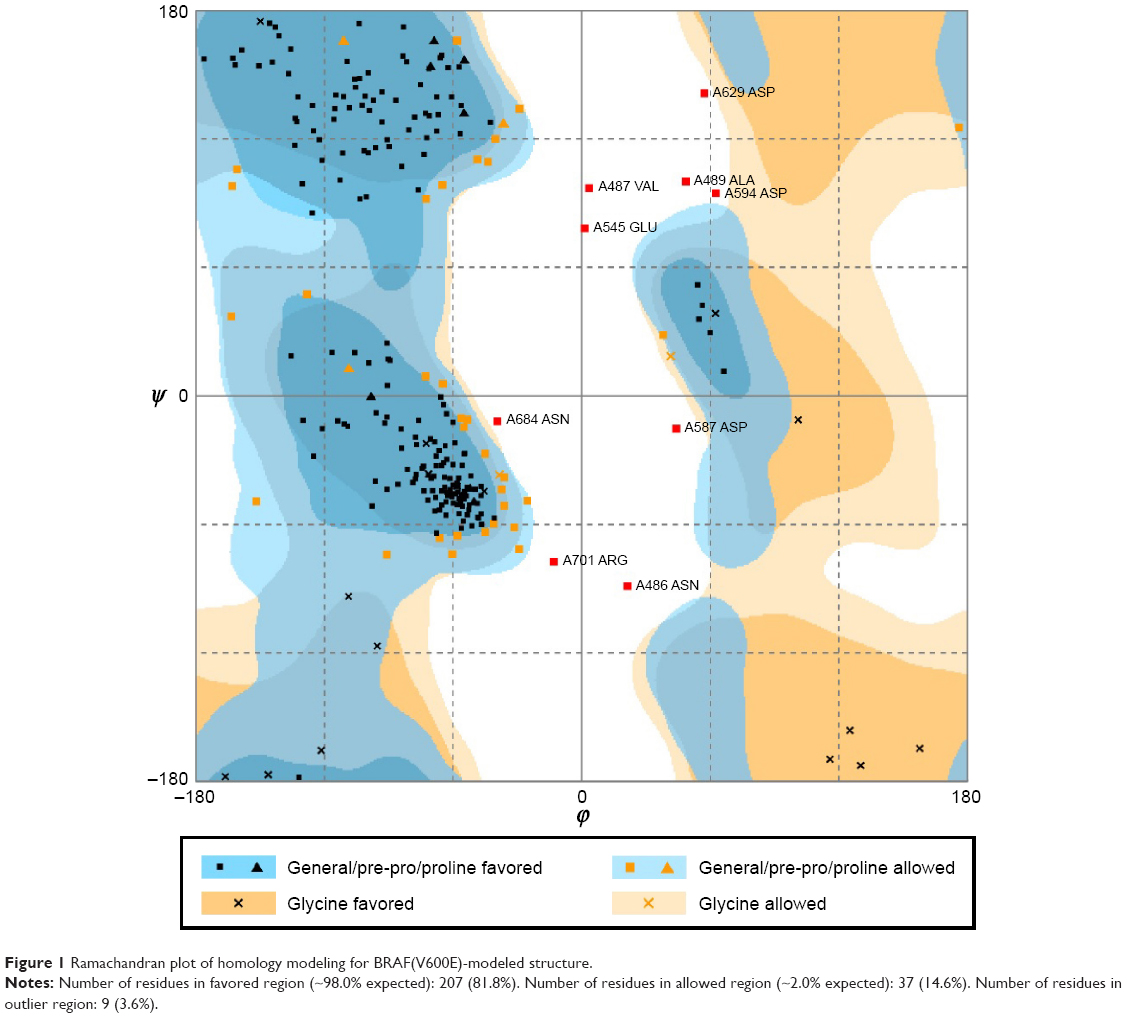 | Figure 1 Ramachandran plot of homology modeling for BRAF(V600E)-modeled structure. |
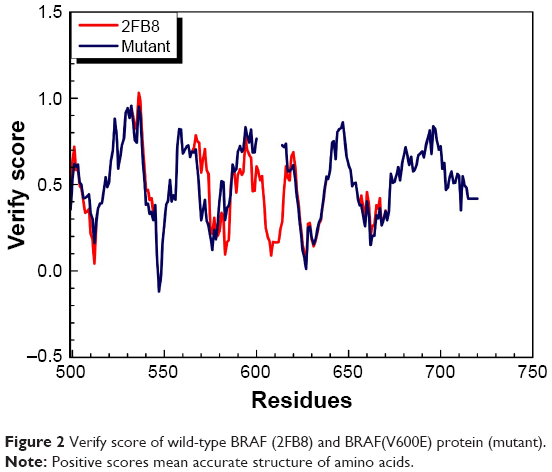 | Figure 2 Verify score of wild-type BRAF (2FB8) and BRAF(V600E) protein (mutant). |
To investigate the conformational character of BRAF(V600E) protein, we needed to construct the ideal BRAF(V600E)-modeled structure and confirm it through rigorous verification. The high percentage in the favored (81.8%) and allowed (14.6%) regions calculated by Ramachandran plot and qualified values presented by Verify score indicated that the BRAF(V600E)-modeled structure was an ideal conformation model.
Structure-based docking or virtual screening
We assigned the experimental BRAF inhibitor, SB-590885, as the ligand-binding control compound for BRAF(V600E) protein. SB-590885 was also the compound that existed in the crystal complex of 2FB8 recruited by the Protein Data Bank. We listed the first ten compounds screened by virtual screening from the world’s largest TCM Database@Taiwan. Dock score of the ten TCM compounds was better than that of SB-590885 (Table 1). According to the result of Dock score, we selected aknadicine (top1) and 16beta-hydroxy-19s-vindolinine N-oxide (top2) as the candidates for docking analysis, QSAR, and MD validation. We illustrated the binding residues of BRAF(V600E) protein with aknadicine, 16beta-hydroxy-19s-vindolinine N-oxide, and SB-590885. Aknadicine formed H-bond with Gly534 and Ser535 of BRAF(V600E) protein. 16beta-hydroxy-19s-vindolinine N-oxide formed H-bond with Trp531 and Glu533 of BRAF(V600E) protein. The control formed H-bond with Lys473, Trp531, and Glu533 BRAF(V600E) protein (Figure 3).
 | Table 1 Dock score and quantitative structure–activity relationship values |
 | Figure 3 Scaffold (left) and binding sites (right): (A) aknadicine, (B) 16beta-hydroxy-19s-vindolinine N-oxide, (C) the control, SB-590885. |
Because most BRAF inhibitors are designed to bind with the hinge region (residues 530–535) to prevent contact of ATP and substrate protein, we set the binding sites at the position 530–535 of BRAF(V600E) protein. Both the candidates and the control could bind to the region with the most important binding force, H-bond. Dock score of aknadicine, 16beta-hydroxy-19s-vindolinine N-oxide, and the control was 68.69, 59.16, and 31.51, respectively. This result demonstrated that more than ten TCM compounds could dock with BRAF(V600E) protein better than the control; thus, we selected the first two potent inhibitors, aknadicine and 16beta-hydroxy-19s-vindolinine N-oxide, as the candidates for further QSAR and MD validation.
Ligand-based QSAR models
We acquired 36 compounds and pIC50 data of BRAF inhibitors. The 36 compounds of BRAF inhibitors were randomly divided into 27 training sets and nine test sets for validation. We chose the following seven optimum descriptors for constructing GFA template model: ALogP, ES_Count_sssN, ES_Count_ssssC, LogD, Num_AromaticBonds, Minimized_Energy, and Shadow_XZfrac.
|
|
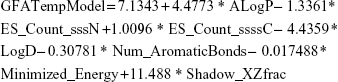
After determining GFA template model, we constructed SVM-, MLR-, and BNT-predictive models. Then we obtained the following mathematical slope equation by illustrating observed and predicted activity of these compounds (Table 2):
SVM: y = 0.8203x + 1.4449 | (2) |
MLR: y = 0.8449x + 1.1317 | (3) |
BNT: y = 0.7476x + 1.6731 | (4) |
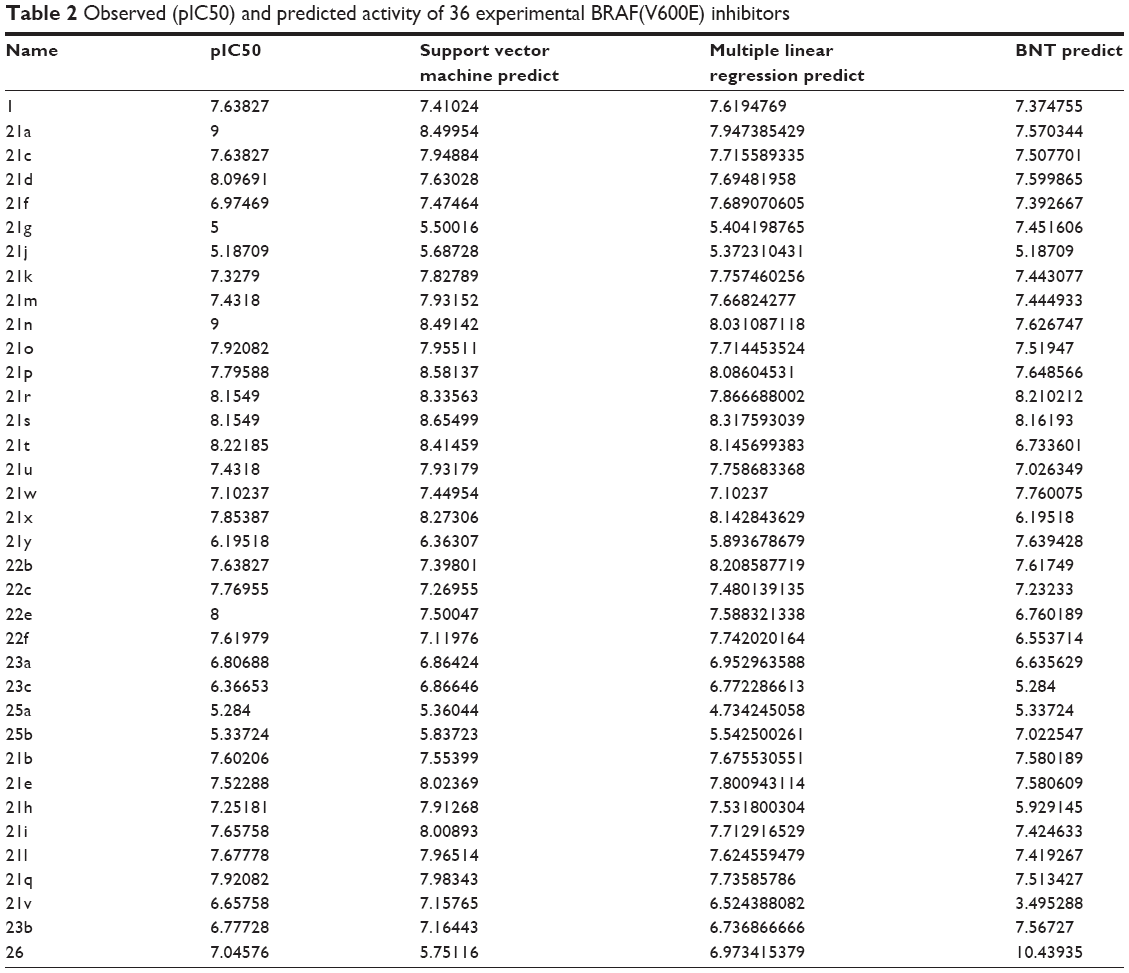 | Table 2 Observed (pIC50) and predicted activity of 36 experimental BRAF(V600E) inhibitors |
R2 value of SVM, MLR, and BNT was 0.8576, 0.8449, and 0.8293, respectively. The high R2 value meant that the predictive activity of any chosen compound was almost the same with its observed activity (Figure 4). Predicted activity of SVM value for aknadicine, 16beta-hydroxy-19s-vindolinine N-oxide, and the control was 6.83, 6.84, and 6.79, respectively. MLR value was 14.92, 14.51, and 7.87, respectively. BNT value was 7.13, 17.26, and 12.16, respectively (Table 1). The results of these predictive values demonstrated that the two candidates, aknadicine and 16beta-hydroxy-19s-vindolinine N-oxide, might have better biological activities than the control in general.
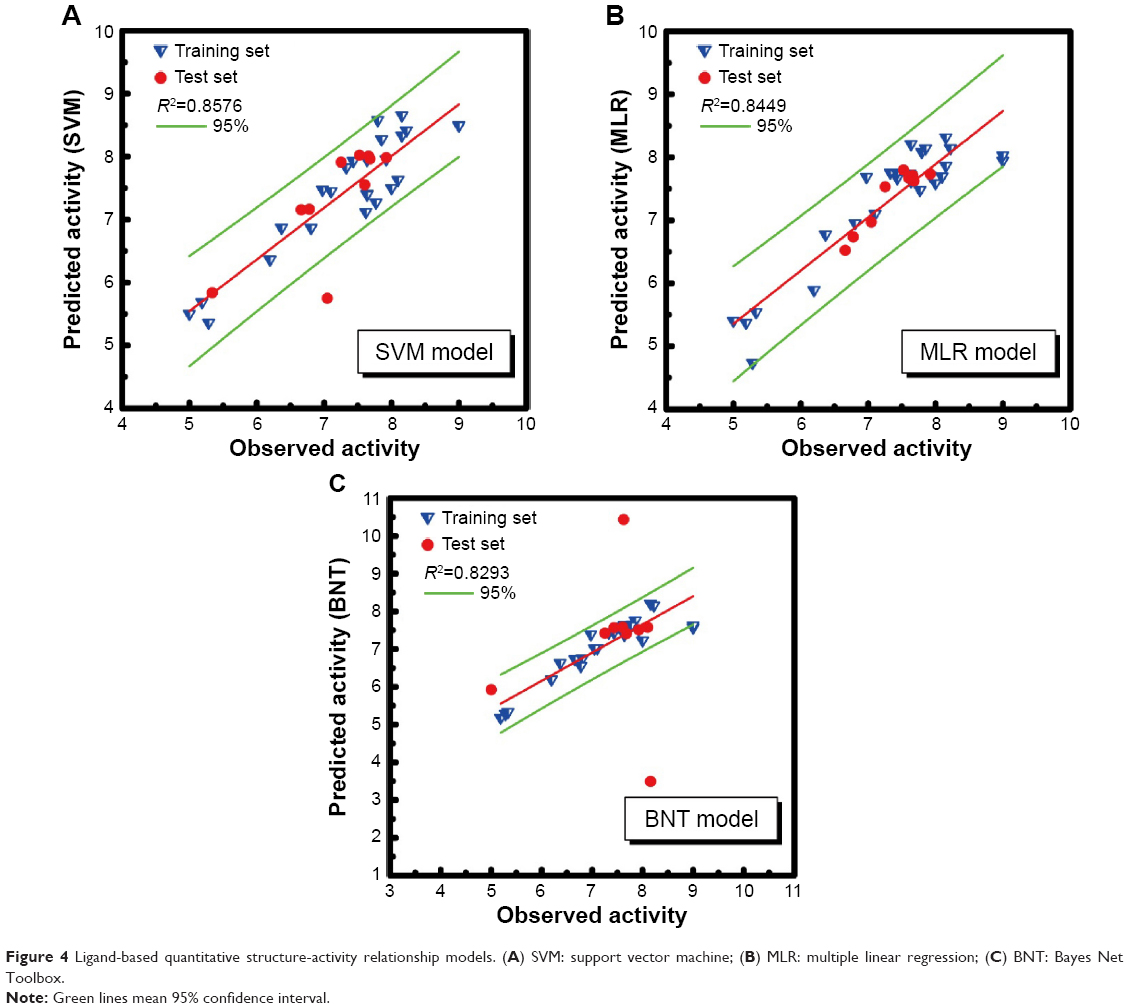 | Figure 4 Ligand-based quantitative structure-activity relationship models. (A) SVM: support vector machine; (B) MLR: multiple linear regression; (C) BNT: Bayes Net Toolbox. |
MD simulation
Molecular character
First, we compared two differences of molecular character in the process of MD. One was wild-type BRAF and BRAF(V600E) protein, the other was BRAF(V600E) protein to which both the candidates (aknadicine and 16beta-hydroxy-19s-vindolinine N-oxide) and the control bound.
We drew the trajectory of RMSD to investigate the deviation degree of each ligand (ligand RMSD) and the ligand–BRAF(V600E) protein complex (complex RMSD). The average ligand or complex RMSD value of the two candidates was smaller than that of the control (Figure 5). These results demonstrated that either aknadicine or 16beta-hydroxy-19s-vindolinine N-oxide had smaller ligand and ligand–protein complex deviation than the control. It was evident that both the candidates could bind to BRAF(V600E) protein stably.
 | Figure 5 Ligand (A) and complex (B) root mean square deviation (RMSD). |
The trajectory of MSD was drawn to observe the deviation degree of wild-type BRAF protein alone (apo), BRAF(V600E) protein alone (mutants-apo), and the corresponding BRAF(V600E) protein of each ligand. Mutants-apo had larger average protein MSD value than apo. Aknadicine corresponding protein had smaller average protein MSD than the control, but the 16beta-hydroxy-19s-vindolinine N-oxide corresponding protein had larger average value than the control (Figure 6A). This result demonstrated that BRAF and BRAF(V600E) protein alone had different molecular characters. It was evident that although when 16beta-hydroxy-1dolinine N-oxide bound to BRAF(V600E) protein, the larger protein deviation did not affect the stability of the ligand and its complex, which had been described in ligand and complex RMSD.
 | Figure 6 (A) Protein mean square deviation (MSD) and (B) protein gyration radius (Gyrate). |
We drew the trajectory of Gyrate to evaluate the compact degree of apo, mutants-apo, and the corresponding protein of each ligand. Apo had larger average Gyrate value than mutants-apo. The average protein Gyrate of the two candidates was smaller than that of the control (Figure 6B). This result demonstrated that BRAF and BRAF(V600E) protein alone had different character again. It was evident that even single mutation of BRAF protein led to quite different molecular character.
The trajectory of SASA was drawn to show water contact surface of the ligand and its corresponding protein. Apo had larger average protein SASA than mutants-apo. The average ligand SASA value of the two candidates was smaller than that of the control (Figure 7). These results demonstrated that there was another different molecular character between BRAF and BRAF(V600E) protein alone. It was evident that both the candidates had smaller volume or less hydrophobic side chains.
 | Figure 7 Protein (A) and ligand (B) solvent-accessible surface area (SASA). |
We illustrated the graph of total energy to assess the most stable energy needed for apo, mutants-apo, either the candidates or the control when they bound to BRAF(V600E) protein. The most stable total energy for apo or mutants-apo was almost the same. Total energy needed for the control bound with BRAF(V600E) protein was prominently higher than both the candidates (Figure 8). These results demonstrated that BRAF(V600E) protein alone did not change its stability compared to wild-type BRAF protein alone. It was evident that both the candidates could bind to BRAF(V600E) protein more easily than the control.
 | Figure 8 Total energy. SB-590885 had higher peak total energy than aknadicine and 16beta-hydroxy-19s-vindolinine N-oxide. |
Structural variation
Second, we compared the detailed structural or conformational variation for wild-type BRAF, BRAF(V600E) protein, both the candidates, and the control when they bound to BRAF(V600E) protein.
The number matrix of root mean square fluctuation was illustrated to identify the structural similarity from the view of individual residue. The number “1” indicated the highest similarity when we compared two proteins. The relative value between BRAF(V600E) alone (M-apo) and wild-type BRAF (apo) was 0.1225 (Table 3). This result demonstrated that the structural variation of BRAF(V600E) protein was quite prominent.
 | Table 3 Number matrix of root mean square fluctuation (RMSF) for wild-type BRAF alone (apo), BRAF(V600E) alone (M-apo), and the corresponding BRAF(V600E) protein for aknadicine (top1), 16beta-hydroxy-19s-vindolinine N-oxide (top2), and the control (SB-590885) |
We performed principal component analysis to discuss the similarity of two eigenvectors (PC1 and PC2) based on the backbone of BRAF, BRAF(V600E) protein alone, and the corresponding BRAF(V600E) protein of each ligand. Apo and mutants-apo had certain degree of difference in the eigenvectors. Comparison of the candidates or the control with mutants-apo, the eigenvectors only had little difference. There still was prominent difference in the eigenvectors of apo and either the candidates or the control (Figure 9). These results demonstrated that the structural variation of BRAF(V600E) was very meaningful and may be the reason why the patient had poor prognosis of advanced melanoma harboring just single mutation.
 | Figure 9 Principal component analysis. |
Cluster analysis was displayed to show the representative structure of BRAF (apo), BRAF(V600E) (mutants-apo), and the corresponding protein for aknadicine, 16beta-hydroxy-19s-vindolinine N-oxide or the control. We chose 12.14 ns of apo and 17.04 ns of mutants-apo for calculating the diameter of the pocket in which ATP was anchored. The representative structure after 15 ns was chosen for analyzing the binding position between the ligand and its corresponding protein. We chose 18.9, 15.92, and 16.52 ns of aknadicine, 16beta-hydroxy-19s-vindolinine N-oxide, and the control to illustrate the schematic diagram, respectively (Figure 10).
 | Figure 10 Cluster analysis for choosing the representative structure. |
As mentioned in the introduction, Val471, Ala481, Leu514, Thr529, Trp531, and Cys532 formed a pocket in which ATP was anchored. Asp(D)594, Phe(F)595, and Gly(G)596 composed a DFG motif, which determined the inactive or active state of BRAF protein. We illustrated the schematic diagram to explore the diameter change of the pocket in which ATP was anchored in the DFG-out or active state. The diameter of apo at 0 ns and 12.14 ns was 12.818 Å and 15.404 Å, respectively. The diameter of mutants-apo at 0 ns and 17.04 ns was 12.536 Å and 10.518 Å, respectively (Figure 11). This result demonstrated that the ATP pocket of apo became larger during MD, but the pocket of mutants-apo became smaller in contrast. We speculated that the diameter change of ATP pocket amplified the phosphorylation and the metamorphic character of BRAF(V600E) protein.
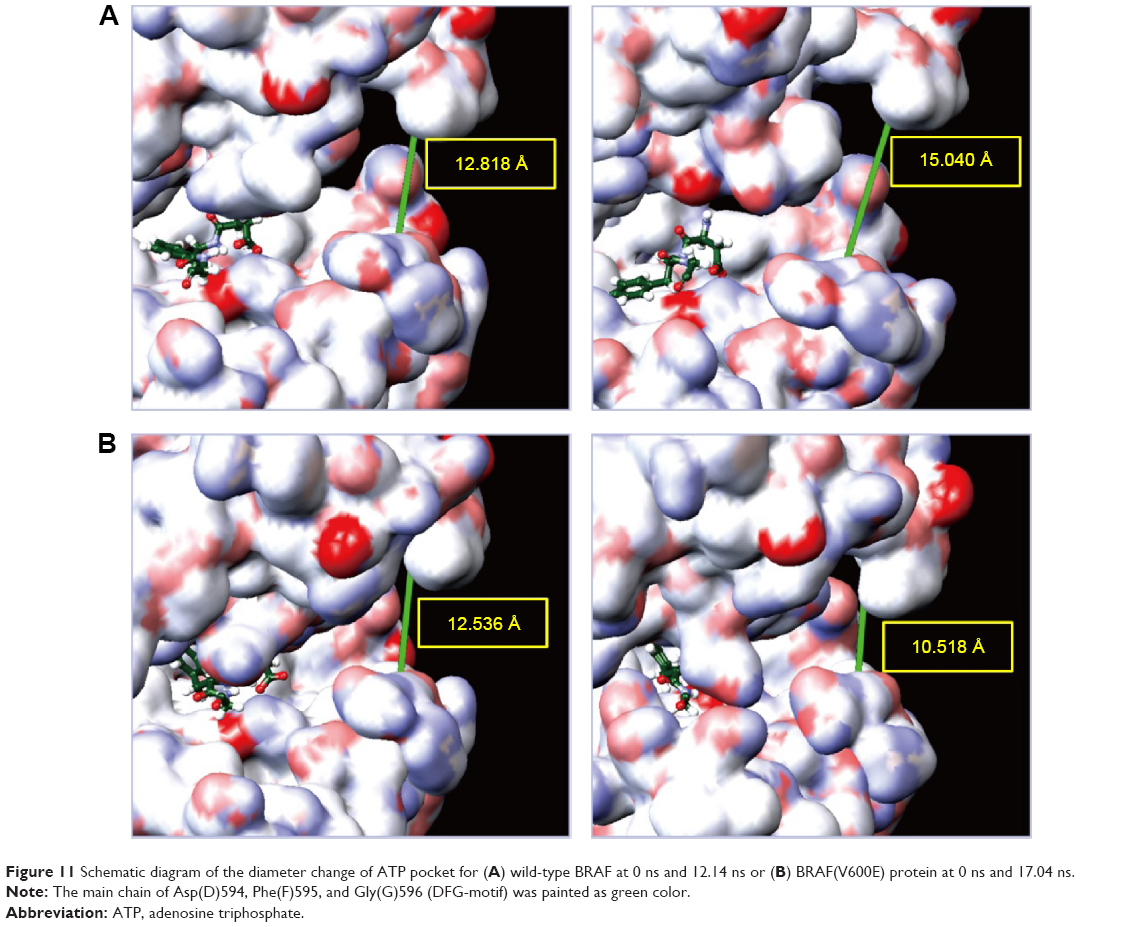 | Figure 11 Schematic diagram of the diameter change of ATP pocket for (A) wild-type BRAF at 0 ns and 12.14 ns or (B) BRAF(V600E) protein at 0 ns and 17.04 ns. |
Occupancy of H-bond between the candidates and the control with BRAF(V600E) protein was shown to explain the dynamic change of H-bond during the period of MD. The control formed more H-bonds with BRAF(V600E) protein than the candidates (Table 4). However, the schematic diagram of binding position between the ligand and its corresponding protein showed that the control had larger deviation than the candidates (Figure 12). This result was consistent with ligand RMSD and demonstrated that H-bonds of the candidates were less than the control, but they were relatively stable when they bound to BRAF(V600E) protein. We speculated that the larger deviation conferred drug resistance to the control or other existed BRAF inhibitors.
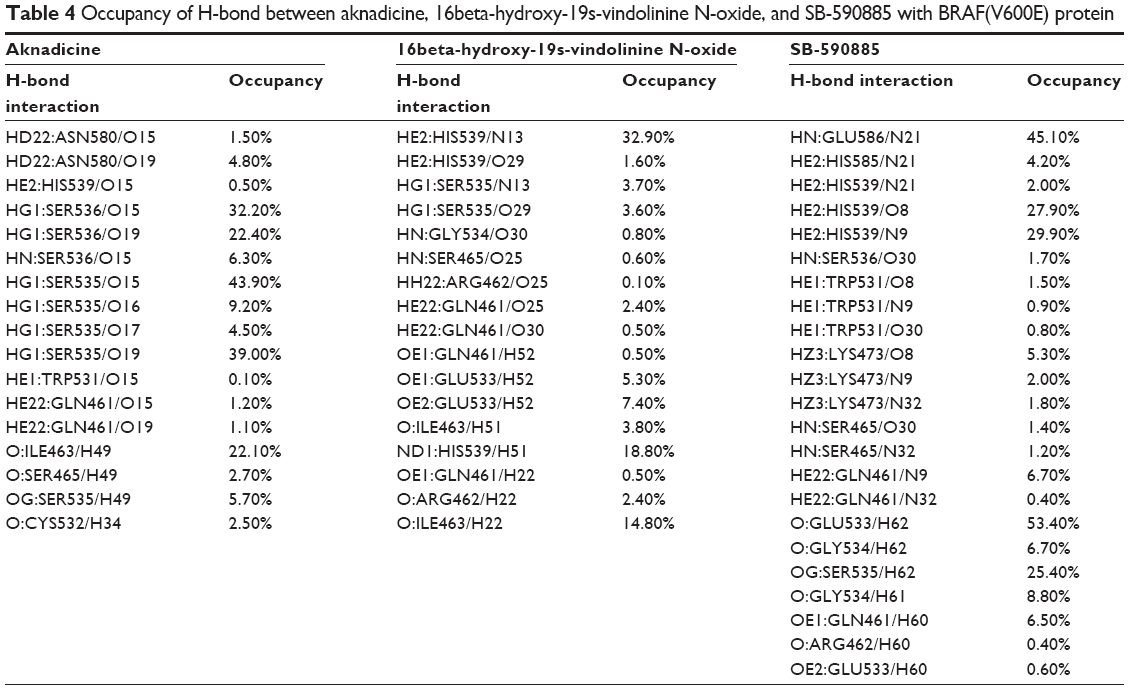 | Table 4 Occupancy of H-bond between aknadicine, 16beta-hydroxy-19s-vindolinine N-oxide, and SB-590885 with BRAF(V600E) protein |
 | Figure 12 Schematic diagram of binding position between the ligand and its corresponding BRAF(V600E) protein. (A) Aknadicine, (B) 16beta-hydroxy-19s-vindolinine N-oxide, and (C) the control. |
Conclusion
Even BRAF(V600E) protein harbored just a single mutation, it had quiet different molecular character from the wild-type BRAF protein as determined by MD simulation, such as MSD, Gyrate, and SASA analysis. As regards the individual residue, BRAF(V600E) had a quite prominent structural or conformational variation than the wild-type BRAF protein by the matrix of root mean square fluctuation and principal component analysis. On the basis of structure-based virtual screening, ligand-based QSAR models, and MD simulation, we recommend aknadicine and 16beta-hydroxy-19s-vindolinine N-oxide to be potent compounds for developing novel inhibitors in the future.
Acknowledgments
This research is supported by grants from China Medical University Hospital and Asia University (DMR-104-118, DMR-104-084, DMR-102-001, Asia102-CMU-1, Asia102-CMU-2, and Asia102-CMU-3), and China Medical University under the Aim for Top University Plan of the Ministry of Education, Taiwan. This study is supported partly by the Taiwan Ministry of Health and Welfare Clinical Trial and Research Center of Excellence (MOHW104-TDU-B-212-113002).
Disclosure
The authors report no conflicts of interest in this work.
References
Johannessen CM, Johnson LA, Piccioni F, et al. A melanocyte lineage program confers resistance to MAP kinase pathway inhibition. Nature. 2013;504(7478):138–142. | ||
Flaherty KT, Puzanov I, Kim KB, et al. Inhibition of mutated, activated BRAF in metastatic melanoma. N Engl J Med. 2010;363(9):809–819. | ||
Davies H, Bignell GR, Cox C, et al. Mutations of the BRAF gene in human cancer. Nature. 2002;417(6892):949–954. | ||
Pollock PM, Harper UL, Hansen KS, et al. High frequency of BRAF mutations in nevi. Nat Genet. 2003;33(1):19–20. | ||
Wojnowski L, Zimmer AM, Beck TW, et al. Endothelial apoptosis in Braf-deficient mice. Nat Genet. 1997;16(3):293–297. | ||
Dibb NJ, Dilworth SM, Mol CD. Switching on kinases: oncogenic activation of BRAF and the PDGFR family. Nat Rev Cancer. 2004;4(9):718–727. | ||
Hartsough E, Shao Y, Aplin AE. Resistance to RAF inhibitors revisited. J Invest Dermatol. 2014;134(2):319–325. | ||
Ribas A, Flaherty KT. BRAF targeted therapy changes the treatment paradigm in melanoma. Nat Rev Clin Oncol. 2011;8(7):426–433. | ||
Bollag G, Tsai J, Zhang J, et al. Vemurafenib: the first drug approved for BRAF-mutant cancer. Nat Rev Drug Discov. 2012;11(11):73–886. | ||
Morita H, Nagai R. Vemurafenib in melanoma with BRAF V600E mutation. N Engl J Med. 2011;365(15):1448. author reply 1450. | ||
Chapman PB, Hauschild A, Robert C, et al; BRIM-3 Study Group. Improved survival with vemurafenib in melanoma with BRAF V600E mutation. N Engl J Med. 2011;364(26):2507–2516. | ||
Sosman JA, Kim KB, Schuchter L, et al. Survival in BRAF V600-mutant advanced melanoma treated with vemurafenib. N Engl J Med. 2012;366(8):707–714. | ||
Hauschild A, Grob JJ, Demidov LV, et al. Dabrafenib in BRAF-mutated metastatic melanoma: a multicentre, open-label, phase 3 randomised controlled trial. Lancet. 2012;380(9839):358–365. | ||
Falchook G, Long G, Kurzrock R, et al. RAF inhibitor dabrafenib (GSK2118436) is active in melanoma brain metastases, multiple BRAF genotypes and diverse cancers. Lancet. 2012;379(9829):1893. | ||
Weeraratna AT. RAF around the edges – the paradox of BRAF inhibitors. N Engl J Med. 2012;366(3):271–273. | ||
Margolin K. BRAF inhibition and beyond in advanced melanoma. Lancet. 2012;380(9839):320–322. | ||
Solit DB, Rosen N. Resistance to BRAF inhibition in melanomas. N Engl J Med. 2011;364(8):772–774. | ||
Gibney GT, Sondak VK. Extending the reach of BRAF-targeted cancer therapy. Lancet. 2012;379(9829):1858–1859. | ||
Johannessen CM, Boehm JS, Kim SY, et al. COT drives resistance to RAF inhibition through MAP kinase pathway reactivation. Nature. 2010;468(7326):968–972. | ||
Poulikakos PI, Zhang C, Bollag G, Shokat KM, Rosen N. RAF inhibitors transactivate RAF dimers and ERK signalling in cells with wild-type BRAF. Nature. 2010;464(7287):427–430. | ||
Poulikakos PI, Persaud Y, Janakiraman M, et al. RAF inhibitor resistance is mediated by dimerization of aberrantly spliced BRAF(V600E). Nature. 2011;480(7377):387–390. | ||
Corcoran RB, Dias-Santagata D, Bergethon K, Iafrate AJ, Settleman J, Engelman JA. BRAF gene amplification can promote acquired resistance to MEK inhibitors in cancer cells harboring the BRAF V600E mutation. Sci Signal. 2010;3(149):ra84. | ||
Nazarian R, Shi H, Wang Q, et al. Melanomas acquire resistance to B-RAF(V600E) inhibition by RTK or N-RAS upregulation. Nature. 2010;468(7326):973–977. | ||
Heidorn SJ, Milagre C, Whittaker S, et al. Kinase-dead BRAF and oncogenic RAS cooperate to drive tumor progression through CRAF. Cell. 2010;140(2):209–221. | ||
Rajagopalan H, Bardelli A, Lengauer C, Kinzler KW, Vogelstein B, Velculescu VE. Tumorigenesis: RAF/RAS oncogenes and mismatch-repair status. Nature. 2002;418(6901):934. | ||
Xing F, Persaud Y, Pratilas CA, et al. Concurrent loss of the PTEN and RB1 tumor suppressors attenuates RAF dependence in melanomas harboring (V600E)BRAF. Oncogene. 2012;31(4):446–457. | ||
Bollag G, Hirth P, Tsai J, et al. Clinical efficacy of a RAF inhibitor needs broad target blockade in BRAF-mutant melanoma. Nature. 2010;467(7315):596–599. | ||
Cutler RE Jr, Stephens RM, Saracino MR, Morrison DK. Autoregulation of the Raf-1 serine/threonine kinase. Proc Natl Acad Sci U S A. 1998;95(16):9214–9219. | ||
Wan PT, Garnett MJ, Roe SM, et al; Cancer Genome Project. Mechanism of activation of the RAF-ERK signaling pathway by oncogenic mutations of B-RAF. Cell. 2004;116(6):855–867. | ||
Hodis E, Watson IR, Kryukov GV, et al. A landscape of driver mutations in melanoma. Cell. 2012;150(2):251–263. | ||
Pierotti MA, Tamborini E, Negri T, Pricl S, Pilotti S. Targeted therapy in GIST: in silico modeling for prediction of resistance. Nat Rev Clin Oncol. 2011;8(3):161–170. | ||
Wagle N, Emery C, Berger MF, et al. Dissecting therapeutic resistance to RAF inhibition in melanoma by tumor genomic profiling. J Clin Oncol. 2011;29(22):3085–3096. | ||
Tsai J, Lee JT, Wang W, et al. Discovery of a selective inhibitor of oncogenic B-Raf kinase with potent antimelanoma activity. Proc Natl Acad Sci U S A. 2008;105(8):3041–3046. | ||
Tang H-C, Chen Y-C. Molecular insight and resolution for tumors harboring the H-ras (G12V) mutation. RSC Adv. 2015;5(27):20623–20633. | ||
Lin TY, Fan CW, Maa MC, Leu TH. Lipopolysaccharide-promoted proliferation of Caco-2 cells is mediated by c-Src induction and ERK activation. Biomedicine (Taipei). 2015;5(1):5. | ||
Liu SP, Hsu CY, Fu RH, et al. Sambucus williamsii induced embryonic stem cells differentiated into neurons. Biomedicine (Taipei). 2015; 5(1):3. | ||
Tang HC, Chen CY. Drug design of cyclin-dependent kinase 2 inhibitor for melanoma from traditional Chinese medicine. Biomed Res Int. 2014;2014:798742. | ||
Chen HX, Lai CH, Hsu HY, et al. The bacterial interactions in the nasopharynx of children receiving adenoidectomy. Biomedicine (Taipei). 2015;5(1):6. | ||
Chen CY. TCM Database@Taiwan: the world’s largest traditional Chinese medicine database for drug screening in silico. PLoS One. 2011;6(1):e15939. | ||
Kong X, Qin J, Li Z, et al. Development of a novel class of B-Raf(V600E)-selective inhibitors through virtual screening and hierarchical hit optimization. Org Biomol Chem. 2012;10(36):7402–7417. | ||
Park H, Choi H, Hong S. Identification of novel BRAF kinase inhibitors with structure-based virtual screening. Bioorg Med Chem Lett. 2011; 21(19):5753–5756. | ||
Luo C, Xie P, Marmorstein R. Identification of BRAF inhibitors through in silico screening. J Med Chem. 2008;51(19):6121–6127. | ||
King AJ, Patrick DR, Batorsky RS, et al. Demonstration of a genetic therapeutic index for tumors expressing oncogenic BRAF by the kinase inhibitor SB-590885. Cancer Res. 2006;66(23):11100–11105. | ||
Chen CY. Weighted equation and rules – a novel concept for evaluating protein-ligand interaction. J Biomol Struct Dyn. 2009;27(3):271–282. | ||
Ménard D, Niculescu-Duvaz I, Dijkstra HP, et al. Novel potent BRAF inhibitors: toward 1 nM compounds through optimization of the central phenyl ring. J Med Chem. 2009;52(13):3881–3891. | ||
Chen CY. A novel integrated framework and improved methodology of computer-aided drug design. Curr Top Med Chem. 2013;13(9):965–988. | ||
Pronk S, Páll S, Schulz R, et al. GROMACS 4.5: a high-throughput and highly parallel open source molecular simulation toolkit. Bioinformatics. 2013;29(7):845–854. |
 © 2015 The Author(s). This work is published and licensed by Dove Medical Press Limited. The
full terms of this license are available at https://www.dovepress.com/terms
and incorporate the Creative Commons Attribution
- Non Commercial (unported, 3.0) License.
By accessing the work you hereby accept the Terms. Non-commercial uses of the work are permitted
without any further permission from Dove Medical Press Limited, provided the work is properly
attributed. For permission for commercial use of this work, please see paragraphs 4.2 and 5 of our Terms.
© 2015 The Author(s). This work is published and licensed by Dove Medical Press Limited. The
full terms of this license are available at https://www.dovepress.com/terms
and incorporate the Creative Commons Attribution
- Non Commercial (unported, 3.0) License.
By accessing the work you hereby accept the Terms. Non-commercial uses of the work are permitted
without any further permission from Dove Medical Press Limited, provided the work is properly
attributed. For permission for commercial use of this work, please see paragraphs 4.2 and 5 of our Terms.