Back to Journals » Pharmacogenomics and Personalized Medicine » Volume 12
Inconsistency in race and ethnic classification in pharmacogenetics studies and its potential clinical implications
Authors Zhang F ![]() , Finkelstein J
, Finkelstein J ![]()
Received 3 March 2019
Accepted for publication 30 May 2019
Published 2 July 2019 Volume 2019:12 Pages 107—123
DOI https://doi.org/10.2147/PGPM.S207449
Checked for plagiarism Yes
Review by Single anonymous peer review
Peer reviewer comments 2
Editor who approved publication: Dr Martin H Bluth
Frederick Zhang,1 Joseph Finkelstein2
1Center for Bioinformatics and Data Analytics, Columbia University Irving Medical Center, New York, NY, USA; 2Department of Population Health Science and Policy, Icahn School of Medicine at Mount Sinai, New York, NY, USA
Introduction: Racial and ethnic categories are frequently used in pharmacogenetics literature to stratify patients; however, these categories can be inconsistent across different studies. To address the ongoing debate on the applicability of traditional concepts of race and ethnicity in the context of precision medicine, we aimed to review the application of current racial and ethnic categories in pharmacogenetics and its potential impact on clinical care.
Methods: One hundred and three total pharmacogenetics papers involving the CYP2C9, CYP2C19, and CYP2D6 genes were analyzed for their country of origin, racial, and ethnic categories used, and allele frequency data. Correspondence between the major continental racial categories promulgated by National Institutes of Health (NIH) and those reported by the pharmacogenetics papers was evaluated.
Results: The racial and ethnic categories used in the papers we analyzed were highly heterogeneous. In total, we found 66 different racial and ethnic categories used which fall under the NIH race category “White”, 47 different racial and ethnic categories for “Asian”, and 62 different categories for “Black”. The number of categories used varied widely based on country of origin: Japan used the highest number of different categories for “White” with 17, Malaysia used the highest number for “Asian” with 24, and the US used the highest number for “Black” with 28. Significant variation in allele frequency between different ethnic subgroups was identified within 3 major continental racial categories.
Conclusion: Our analysis showed that racial and ethnic classification is highly inconsistent across different papers as well as between different countries. Evidence-based consensus is necessary for optimal use of self-identified race as well as geographical ancestry in pharmacogenetics. Common taxonomy of geographical ancestry which reflects specifics of particular countries and is accepted by the entire scientific community can facilitate reproducible pharmacogenetic research and clinical implementation of its results.
Keywords: pharmacogenetics, single nucleotide polymorphism, ethnic differences, drug responsiveness
Introduction
In the era of precision medicine, pharmacogenetics and pharmacogenomics have emerged as fields which seek to optimize drug therapy toward patients based on their individual genetic characteristics.1 Drug metabolism and dosage can vary widely between different individuals, so an individual’s genetic profile can be crucial for providing optimal drug therapy. A number of genes have already been identified as part of US Food and Drug Administration (FDA) guidelines for clinical care.2 Among these, the cytochrome P450 (CYP450) genes have been identified as some of the most important for the delivery of personalized drug therapy.3
The CYP450 enzymes have been estimated to mediate the phase I metabolism of 70–80% of all clinically used drugs.3 Several CYP450 genes have been labeled by the FDA as actionable pharmacogenes which are present on drug labels.4 For example, the CYP2C9 gene has been implicated in the metabolism of warfarin and fluvastatin, among other drugs, while CYP2C19 has been linked to the metabolism of clopidogrel.5,6 Alleles in these genes are linked to different phenotypes which can affect the metabolism and therefore dosing of certain drugs. In CYP2C9, two single-nucleotide polymorphisms (SNPs), which are commonly referred to as the CYP2C9 *2 and *3 alleles, have been linked to the warfarin “poor metabolizer” phenotype.5 Similar alleles and corresponding SNPs have been identified for other CYP450 genes.3 Understanding the interaction between these genes and clinically used drugs in order to provide guidelines for providers is the primary target for pharmacogenetics research.
In the current era of precision medicine, the field of pharmacogenetics is becoming increasingly important in guiding clinical decisions.52 However, currently, pharmacogenetics testing in the clinical setting is not widespread for a variety of reasons. Results of tests can have long turnaround times which can limit their clinical utility.53 In addition, these genetic tests may be prohibitively expensive to conduct or may not even be available in areas with less developed infrastructure or in low-resource countries.54 In case of emergency or acute care settings, individual pharmacogenetic profile may not be readily available though it was shown to be very useful for medication regimen optimization,55 especially in patients with polypharmacy.56 In such cases, use of self-reported racial identity or geographical ancestry may be instrumental in implementing clinical decision support for initial pharmacogenetic-driven medication prescription.57 As technology and medical infrastructure evolve, the ideal of standard genotyping for every patient may come to fruition in the near future. In the meantime, it is necessary to investigate other, more accessible biomarkers for their utility in guiding clinical decision-making.58 For this reason, race and ethnicity have become the subject of intense research for use as potential biomarkers which can serve as adjuncts to genotyping tests in the clinical setting.59
A number of drugs have already been discovered to have different responses in populations of different racial composition.60,61 For example, in warfarin dosing, the average effective dose needed has been found to vary based on race, so recent studies have proposed using ethnicity as a variable in warfarin dosing algorithms.62–64 Several antihypertensive drugs have also been implicated to have different responses based on race. In a large clinical trial comparing losartan, an Angiotensin Receptor Blocker, to atenolol, a β-blocker, a black population was found to have better clinical outcomes when treated with atenolol, while non-black populations were found to have better clinical outcomes when treated with losartan.64,65 Clinical trials for the antihypertensive drug BiDil found that the drug was effective only in black populations, leading to the drug receiving FDA approval for use in black populations only.66–68 Although the literature has identified these patterns in differing drug responses between populations of different racial backgrounds, the mechanism for these differences is still poorly understood. For this reason, pharmacogenetics research on race and ethnicity has sought to provide one potential explanation for these phenomena. A proposed mechanism for these racial differences in drug response is the discovery of patterns of pharmacogenetic allele distribution amongst different ethnic and racial groups. Studies have found that some minor alleles are extremely rare (<1% prevalence) in some ethnic groups but can be found at a relatively common rate in others.69–72 For example, the CYP2C9 *2 allele has a prevalence of less than 1% in Chinese populations but can reach a prevalence of up to 19% in certain European populations.73–75 As a result, a significant amount of research has gone into further understanding the differences in pharmacogene expression between different races and ethnicities.
Nonetheless, research into race and ethnicity remain controversial issues, with some questioning its utility in clinical practice.76 In particular with regard to genetics, the traditional understanding and classification of race has been called into question. The traditional ideology of race as distinct, discrete categories such as “White” and “Black” is now regarded by many as a social construction, rather than a biological one.77,78 Genetic differences within populations are complicated and often fall on a spectrum, particularly in populations such as African-Americans in the US, who have experienced varying degrees of admixture across generations.79–81 Nonetheless, in lieu of widespread genotyping for the reasons described above, race and ethnicity remain one of the few readily accessible insights into a patient’s possible genetic risk factors in the clinical setting. For this reason, it is important to refine the usage of race and ethnicity as biomarkers in order to effectively serve the goals of precision medicine.
A major obstacle in producing translatable research regarding race and ethnicity is the lack of consensus on racial and ethnic categories to use and how to classify individuals of different ethnicities.82 Some countries establish national guidelines for how to classify race and ethnicity in medical research; even so, these guidelines can vary widely between countries. In the US, the National Institutes of Health (NIH) have defined several broad racial and ethnic categories for researchers to use in their studies.83 These categories include terms referring to major continental populations such as “White”, “Black”, “Asian”, etc.64 However, a high degree of ethnic heterogeneity exists within each of these main categories. For example, the category “Asian” can be further divided into the subcategories “East Asian” and “South Asian”.82 This creates difficulty in ethnicity-based pharmacogenetics research, as the categories of race and ethnicity used vary widely between different researchers.82,84 This inconsistency in specificity of race and ethnic classification can prevent the results from being translated into the clinic accurately. We are concerned that lack of specificity in racial and ethnic categorization can cause overgeneralization of results which may break down when examining certain ethnic minorities within the broader racial category. In addition, the use of overly broad racial categories and the lack of standardization in race and ethnicity-based research run counter to the aims of precision medicine.
In this study, we aimed to examine the different racial and ethnic categories used in pharmacogenetic studies and how inconsistency in categorization could have clinical consequences. In order to do so, we conducted a literature review of pharmacogenetics studies published between May 2015 and July 2018. Using this method, we (i) categorized the different racial and ethnic categories used in pharmacogenetics studies, (ii) examined how racial and ethnic category use may vary between studies published by authors from different countries, and (iii) examined the genetic heterogeneity present within broad continental racial categories for certain CYP2C9, CYP2C19, and CYP2D6 alleles.
Methods
Analysis of number of ethnic categories
We searched the PubMed database using the following Boolean search term: (pharmacogenetics OR pharmacogenomics) AND (race OR ethnicity) AND (cyp2c9 OR cyp2D6 OR cyp2c19). We filtered the results to show results only from May 2015 to July 2018 to focus on the scope of our analysis. Using this search term, we found 88 initial results. We then used the following inclusion criteria for studies to be included:
- The study had to analyze the frequency of CYP2C9, CYP2C19, or CYP2D6 alleles within a human population.
- The study had to stratify their study population using racial or ethnic categories or specify the race or ethnicity of the population being studied if there is only one category.
- The racial or ethnic categories examined in the papers had to fall under at least one of the 3 following NIH defined racial categories: White, Black, or Asian as defined by the “Racial and Ethnic Categories and Definitions for NIH Diversity Programs and for Other Reporting Purposes” NIH guideline.83 Thus, studies exclusively examining racial or ethnic groups such as Hispanics or American Indians were excluded to be addressed in further reviews.
- Case reports, case series, and expert opinions were excluded. All other study designs which fit the other criteria, including systematic reviews and meta-analyses, were included.
After analyzing the search results by study title and abstract, we found 60 papers to include in our initial review. We then examined the citations of these papers and added an additional 43 papers to our analysis using the same inclusion criteria. For the papers found in the citations, we allowed papers published before May 2015 to be included. We did this so that all racial and ethnic categories drawn from cited papers could be compared to the racial and ethnic categories used in the original source. In total, 103 papers were included for this analysis. As the terms “White” and “Caucasian” had been used interchangeably in literature, articles with both terms were included in the final analysis and both terms have been used in this report.
We then classified these papers by country of origin of the 1st author and examined the ethnic categories they used. An ethnic category was defined as any label used to stratify the populations being studied by geographic, cultural, linguistic, or genetic characteristics for which allele prevalence data was present or was otherwise used as a comparison variable. This included ethnic categories which were cited from other papers. Ethnic categories mentioned outside of the Results or Methods sections were excluded in order to restrict the study to terminology which was included in the primary analysis of the study. We classified each category as Caucasian, Black, or Asian using the NIH definitions noted above. We limited our analysis to these three racial categories as they are the most highly investigated in the literature. Although Hispanic populations represent an important racial minority, particularly in the US, they remain heavily underrepresented in medico-scientific study and were thus excluded from this review.85 Ethnic categories which could not be precisely classified to just one of the three above categories such as “Other” or “North American” were excluded. The full details of each study included, such as the countries of origin and the ethnic categories used, can be found in Table S1. We then examined the number of unique race/ethnicity categories used for each of the three major NIH racial categories being analyzed in this study by different countries. In order to exclude countries which had limited representation, we only included countries which had four or more papers within our sample for this analysis.
Using the information contained within the papers as well as supplemental literature, we created three charts, one for each NIH category, which show the variety of different ethnic categories used in the papers as well as how they can be categorized relative to each other. The charts for “Asian” ethnic categories can be found in Figure 1, “Caucasian” in Figure 2 and “Black” in Figure 3. Not all ethnic categories were included in the charts; if an accurate categorization for an ethnic category could not be found or if the categorization lacked a consensus in the literature, the category was excluded from the chart. In addition, a few were excluded for clarity and ease of visualization. Racial and ethnic identity is a sensitive and controversial issue; therefore, these charts are not intended to be definitive classifications of these ethnic categories. They are intended for the visualization of the complexity of ethnic categorization in pharmacogenetics literature and only reflect how these ethnic categories were classified in the literature we reviewed. A full list of ethnic categories included in this study can be found in Table S2.
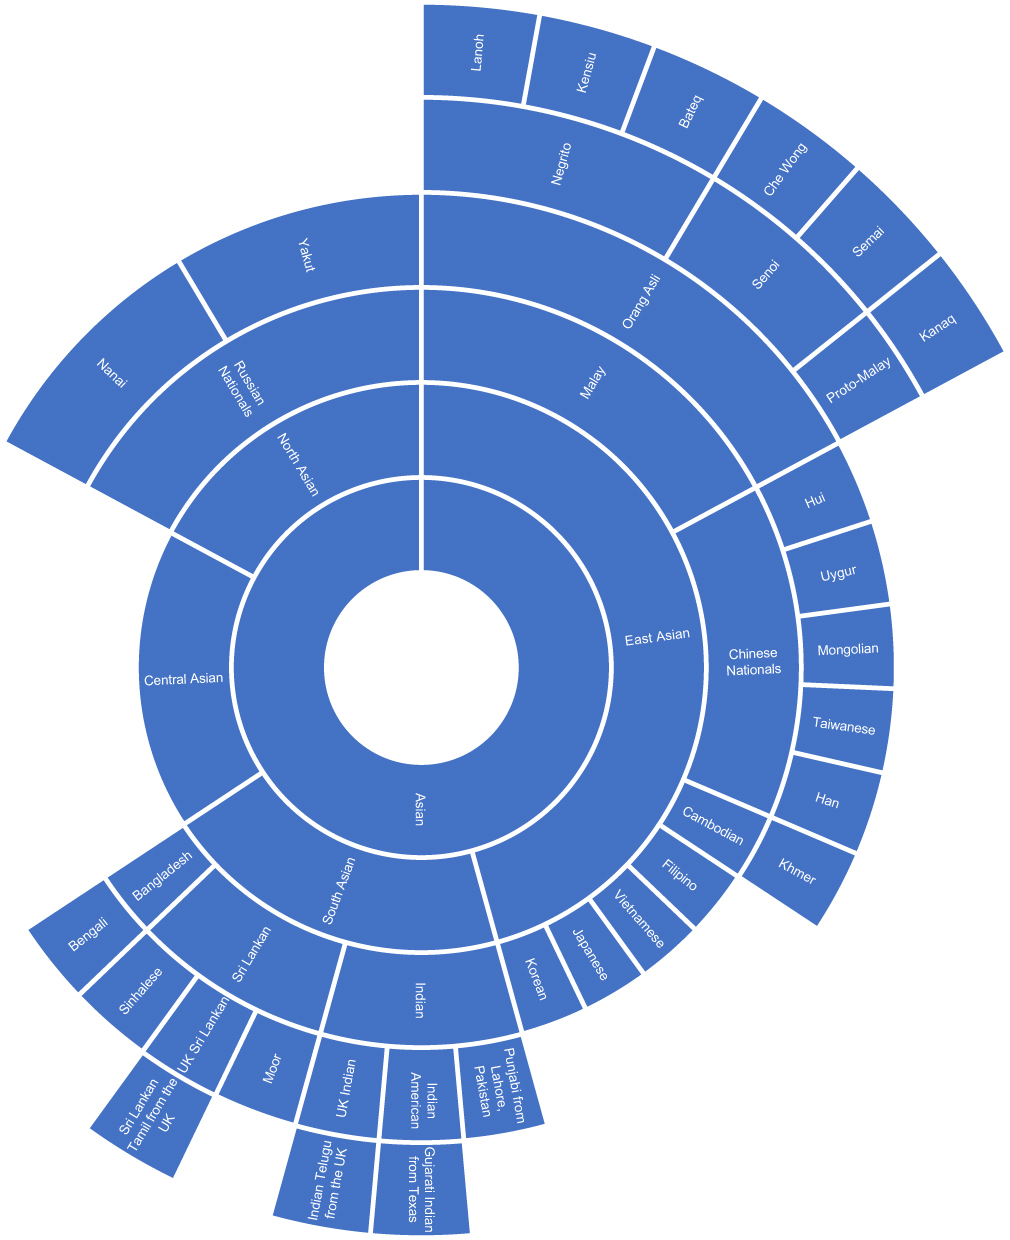 |
Figure 1 Chart of ethnic categories which fall under the NIH term of “Asian”. Note: Data from references 7, 8, 10, 12, 14, 16, 28, 37, 41, 42, 48, 51, 71–73, 87–90. |
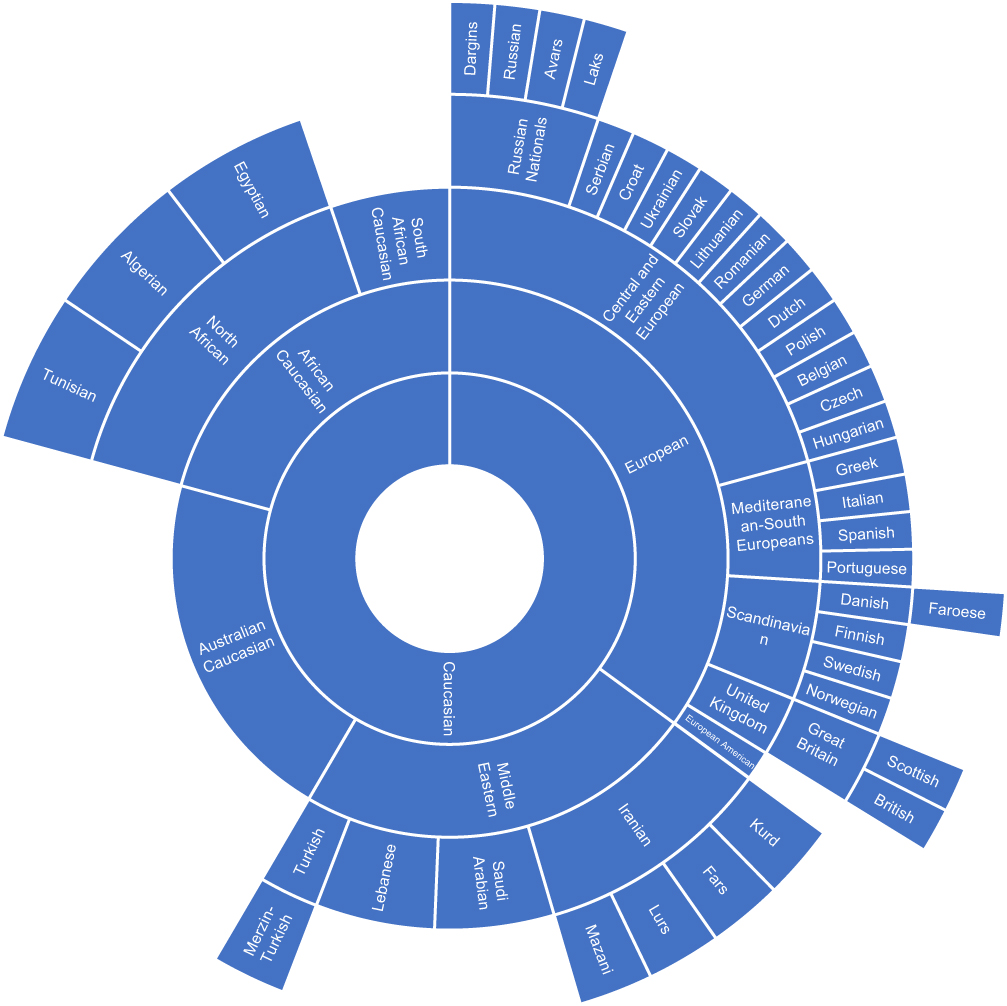 |
Figure 2 Chart of ethnic categories which fall under the NIH term of “Caucasian”. Note: Data from references 9, 11, 13, 18, 20–26, 28, 34, 37, 42–45, 70, 75, 87, 91–94, 128. |
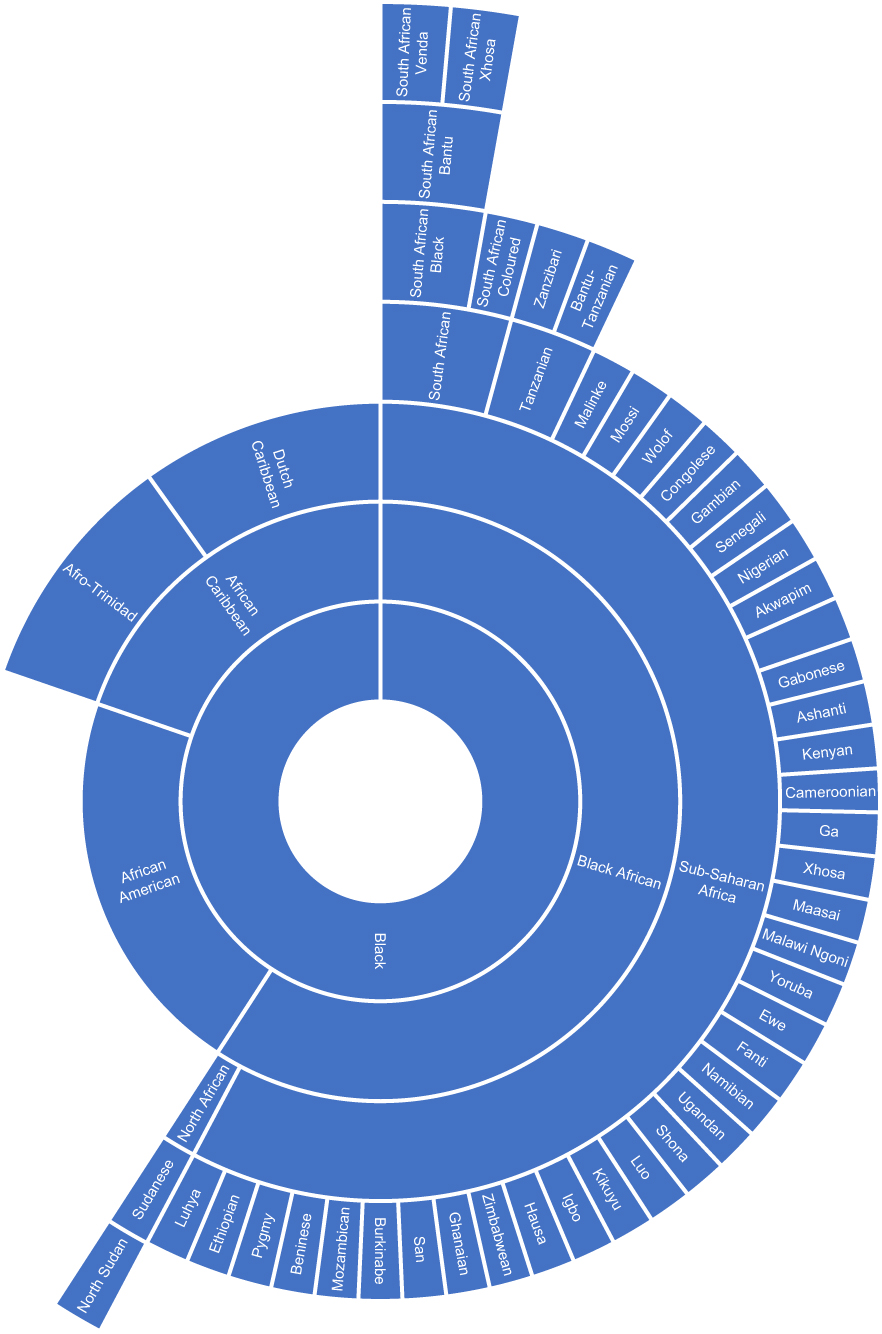 |
Figure 3 Chart of ethnic categories which fall under the NIH term of “Black”. Note: Data from references 11, 15, 16, 19, 26–33, 35–37, 40, 46, 47, 49, 50, 70, 75, 79, 87, 94–97, 129, 130. |
Analysis of racial/ethnic differences in cytochrome P450 allele prevalence
For our analysis, we chose to analyze the CYP2C9 *2 and *3 alleles, the CYP2C19 *2, *3, and *17 alleles, and the CYP2D6 *4 and *17 alleles. These alleles were chosen because they are classified as actionable pharmacogenes by the Phamacogenomics Knowledgebase (PharmGKB) with Level 1A evidence and have a large amount of literature examining their prevalence in different populations.86 The allele frequency data for several broad ethnic groups was first extracted from the Clinical Pharmacogenetics Implementation Consortium (CPIC) website.87 We then compared this data to allele frequency data extracted from the papers included in our racial category analysis but with the following additional inclusion criteria:
- The population sample had to be healthy volunteers or otherwise described as members of the general population.
- The population sample had to include at least 20 members.
- Study populations which did not stratify their population further than the CPIC racial categories (eg divided their population into Caucasian and African-American only) were not included.
The study populations were assumed to be unrelated. The allele frequencies were found using a variety of genotyping methodologies, including PCR and whole genome sequencing. The allele frequency was extracted or calculated from the data in the paper, and the ethnic category was used as defined by the original study. We summarized the ethnic groups whose allele frequency varied from their broader CPIC ethnic groups in Table 2. The full table of all allele frequency data across all groups can be found in Table S3.
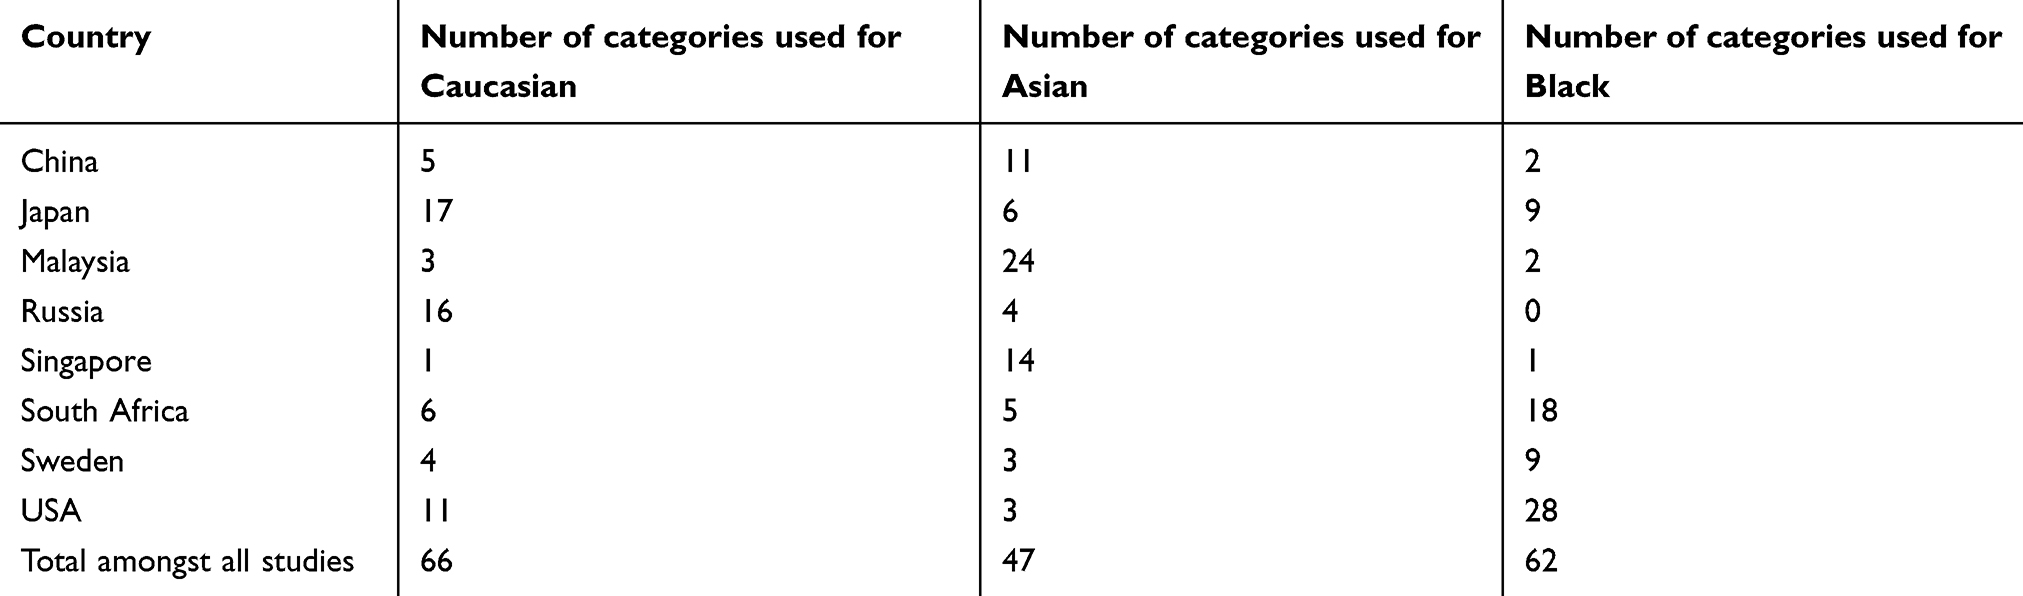 |
Table 1 Number of racial and ethnic categories used for eight selected countries |
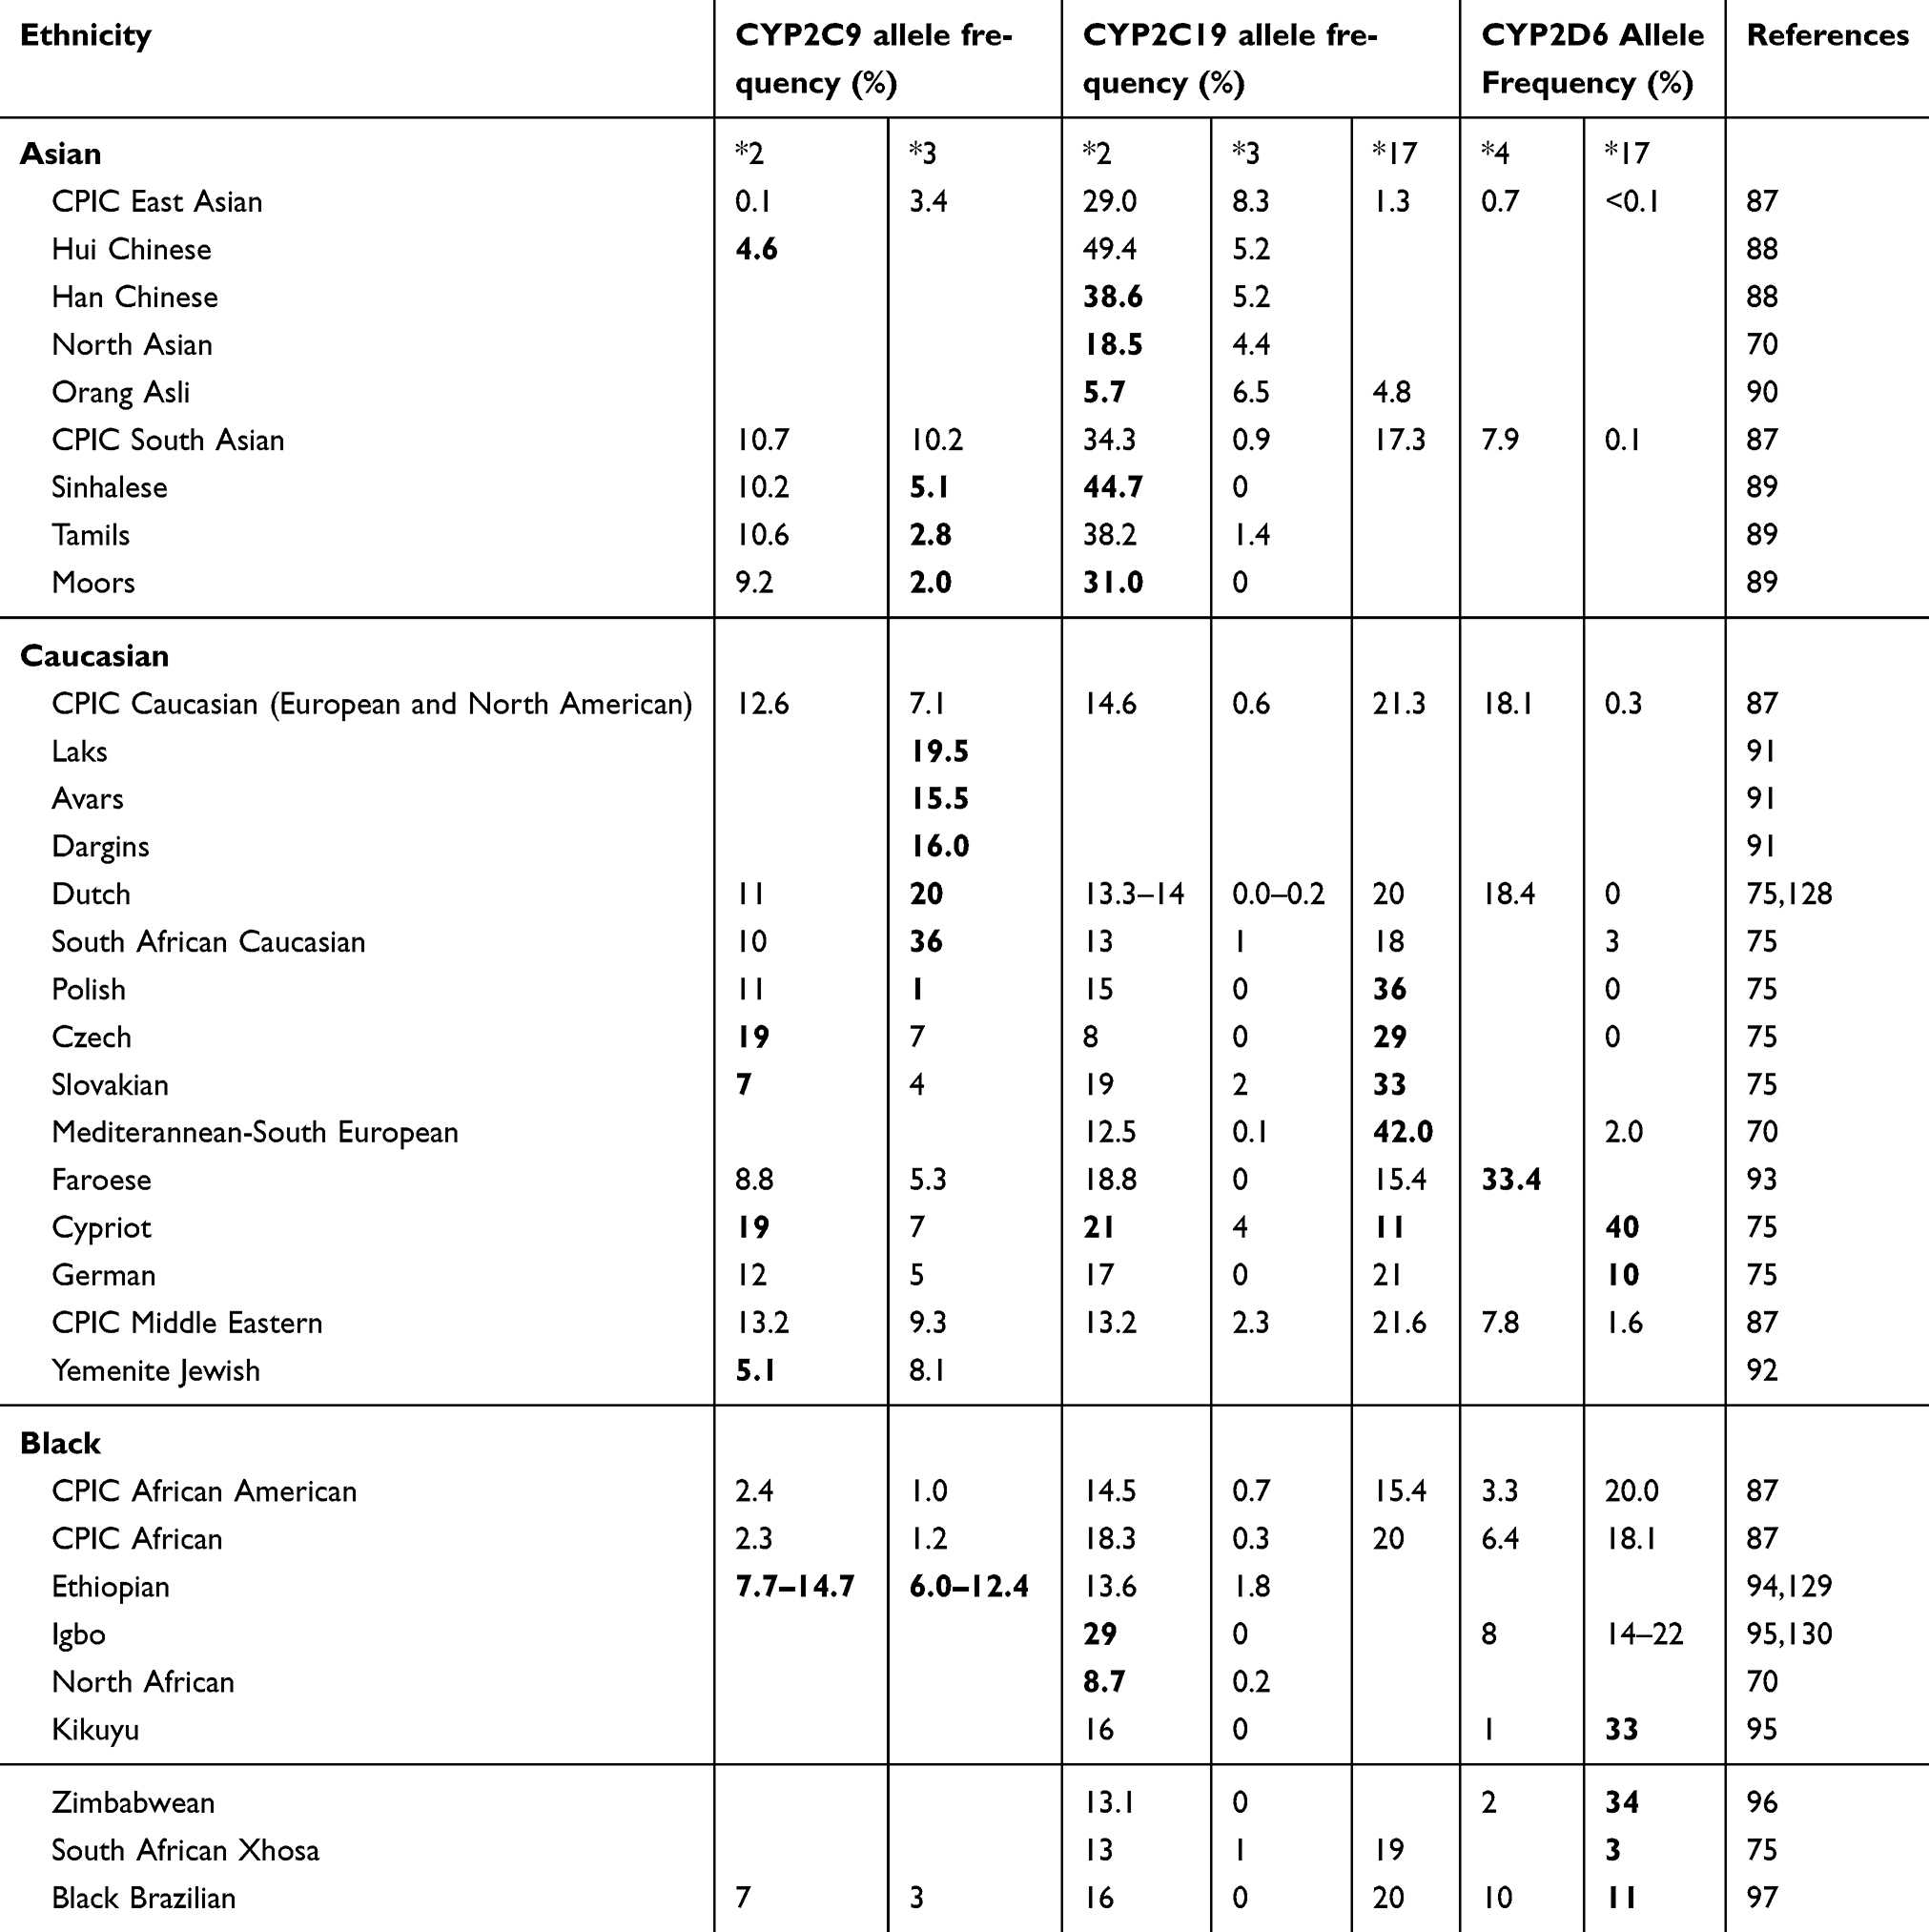 |
Table 2 Allele frequency data for ethnic categories which showed a significant deviation from CPIC categories |
Results
Number of ethnic categories used
In total, we found 66 different ethnic categories used which would be classified as “Caucasian” under NIH guidelines, 49 different ethnic categories for “Asian”, and 62 different categories for “Black”. Our analysis included papers published by authors from 31 different countries. The analysis for the individual number of categories for 8 countries which were selected using the criteria specified above can be found in Table 1.
A high degree of heterogeneity was found in the number of ethnic categories used for each major NIH category between different countries. For categories falling under “Caucasian”, Japan had the highest number of different categories at 17, while Singapore had the fewest at 1. For categories falling under “Asian”, Malaysia had the highest number of different categories at 24, while Sweden and the US had the fewest at 3. Finally, for categories falling under “Black”, the US had the highest number of different categories at 28, while Russia had 0 categories due to having no studies involving blacks in our sample.
The categorization relationships between the ethnic categories for “Asian”, “Caucasian”, and “Black” can be seen in Figures 1–3, respectively. The classification of different ethnic categories appears to be highly heterogeneous. Ethnic categories were defined by race, skin color, continent, region, religion, nationality, language, and several other methods.
Ethnic differences in CYP2C9, CYP2C19, and CYP2D6 allele prevalence between Asians
The allele prevalence for selected ethnic groups whose frequencies varied from their broader CPIC racial group’s allele frequency can be found in Table 2. The allele prevalence for all ethnic groups examined in this study can be found in Table S3. The CPIC defined two major groups which could be considered as “Asian” under NIH guidelines: East Asians and South/Central Asians. For CYP2C9 alleles, East Asians have a much lower prevalence of the *2 allele (0.1%) compared to South/Central Asians (10.7%) as well as the *3 allele (3.4% in East Asians compared to 10.2% in South/Central Asians) in the CPIC data.87 The Hui minority of China (4.6%) had a much higher prevalence of the *2 allele compared to other East Asians.88 Three ethnic populations in Sri Lanka, the Sinhalese, Tamil, and Moors, had similar *2 allele frequency (10.2%, 10.6%, and 9.2%, respectively) as South/Central Asians but lower *3 allele frequency (5.1% for Sinhalese, 2.8% for Tamil, and 2.0% for Moors) which was more comparable to East Asians.89
For CYP2C19 alleles, East Asians had similar prevalence of the *2 allele as South/Central Asians (29.0% to 34.3%, respectively), but higher prevalence of the *3 allele (8.3% to 0.9%, respectively) and lower prevalence of the *17 allele (1.3% to 17.3%, respectively) in the CPIC data.87 Both a Han Chinese population and a Hui Chinese population showed a higher prevalence of the *2 allele than other East Asians (38.6% and 49.4%, respectively).88 A Sinhalese population also showed a higher prevalence of the *2 allele (44.7%).89 A North Asian population and an Orang Asli indigenous population of Malaysia showed lower *2 allele prevalence (18.5% and 5.7%, respectively) than either East Asians or South/Central Asians.70,90
For CYP2D6 alleles, the *4 allele was less prevalent in East Asians compared to South/Central Asians (0.65% to 7.87%, respectively) and the *17 allele was rare in both (<1% for both) in the CPIC data.87 All populations were within a few percentage points of these categories for these alleles.
Ethnic differences in CYP2C9, CYP2C19, and CYP2D6 allele prevalence between Caucasians
The CPIC defined two major groups which could be considered “White” or “Caucasian” under NIH guidelines: Caucasian (European and North American) and Middle Eastern. For the CYP2C9 *2 and *3 alleles, these two populations have a fairly similar prevalence using the CPIC data (12.6% for Caucasians and 13.2% for Middle Easterners for the *2 allele; 7.1% for Caucasians and 9.3% for Middle Easterners for the *3 allele).87 A few ethnic categories showed notable differences from these CYP2C9 allele frequencies. The Lak, Avar, and Dargin ethnic minorities of Russia showed a higher prevalence of the CYP2C9 *3 allele (19.5%, 15.5%, and 16%, respectively), while for the CYP2C9 *2 allele a Czech population (19%) and a Cypriot population (19%) showed higher frequency.75,91 Both a Slovakian population and a Yemenite Jewish population had a lower frequency of the CYP2C9 *2 allele (7% and 5.1%, respectively).70,75,92 A Dutch population and a South African Caucasian population showed a higher prevalence of the *3 allele (20% and 36%, respectively), while a Polish population (1%) showed a lower prevalence.75
For CYP2C19 alleles, the prevalence was also similar between Caucasians and Middle Easterners in the CPIC data (14.6% for Caucasians and 13.2% for Middle Easterners for the *2 allele, 0.6% for Caucasians and 2.3% for Middle Easterners for the *3 allele, and 21.3% for Caucasians and 21.6% for Middle Easterners for the *17 allele).87 A Cypriot population showed a higher frequency of the *2 allele (21%) and a lower frequency of the *17 allele (11%).75 A Czech population showed lower frequency of the *2 allele (8%) but higher frequency of the *17 allele (29%).75 A Polish population, a Slovakian population, and a Mediterranean-South European population also showed a higher frequency of the *17 allele (36%, 33%, and 42%, respectively).70,75
For CYP2D6 alleles, Caucasians in the CPIC data had a higher prevalence of the *4 allele compared to Middle Easterners (18.1% to 7.8%, respectively), but a similar prevalence of the *17 allele (from 0.31% to 1.58%, respectively) in the CPIC data.87 A Faroese population showed a higher prevalence of the *4 allele (33.4%) than both CPIC Caucasians and Middle Easterners.93 The *17 allele was very rare in most Caucasian populations; however, it was common in a German (10%) and Cypriot (40%) population.75
Ethnic differences in CYP2C9, CYP2C19, and CYP2D6 allele prevalence between Blacks
The CPIC defined two major groups which could be considered “Black” under NIH guidelines, African-Americans and Africans. For the CYP2C9 *2 and *3 alleles, the allele frequency between these two populations was almost identical (2.4% prevalence of the *2 allele for Africans and 2.3% for African Americans, 1.0% prevalence of the *3 allele for Africans and 1.2% prevalence for African Americans) in the CPIC data.87 Ethiopians showed a higher prevalence of both alleles (7.7–14.7% prevalence of the *2 allele, 6–12.4% prevalence of the *3 allele) than either population.94
For CYP2C19 alleles, Africans and African Americans also showed similar prevalence for the *2 allele (14.5% for Africans and 18.3% for African Americans), the *3 allele (0.7% for Africans and 0.3% for African Americans), and the *17 allele (15.4% for Africans and 20% for African Americans) in the CPIC data.87 An Igbo population showed a higher prevalence of the *2 allele (29%) than either group.95 A North African population showed a lower prevalence of the *2 allele (8.7%) than either group.70
For CYP2D6 alleles, Africans showed slightly lower prevalence of the *4 allele than compared to African Americans (from 3.3% to 6.4%, respectively) but similar prevalence of the *17 allele (19.9% for Africans, 18.1% for African Americans) in the CPIC data.87 A Kikuyu population showed higher prevalence of the *17 allele (33%) than either population, as did a Zimbabwean population (34%).95,96 A South African Xhosa population showed a much lower prevalence of the *17 allele (3%) than either group, while a black Brazilian population showed a somewhat lower prevalence (11%).75,97
Discussion
We found a significant amount of heterogeneity in racial and ethnic classification categories across different countries. Among the eight countries we analyzed, the number of categories used for each major NIH racial category ranged from 1 to 17 for Asian ethnic groups, from 3 to 24 in Caucasian ethnic groups, and from 0 to 28 for black ethnic groups. The relationship between the ethnic categories used was highly complex, with many groups which could be considered overlapping as well as some groups which were hard to categorize into any of the major groups, such as the indigenous tribes of Malaysia. This large range in number of ethnic categories used across different countries supports the idea that currently ethnic and racial classification in pharmacogenetics studies is highly inconsistent. The lack of consensus on how to classify certain ethnicities into broader racial categories can potentially create difficulty in accurately translating the results to a generate clinical guidelines. In addition, the use of broad racial categories has difficulty in accurately classifying ethnic minorities, such as indigenous tribes, whose genetic background can differ from the majority population within their region.98
We also identified several ethnic categories which have different allele frequencies for actionable CYP450 genes when compared to other ethnic groups within that NIH racial category. These groups often included ethnic minorities in major countries, such as the Hui minority of China or the indigenous tribes of Malaysia. For each NIH racial category and CYP450 gene we analyzed, we found at least one ethnic group whose allele frequency differed from the overall race category. This suggests that the inconsistency in racial and ethnic categorization could have clinical consequences when ethnicity is used for pharmacogenetic guidelines. Pharmacogene allele distribution across the NIH racial categories is not heterogeneous, so making assumptions on an individual’s genotype based on their ethnicity may not be accurate. Based on our analysis, this appears to be particularly relevant for ethnic minority groups within the NIH racial categories. The use of the NIH-defined categories of race for pharmacogenetic guidelines and pharmacogenetics research in its current form may be of limited utility and potentially even damaging in the clinical setting. The genetics of race is complicated and still poorly understood; thus, further research into the relationship between race and polymorphism prevalence may be needed in order to improve the precision of race and ethnicity-centered pharmacogenetic guidelines.
Race and ethnicity continue to be highly investigated topics for medical research. As clinical care continues to trend toward precision medicine, race and ethnicity continue to be investigated as potential biomarkers for providing more individualized care in lieu of genotyping information. This is because public health and epidemiology research has found dramatic differences in health outcomes between ethnicities. For example, studies have found individuals of African descent to be at a significantly higher risk for prostate cancer than Caucasians.99,100 Such findings have spurred a renewed intensity for genetic research on minority populations in order to find genetic causes for disparate health outcomes. Not surprisingly, the field of pharmacogenetics has sought to make use of race and ethnicity to stratify patients by genetic risk as well. Several clinical guidelines for drug therapy based on race have already been established through clinical trials.66 Perhaps, the most famous example of these is the antihypertensive medication BiDil, which was demonstrated to be effective only in African Americans and thus approved by the FDA for treatment of African Americans only.66–68 Other guidelines include the aforementioned usage of race in warfarin dosing algorithms and FDA recommendations for genetic testing in Asian patients using carbamazepine due to risk of Steven–Johnson syndrome.62,63,101,102 However, despite the current usage of race in the clinic, the clinical utility of race as a genetic marker remains highly contested.
The history of race in medicine has been a complicated and controversial one. In years past, race and genetics research had been used as a means to justify racial discrimination and a method to generate a hierarchy of races.103,104 Many current conceptions of race and racial classification originate from social and political ideas rather than having a scientific basis.103 The current most commonly used racial categories in the US are remnants of the works of 20th-century anthropologist Carleton S. Coon, who divided humans into five major races: Caucasoids, Congoid, Mongoloid, Capoid, and Australoids.105,106 The use of these categories continued to propagate for several decades, often for discriminatory purposes, until the model eventually fell out of favor.106 However, the general racial categories still remain, as can be seen in the NIH racial classification guidelines. Specifically, the 3 major continental populations from which the entire human population is thought to derive (namely, European/Caucasian, African, and Asian ancestry) are still widely used for study sample categorization as Caucasian, Black and Asian in significant number of pharmacogenetic articles. Although race-focused genetics research is no longer centered around discriminatory studies, the scientific validity of the current, most widely used classifications of race and ethnicity is still being questioned.107
Examining the genetic structure of human populations reveals inconsistencies in many of the traditionally used racial and ethnic categories. One of the concerns regarding the use of broad racial classifications is the effect of admixture on certain populations. Although African immigrants and African Americans with generations of residence in North America are both classified as “black” or even sometimes “African American” under NIH standards, their genetic ancestry can vary.79,80 European ancestry contributes a significant portion of genetic ancestry for African Americans, a number which also varies widely within the African American population in the US.81 For this reason, categorizing all individuals of African descent as “blacks” or “African Americans” may not accurately capture their genetic background.
Another group for which admixture presents difficulty in racial classification is the Hispanic/Latino population. Although they are typically treated as a homogeneous group, Hispanic/Latino populations actually represent a spectrum of admixture between Europeans, Africans, and Native Americans, with widely differing genetic contributions from each ancestral group between countries.108,109 As a result, some genetic studies now find it more accurate to refer to these groups as admixed Americans instead.110 Studies have also attempted to further stratify “Hispanic” populations into their country of origin in order to generate more precise identifiers of risk factors, including identification of genetic risk factors which differ between Hispanic populations.111–113 These distinctions represent examples of more precise racial and ethnic classification which can improve the accuracy of race and ethnicity-based clinical guidelines.
Due to the increased understanding of the genetic mechanisms underlying race, efforts have been made to generate more precise labels of the race and ethnicity of population samples. Most notably, the 1000 Genomes project now provides extensive documentation of the ethnicity and geographical origin of their population samples.114 Studies are also attempting to more accurately capture the differences in genetic structure within broad racial categories, such as East Asians and Africans.115,116 These findings can potentially further stratify our currently used racial categories into more precise classifications. Such steps represent positive measures in improving the precision of the use of race and ethnicity in precision medicine and limiting overgeneralization of race characteristics in both research and clinical settings.
There are some limitations to our analysis. Our analysis does not factor in sample sizes or include statistical analysis of differences in allele frequencies; however, that is not the primary aim of our study. In addition, our analysis does not include Hispanics, who remain a socially important and historically understudied ethnic population. Our study is certainly not comprehensive of all racial and ethnic categories currently in use, nor is it intended to be. Instead, we hope to paint a picture of the current heterogeneity present in race and ethnicity classification in pharmacogenetic studies, as well as the limitations of broad racial categories. The literature supports this notion, as genetic studies have increasingly trended away from broad categories such as “White” and “Black” and instead focus on the underlying ancestry of individuals and populations.114–116 As our understanding of population genetics increases, these categories could become increasingly outdated. The usage of such broad hierarchies in classifying the genetic makeup of individuals is potentially detrimental to the aims of precision medicine.
Currently, the role of race and ethnicity in genetics research is at an important crossroads. By and large, broad classifications such as black and white have been found to be inadequate from a biological standpoint, a result supported by our review. However, the role of race as a categorical variable for both clinical and research settings remains unclear. Powerful new genotyping technologies such as genome-wide association studies allow researchers to group populations into clusters based on genetic expression, rather than social or geographic characteristics.78,117 Genetics researchers have expressed enthusiasm that as these technologies become more accessible and widespread in the future, population clustering based on gene expression can become the new standard for population stratification in genetics research.118 However, there still remains a barrier in translating these findings from a research setting to the clinical setting due to the expense and limited availability of these technologies. Establishing more precise guidelines for categorical racial classification may be necessary as a bridging step between the current classification methods and the precise genotyping technology of the future.
To our knowledge, our review is the first study which systematically categorizes the racial and ethnic labels used in pharmacogenetics research and relates them to the most commonly used continental race categories promulgated by NIH. Previous studies have examined current practices of race in both the research and clinical settings and come to similar conclusions as ours. There is a growing recognition that use of ethnicity as a proxy of ancestry, which itself is being used as a proxy for genotype, may result in subpar predictions in precision medicine applications.66 Recent reviews recognized interethnic differences in drug response and their potential usefulness for implementing public health policies, designing and interpreting clinical trials, and identifying patients with higher probability of a particular drug metabolism phenotype.119,120 However, it is advocated that focus should be shifted from populations, ethnicities and races to inherent genetic individuality for effective medication optimization of individual patients.121,122 A panel of “ancestry-informative” markers identifying the geographic region of individual’s ancestors is being proposed as potential enhancement of traditional ethnic categories reflecting a complex mixture of social, cultural and geographic influences.123,124
Tang et al reported in 2005 comparison of genetic data from over 3,500 individuals who identified themselves as belonging to one of the major racial or ethnic groups in US (Caucasian, Black, Asian, and Hispanic) and showed near-perfect correspondence of genetic analysis with self-reported categories.125 However, another review examined self-reported race in 2015 in clinical settings, and its accuracy compared to genomic analysis of ancestry. This review found that the practice of self-reported race could be leading to a large number of false positives or false negatives due to its inaccuracy in capturing an individual’s genetic ancestry.126 A 2008 study which surveyed physicians on their attitudes regarding race and genetics in clinical medicine found that many physicians considered race to be a “complex and poorly defined subject” but still considered it an important variable in clinical decision-making. However, many of the surveyed physicians felt that the connection between race and genetics was tenuous and that a major reason for that was the biological inaccuracy of traditional, social race classification systems.127
Based on our findings, we recommend further investigation into the differences in pharmacogene allele frequency between ethnic minority populations using precise classification of their ethnic background and geographical ancestry. Such research can improve our understanding of how race and ethnicity affect pharmacogenetic factors, as well as provide more precise guidelines for clinical care. We also recommend the establishment of more precise guidelines for race and ethnicity classification in clinical research. An example of this is how the 1000 Genomes project defines their populations.114 Their population categories use specific ethnic categories as well as the geographical origin of the population. It is possible that there is a limited number of alleles whose frequency is comparable across various ethnic subgroups of a particular continental race category. However, as it was shown in this review, frequency of a large number of alleles may vary significantly within the major continental race categories depending on a particular geographic ancestry. Evidence-based consensus is necessary for meaningful use of self-identified race categories as well as for geographical ancestry nomenclature in pharmacogenetics. Introduction of common taxonomy of geographical ancestry which integrates specific subpopulations of particular countries and is accepted by the entire scientific community for precision medicine research and practice is warranted in order to facilitate reproducible pharmacogenetic research and clinical implementation of its results. Consistent classification and specificity in defining ethnic populations can improve the precision and generalizability of pharmacogenetics research.
Disclosure
The authors report no conflicts of interest in this work.
References
1. Ma Q, Lu AY. Pharmacogenetics, pharmacogenomics, and individualized medicine. Pharmacol Rev. 2011;63(2):437–459. doi:10.1124/pr.110.003533
2. Roden DM, Wilke RA, Kroemer HK, Stein CM. Pharmacogenomics: the genetics of variable drug responses. Circulation. 2011;123(15):1661–1670. doi:10.1161/CIRCULATIONAHA.109.914820
3. Ingelman-Sundberg M. Pharmacogenetics of cytochrome P450 and its applications in drug therapy: the past, present, and future. Trends Phamacol Sci. 2004;25(4):193–200. doi;10.1016/j.tips.2004.02.007
4. Center for Drug Evaluation and Research. Table of Pharmacogenomic Biomarkers in Drug Labeling. Maryland: Food and Drug Administration: 2019.
5. Van Booven D, Marsh S, McLeod H, et al. Cytochrome P450 2C9-CYP2C9. Pharmacogenet Genomics. 2010;20;4:277–281.
6. Shirasaka Y, Chaudhry AS, Mcdonald M, et al. Interindividual variability of CYP2C19-catalyzed drug metabolism due to differences in gene diplotypes and cytochrome P450 oxidoreductase content. Pharmacogenomics J. 2015;16(4):375–387. doi:10.1038/tpj.2015.58
7. Abbasi K. The World Bank and World Health Focus on South Asia—I: Bangladesh. Bmj. 1999;318(7190):1066–1069. doi;10.1136/bmj.318.7190.1066
8. Huang TS, Zhang L, He Q, et al. DNA sensors to assess the effect of VKORC1 and CYP2C9 gene polymorphisms on warfarin dose requirement in Chinese patients with atrial fibrillation. Australas Phys Eng Sci Med. 2017;40(1):249–258. doi:10.1007/s13246-016-0519-x
9. Krasniqi V, Dimovski A, Bytyqi HQ, Eftimov A, Šimičević L, Božina N. Genetic polymorphisms of CYP2C9, CYP2C19, and CYP3A5 in Kosovar population. Arh Hig Rada Toksikol. 2017;68(3):180–184. doi:10.1515/aiht-2017-68-2998
10. Ancker S, Rechel B. Policy responses to HIV/AIDS in Central Asia. Glob Public Health. 2015;10(7):817–833. doi;10.1080/17441692.2015.1043313
11. Dodgen TM, Hochfeld WE, Fickl H, et al. Introduction of the AmpliChip CYP450 test to a South African cohort: a platform comparative prospective cohort study. BMC Med Genet. 2013;14:1. doi:10.1186/1471-2350-14-20
12. Lee JH, Ahn SG, Lee J-W, et al. Switching from prasugrel to clopidogrel based on Cytochrome P450 2C19 genotyping in East Asian patients stabilized after acute myocardial infarction. Platelets. 2015;27(4):301–307. doi:10.3109/09537104.2015.1095875
13. Hamdy SI, Hiratsuka M, Narahara K, et al. Allele and genotype frequencies of polymorphic cytochromes P450 (CYP2C9, CYP2C19, CYP2E1) and dihydropyrimidine dehydrogenase (DPYD) in the Egyptian population. Br J Clin Pharmacol. 2002;53(6):596–603. doi:10.1046/j.1365-2125.2002.01604.x
14. Li J, Wang Y, Wang H. Distribution of CYP2C19 polymorphisms in Mongolian and Han nationals and the choice of specific antiplatelet drugs. Int J Clin Pharm. 2017;39(4):791–797. doi:10.1007/s11096-017-0451-5
15. Rajman I, Knapp L, Morgan T, Masimirembwa C. African genetic diversity: implications for cytochrome P450-mediated drug metabolism and drug development. EBioMedicine. 2017;17:67–74. doi:10.1016/j.ebiom.2017.02.017
16. Hodel EMS, Csajka C, Ariey F, et al. Effect of single nucleotide polymorphisms in cytochrome P450 isoenzyme and N-acetyltransferase 2 genes on the metabolism of artemisinin-based combination therapies in malaria patients from Cambodia and Tanzania. Antimicrob Agents Chemother. 2012;57(2):950–958. doi:10.1128/AAC.01700-12
17. Ismail R, Hussein A, Teh LK, Isa MN. CYP2D6 phenotypes among Malays in Malaysia. J Clin Pharm Ther. 2008;25(5):379–383. doi:10.1111/j.1365-2710.2000.00304.x
18. Ellison CA, El-Ella SSA, Tawfik M, Lein PJ, Olson JR. Allele and genotype frequencies of CYP2B6 and CYP2C19 polymorphisms in Egyptian agricultural workers. J Toxicol Environ Health A. 2012;75(4):232–241. doi:10.1080/15287394.2012.641201
19. Yen-Revollo JL, Booven DJV, Peters EJ, et al. Influence of ethnicity on pharmacogenetic variation in the Ghanaian population. Pharmacogenomics J. 2009;9(6):373–379. doi:10.1038/tpj.2009.28
20. Barlas IÖ, Sezgin O, Dandara C, et al. Harnessing knowledge on very important pharmacogenes CYP2C9 and CYP2C19 variation for precision medicine in resource-limited global conflict zones. Omics. 2016;20(10):604–609. doi:10.1089/omi.2016.0133
21. Bagheri A, Kamalidehghan B, Haghshenas M, et al. Prevalence of the CYP2D6*10 (C100T), *4 (G1846A), and *14 (G1758A) alleles among Iranians of different ethnicities. Drug Des Devel Ther. 2015;9:2627–2634.
22. Müller-Nordhorn J, Holmberg C, Dokova KG, et al. Perceived challenges to public health in Central and Eastern Europe: a qualitative analysis. BMC Public Health. 2012;12:1. doi:10.1186/1471-2458-12-311
23. Kozak M, Bornmann L, Leydesdorff L. How have the Eastern European countries of the former Warsaw Pact developed since 1990? A bibliometric study. Scientometrics. 2014;102:1101–1117. doi:10.1007/s11192-014-1439-8
24. Kawalec P, Tesar T, Vostalova L, et al. Pharmaceutical regulation in Central and Eastern European Countries: a current review. Front Pharmacol. 2017;8:892. doi:10.3389/fphar.2017.00892
25. Vollset SE. Does the southern European cardiovascular mortality advantage extend to total mortality? 50-year trends in death risks between 40 and 70 years of age in Western European men and women. Scand J Public Health. 2010;38(5 Suppl):127–134. doi:10.1177/1403494810379893
26. Koopmans AB, Vinkers DJ, Gelan PJ, Hoek HW, Harten PNV. CYP2D6 and CYP2C19 genotyping in psychiatric patients on psychotropic medication in the former Dutch Antilles. Pharmacogenomics. 2017;18(10):1003–1012. doi:10.2217/pgs-2017-0011
27. Shrif NEMA, Won -H-H, Lee S-T, et al. Evaluation of the effects of VKORC1 polymorphisms and haplotypes, CYP2C9 genotypes, and clinical factors on warfarin response in Sudanese patients. Eur J Clin Pharmacol. 2011;67(11):1119–1130. doi:10.1007/s00228-011-1060-1
28. United Nations Statistics Division. Standard Country or Area Codes for Statistical Use (M49). New York: United Nations Statistics Division; 2011.
29. Soko ND, Masimirembwa C, Dandara C. Pharmacogenomics of Rosuvastatin: a Glocal (Global Local) African perspective and expert review on a statin drug. Omics. 2016;20(9):498–509. doi:10.1089/omi.2016.0114
30. Aklillu E, Herrlin K, Gustafsson LL, Bertilsson L, Ingelman-Sundberg M. Evidence for environmental influence on CYP2D6-catalysed debrisoquine hydroxylation as demonstrated by phenotyping and genotyping of Ethiopians living in Ethiopia or in Sweden. Pharmacogenetics. 2002;12(5):375–383.
31. Herrlin K, Massele AY, Jande M, et al. Bantu Tanzanians have a decreased capacity to metabolize omeprazole and mephenytoin in relation to their CYP2C19 genotype*. Clin Pharmacol Ther. 1998;64(4):391–401. doi:10.1016/S0009-9236(98)90070-4
32. Kudzi W, Dodoo AN, Mills JJ. Characterisation of CYP2C8, CYP2C9 and CYP2C19 polymorphisms in a Ghanaian population. BMC Med Genet. 2009;10:1. doi:10.1186/1471-2350-10-124
33. Cavaco I, Stromberg-Norklit J, Kaneko A, et al. CYP2C8 polymorphism frequencies among malaria patients in Zanzibar. Eur J Clin Pharmacol. 2005;61(1):15–18. doi:10.1007/s00228-004-0871-8
34. Allabi AC, Gala J-L, Desager J-P, Heusterspreute M, Horsmans Y. Genetic polymorphisms of CYP2C9 and CYP2C19 in the and Belgian populations. Br J Clin Pharmacol. 2003;56(6):653–657. doi:10.1046/j.1365-2125.2003.01937.x
35. Miura J, Obua C, Abbo C, Kaneko S, Tateishi T. Cytochrome P450 2C19 genetic polymorphisms in Ugandans. Eur J Clin Pharmacol. 2008;65(3):319–320. doi:10.1007/s00228-008-0583-6
36. Wright GEB, Niehaus DJH, Drögemöller BI, Koen L, Gaedigk A, Warnich L. Elucidation of CYP2D6 genetic diversity in a unique African population: implications for the future application of pharmacogenetics in the Xhosa population. Ann Hum Genet. 2010;74(4):340–350. doi:10.1111/j.1469-1809.2010.00585.x
37. Jittikoon J, Mahasirimongkol S, Charoenyingwattana A, et al. Comparison of genetic variation in drug ADME-related genes in Thais with Caucasian, African and Asian HapMap populations. J Hum Genet. 2015;61(2):119–127. doi:10.1038/jhg.2015.115
38. Pedersen RS, Brasch-Andersen C, Sim SC, et al. Linkage disequilibrium between the CYP2C19*17 allele and wildtype CYP2C8 and CYP2C9 alleles: identification of CYP2C haplotypes in healthy Nordic populations. Eur J Clin Pharmacol. 2010;66(12):1199–1205. doi:10.1007/s00228-010-0864-8
39. Hilli J, Rane A, Lundgren S, Bertilsson L, Laine K. Genetic polymorphism of cytochrome P450s and P-glycoprotein in the Finnish population. Fundam Clin Pharmacol. 2007;21(4):379–386. doi:10.1111/j.1472-8206.2007.00494.x
40. Dandara C, Lombard Z, Plooy ID, Mclellan T, Norris SA, Ramsay M. Genetic variants in CYP (−1A2, −2C9, −2C19, −3A4 and −3A5), VKORC1 and ABCB1 genes in a black South African population: a window into diversity. Pharmacogenomics. 2011;12(12):1663–1670. doi:10.2217/pgs.11.106
41. Yampayon K, Sukasem C, Limwongse C, et al. Influence of genetic and non-genetic factors on phenytoin-induced severe cutaneous adverse drug reactions. Eur J Clin Pharmacol. 2017;73(7):855–865. doi:10.1007/s00228-017-2250-2
42. Ramsjö M, Aklillu E, Bohman L, Ingelman-Sundberg M, Roh H-K, Bertilsson L. CYP2C19 activity comparison between Swedes and Koreans: effect of genotype, sex, oral contraceptive use, and smoking. Eur J Clin Pharmacol. 2010;66(9):871–877. doi:10.1007/s00228-010-0835-0
43. Scordo M. Allele and genotype frequencies of CYP2C9, CYP2C19 and CYP2D6 in an Italian population. Pharmacol Res. 2004;50(2):195–200. doi:10.1016/j.phrs.2004.01.004
44. Ruas JL, Lechner MC. Allele frequency of CYP2C19 in a Portuguese population. Pharmacogenetics. 1997;7(4):333–335.
45. Payan M, Rouini MR, Tajik N, Ghahremani MH, Tahvilian R. Hydroxylation index of omeprazole in relation to CYP2C19 polymorphism and sex in a healthy Iranian population. Daru. 2014;22:1. doi:10.1186/2008-2231-22-31
46. Masimirembwa C, Bertilsson L, Johansson I, Hasler JA, Ingelman-Sundberg M. Phenotyping and genotyping of S-mephenytoin hydroxylase (cytochrome P450 2C19) in a Shona population of Zimbabwe*. Clin Pharmacol Ther. 1995;57(6):656–661. doi:10.1016/0009-9236(95)90228-7
47. Bathum L, Skjelbo E, Mutabingwa TK, Madsen H, Hørder M, Brøsen K. Phenotypes and genotypes for CYP2D6 and CYP2C19 in a black Tanzanian population. Br J Clin Pharmacol. 2001;48(3):395–401. doi:10.1046/j.1365-2125.1999.00019.x
48. Ji L, Pan S, Marti-Jaun J, Hanseler E, Rentsch K, Hersberger M. Single-step assays to analyze CYP2D6 gene polymorphisms in Asians: allele frequencies and a novel *14b allele in mainland Chinese. Clin Chem. 2002;48(7):983–988.
49. Gaedigk A, Coetsee C. The CYP2D6 gene locus in South African coloureds: unique allele distributions, novel alleles and gene arrangements. Eur J Clin Pharmacol. 2008;64(5):465–475. doi:10.1007/s00228-007-0445-7
50. Aklillu E, Persson I, Bertilsson L, Johansson I, Rodrigues F, Ingelman-Sundberg M. Frequent distribution of ultrarapid metabolizers of debrisoquine in an Ethiopian population carrying duplicated and multiduplicated functional CYP2D6 alleles. J Pharmacol Exp Ther. 1996;278(1):441–446.
51. Sankar PA, Cho MK, Mountain J. Race and ethnicity in genetic research. Am J Med Genet A. 2007;143(9):961–970. doi:10.1002/ajmg.a.31575
52. Bluth MH, Li J. Pharmacogenomics of drug metabolizing enzymes and transporters: implications for cancer therapy. Pharmgenomics Pers Med. 2011;4:11–33. doi:10.2147/PGPM.S18861
53. Johnson JA. Pharmacogenetics in clinical practice: how far have we come and where are we going? Pharmacogenomics. 2013;14(7):835–843. doi:10.2217/pgs.13.52
54. McKinnon RA, Ward MB, Sorich MJ. A critical analysis of barriers to the clinical implementation of pharmacogenomics. Ther Clin Risk Manag. 2007;3(5):753–759.
55. Finkelstein J, Friedman C, Hripcsak G, Cabrera M. Potential utility of precision medicine for older adults with polypharmacy: a case series study. Pharmgenomics Pers Med. 2016;9:31–45. doi:10.2147/PGPM.S101474
56. Finkelstein J, Friedman C, Hripcsak G, Cabrera M. Pharmacogenetic polymorphism as an independent risk factor for frequent hospitalizations in older adults with polypharmacy: a pilot study. Pharmgenomics Pers Med. 2016;9:107–116. doi:10.2147/PGPM.S117014
57. Liu J, Finkelstein J. Towards pharmacogenomics-driven medication risk assessment in people with polypharmacy. Stud Health Technol Inform. 2018;247:880–884.
58. Ortega VE, Meyers DA. Pharmacogenetics: implications of race and ethnicity on defining genetic profiles for personalized medicine. J Allergy Clin Immunol. 2014;133(1):16–26. doi:10.1016/j.jaci.2013.10.040
59. Lakiotaki K, Kanterakis A, Kartsaki E, Katsila T, Patrinos GP, Potamias G. Exploring public genomics data for population pharmacogenomics. PLoS One. 2017;12(8):e0182138. doi:10.1371/journal.pone.0182138
60. Bjornsson TD, Wagner JA, Donahue SR, et al. A review and assessment of potential sources of ethnic differences in drug responsiveness. J Clin Pharmacol. 2003;43(9):943–967.
61. Ramamoorthy A, Pacanowski MA, Bull J, Zhang L. Racial/ethnic differences in drug disposition and response: review of recently approved drugs. Clin Pharmacol Ther. 2015;97(3):263–273. doi:10.1002/cpt.61
62. Wu AH, Wang P, Smith A, et al. Dosing algorithm for warfarin using CYP2C9 and VKORC1 genotyping from a multi-ethnic population: comparison with other equations. Pharmacogenomics. 2008;9(2):169–178. doi:10.2217/14622416.9.2.169
63. Limdi NA, Brown TM, Yan Q, et al. Race influences warfarin dose changes associated with genetic factors. Blood. 2015;126(4):539–545. doi:10.1182/blood-2015-02-627042
64. Johnson JA. Ethnic differences in cardiovascular drug response: potential contribution of pharmacogenetics. Circulation. 2008;118(13):1383–1393. doi:10.1161/CIRCULATIONAHA.107.704023
65. Julius S, Alderman M, Beevers G. Cardiovascular risk reduction in hypertensive black patients with left ventricular hypertrophy. The LIFE study. J Am Coll Cardiol. 2004;43(6):1047–1055. doi:10.1016/j.jacc.2003.11.029
66. Urban TJ. Race, ethnicity, ancestry, and pharmacogenetics. Mt Sinai J Med. 2010;77(2):133–139. doi:10.1002/msj.20168
67. Cohn J, Archibald D, Ziesche S, et al. Effect of vasodilator therapy on mortality in chronic congestive heart failure. Results of a veterans administration cooperative study. N Engl J Med. 1986;314(24):1547–1552. doi:10.1056/NEJM198606123142404
68. Taylor AL, Ziesche S, Yancy C, et al. Combination of isosorbide dinitrate and hydralazine in Blacks with heart failure. N Engl J Med. 2004;35(20):2049–2057. doi:10.1056/NEJMoa042934
69. Bernard S. Interethnic differences in genetic polymorphisms of CYP2D6 in the U.S. population: clinical implications. Oncologist. 2006;11(2):126–135. doi:10.1634/theoncologist.11-2-126
70. Fricke-Galindo I, Cespedes-Garro C, Rodrigues-Soares F, et al. Interethnic variation of CYP2C19 alleles, ‘predicted’ phenotypes and ‘measured’ metabolic phenotypes across world populations. Pharmacogenomics J. 2016;16(2):113–123. doi:10.1038/tpj.2015.70
71. Sychev D, Shuev G, Suleymanov S, et al. Comparison of CYP2C9, CYP2C19, CYP2D6, ABCB1, and SLCO1B1 gene-polymorphism frequency in Russian and Nanai populations. Pharmgenomics Pers Med. 2017;10:93–99. doi:10.2147/PGPM.S129665
72. Yang Z, Cui H, Hasi T, Jia S, Gong M, Su X. Genetic polymorphisms of cytochrome P450 enzymes 2C9 and 2C19 in a healthy Mongolian population in China. Genet Mol Res. 2010;9(3):1844–1851. doi:10.4238/vol9-3gmr938
73. Goh LL, Lim CW, Sim WC, Toh LX, Leong KP. Analysis of genetic variation in CYP450 genes for clinical implementation. PLoS One. 2017;12:1. doi:10.1371/journal.pone.0169233
74. Jalil NJA, Bannur Z, Derahman A, et al. The implication of the polymorphisms of COX-1, UGT1A6, and CYP2C9 among cardiovascular disease (CVD) patients treated with aspirin. J Pharm Pharm Sci. 2015;18(3):474–483.
75. Mizzi C, Dalabira E, Dzimiri N, et al. A European spectrum of pharmacogenomic biomarkers: implications for clinical pharmacogenomics. PLoS One. 2016;11(9):e0162866. doi: 10.1371/journal.pone.0162866
76. Bhopal R. Is research into ethnicity and health racist, unsound, or important science? Bmj. 1997;314(7096):1751–1756. doi:10.1136/bmj.314.7096.1751
77. Smedley A, Smedley BD. Race as biology is fiction, racism as a social problem is real: anthropological and historical perspectives on the social construction of race. Am Psychol. 2005;60(1):16–26. doi:10.1037/0003-066X.60.1.16
78. Guo G, Fu Y, Lee H, Cai T, Harris KM, Li Y. Genetic bio-ancestry and social construction of racial classification in social surveys in the contemporary United States. Demography. 2013;51(1):141–172. doi:10.1007/s13524-013-0242-0
79. Parra EJ, Kittles RA, Argyropoulos G, et al. Ancestral proportions and admixture dynamics in geographically defined African Americans living in South Carolina. Am J Phys Anthropol. 2001;114(1):18–29. doi:10.1002/1096-8644(200101)114:1<18::AID-AJPA1002>3.0.CO;2-2
80. Lind JM, Hutcheson-Dilks HB, Williams SM, et al. Elevated male European and female African contributions to the genomes of African American individuals. Hum Genet. 2006;120(5):713–722. doi:10.1007/s00439-006-0261-7
81. Tishkoff S, Reed F, Friedlander F, Ehret C, Ranciaro A, Froment A. The genetic structure and history of Africans and African Americans. Science. 2009;324(5930):1035–1044. doi:10.1126/science.1172257
82. Bhopal R. Glossary of terms relating to ethnicity and race: for reflection and debate. J Epidemiol Community Health. 2004;58(6):441–445. doi:10.1136/jech.2003.013466
83. National Center for Complementary and Integrative Health. Racial and Ethnic Categories and Definitions for NIH Diversity Programs and for Other Reporting Purposes. Bethesda, Maryland: National Institutes of Health; 2015.
84. Hunt LM, Megyesi MS. The ambiguous meanings of the racial/ethnic categories routinely used in human genetics research. Soc Sci Med. 2008;66(2):349–361. doi:10.1016/j.socscimed.2007.08.034
85. Avilés-Santa ML, Heintzman J, Lindberg NM, et al. Personalized medicine and Hispanic health: improving health outcomes and reducing health disparities - a National Heart, Lung, and Blood Institute workshop report. BMC Proc. 2017;11(Suppl 11):11. doi:10.1186/s12919-017-0079-4
86. Whirl-Carrillo M, McDonagh EM, Hebert JM, et al. Pharmacogenomics knowledge for personalized medicine. Clin Pharmacol Ther. 2012;92(4):414–417. doi:10.1038/clpt.2012.96
87. Relling MV, Klein TE. CPIC: clinical pharmacogenetics implementation consortium of the pharmacogenomics research network. Clin Pharmacol Ther. 2011;89(3):464–467. doi:10.1038/clpt.2010.279
88. Zuo J, Xia D, Jia L, Guo T. Genetic polymorphisms of drug-metabolizing phase I enzymes CYP3A4, CYP2C9, CYP2C19 and CYP2D6 in Han, Uighur, Hui and Mongolian Chinese populations. Pharmazie. 2012;67(7):639–644.
89. Chan SL, Samaranayake N, Ross CJ, et al. Genetic diversity of variants involved in drug response and metabolism in Sri Lankan populations: implications for clinical implementation of pharmacogenomics. Pharmacogenet Genomics. 2016;26(1):28–39. doi:10.1097/FPC.0000000000000182
90. Ang GY, Yu CY, Subramaniam V, et al. Detection of CYP2C19 genetic variants in malaysian orang asli from massively parallel sequencing data. PLoS One. 2016;11:10. doi:10.1371/journal.pone.0164169
91. Mirzaev KB, Sychev DA, Ryzhikova KA, et al. Genetic polymorphisms of cytochrome P450 enzymes and transport proteins in a russian population and three ethnic groups of dagestan. Genet Test Mol Biomarkers. 2017;21(12):747–753. doi:10.1089/gtmb.2017.0036
92. Nakai K, Habano W, Nakai K, et al. Ethnic differences in CYP2C9*2 (Arg144Cys) and CYP2C9*3 (Ile359Leu) genotypes in Japanese and Israeli populations. Life Sci. 2005;78(1):107–111. doi:10.1016/j.lfs.2005.04.049
93. Halling J, Petersen MS, Damkier P, et al. Polymorphism of CYP2D6, CYP2C19, CYP2C9 and CYP2C8 in the Faroese population. Eur J Clin Pharmacol. 2005;61(7):491–497. doi:10.1007/s00228-005-0938-1
94. Scordo MG, Aklillu E, Yasar U, Dahl M-L, Spina E, Ingelman-Sundberg M. Genetic polymorphism of cytochrome P450 2C9 in a Caucasian and a black African population. Br J Clin Pharmacol. 2001;52(4):447–450. doi:10.1046/j.0306-5251.2001.01460.x
95. Matimba A, Oluka MN, Ebeshi BU, et al. Establishment of a biobank and pharmacogenetics database of African populations. Eur J Hum Genet. 2008;16(7):780–783. doi:10.1038/ejhg.2008.49
96. Dandara C, Masimirembwa CM, Magimba A, et al. Genetic polymorphism of CYP2D6 and CYP2C19 in East- and Southern African populations including psychiatric patients. Eur J Clin Pharmacol. 2001;57(1):11–17.
97. Rodrigues-Soares F, Kehdy FSG, Sampaio-Coelho J, et al. Genetic structure of pharmacogenetic biomarkers in Brazil inferred from a systematic review and population-based cohorts: a RIBEF/EPIGEN-Brazil initiative. Pharmacogenomics J. 2018. doi:10.1038/s41397-018-0015-7
98. Gaieski JB, Owings AC, Vilar MG, et al. Genetic ancestry and indigenous heritage in a Native American Descendant Community in Bermuda. Am J Phys Anthropol. 2011;146(3):392–405. doi:10.1002/ajpa.21588
99. Rebbeck TR. Prostate cancer genetics: variation by race, ethnicity, and geography. Semin Radiat Oncol. 2017;27(1):3–10. doi:10.1016/j.semradonc.2016.08.002
100. Zeigler-Johnson CM, Spangler E, Jalloh M, Gueye S, Rennert H, Rebbeck T. Genetic susceptibility to prostate cancer in men of African descent: implications for global disparities in incidence and outcomes. Can J Urol. 2008;15(1):3872–3882.
101. Ferrell PB, Mcleod HL. Carbamazepine,HLA-B*1502and risk of Stevens–Johnson syndrome and toxic epidermal necrolysis: US FDA recommendations. Pharmacogenomics. 2008;9(10):1543–1546. doi:10.2217/14622416.9.10.1543
102. Chung W-H, Hung S-I, Hong H-S, et al. Medical genetics: a marker for Stevens–Johnson syndrome. Nature. 2004;428(6982):486. doi:10.1038/nature02437
103. Braun L, Fausto-Sterling A, Fullwiley D, et al. Racial categories in medical practice: how useful are they? PLoS Med. 2007;4:9. doi:10.1371/journal.pmed.0040271
104. Race, Ethnicity, and Genetics Working Group. The use of racial, ethnic, and ancestral categories in human genetics research. Am J Hum Genet. 2005;77(4):519–532. doi:10.1086/491747
105. Coon CS. The Living Races of Man. New York: Alfred A. Knopf; 1974.
106. Stoneking M. Human origins. The molecular perspective. EMBO Rep. 2008;9(Suppl 1):S46–S50. doi:10.1038/embor.2008.64
107. Hunt LM, Megyesi MS. Genes, race and research ethics: whos minding the store? J Med Ethics. 2008;34(6):495–500. doi:10.1136/jme.2007.021295
108. Mao X, Bigham AW, Mei R, et al. A genomewide admixture mapping panel for Hispanic/Latino populations. Am J Hum Genet. 2007;80(6):1171–1178. doi:10.1086/518564
109. Price AL, Patterson N, Yu F, et al. A genomewide admixture map for Latino populations. Am J Hum Genet. 2007;80(6):1024–1036. doi:10.1086/518313
110. Montinaro F, Busby GB, Pascali VL, Myers S, Hellenthal G, Capelli C. Unravelling the hidden ancestry of American admixed populations. Nat Commun. 2015;6(1):6596. doi:10.1038/ncomms7596
111. Torgerson DG, Gignoux CR, Galanter JM, et al. Case-control admixture mapping in Latino populations enriches for known asthma-associated genes. J Allergy Clin Immunol. 2012;130(1):76–82. doi:10.1016/j.jaci.2012.02.040
112. Daviglus ML, Talavera GA, Avilés-Santa ML, et al. Prevalence of Major cardiovascular risk factors and cardiovascular diseases among Hispanic/Latino individuals of diverse backgrounds in the United States. Jama. 2012;308(17):1775–1784. doi:10.1001/jama.2012.14517
113. Conomos M, Laurie C, Stilp A, et al. Genetic diversity and association studies in US Hispanic/Latino populations: applications in the Hispanic Community Health Study/Study of Latinos. Am J Hum Genet. 2016;98(1):165–184. doi:10.1016/j.ajhg.2015.12.001
114. 1000 Genomes Project Consortium; Auton A, Durbin RM, et al. A global reference for human genetic variation. Nature. 2015;526(7571):68–74.
115. Tian C, Kosoy R, Lee A, et al. Analysis of East Asia genetic substructure using genome-wide SNP arrays. PLoS One. 2008;3:12. doi:10.1371/journal.pone.0003862
116. Campbell MC, Tishkoff SA. African genetic diversity: implications for human demographic history, modern human origins, and complex disease mapping. Annu Rev Genomics Hum Genet. 2008;9(1):403–433. doi:10.1146/annurev.genom.9.081307.164258
117. Solovieff N, Hartley SW, Baldwin CT, Perls TT, Steinberg MH, Sebastiani P. Clustering by genetic ancestry using genome-wide SNP data. BMC Genet. 2010;11(1):108. doi:10.1186/1471-2156-11-108
118. Fujimura JH, Rajagopalan R. Different differences: the use of ‘genetic ancestry’ versus race in biomedical human genetic research. Soc Stud Sci. 2010;41(1):5–30. doi:10.1177/0306312710379170
119. Nebert DW, Menon AG. Pharmacogenomics, ethnicity, and susceptibility genes. Pharmacogenomics J. 2001;1(1):19–22.
120. Risch N, Burchard E, Ziv E, Tang H. Categorization of humans in biomedical research: genes, race and disease. Genome Biol. 2002;3(7):comment2007. doi:10.1186/gb-2002-3-7-comment2007
121. Wilson JF, Weale ME, Smith AC, et al. Population genetic structure of variable drug response. Nat Genet. 2001;29(3):265–269. doi:10.1038/ng761
122. Lee SS. Racializing drug design: implications of pharmacogenomics for health disparities. Am J Public Health. 2005;95(12):2133–2138. doi:10.2105/AJPH.2005.068676
123. Bonham VL, Callier SL, Royal CD. Will precision medicine move us beyond race? N Engl J Med. 2016;374(21):2003–2005. doi:10.1056/NEJMp1511294
124. Cooper RS, Nadkarni GN, Ogedegbe G. Race, ancestry, and reporting in medical journals. Jama. 2018;320(15):1531–1532. doi:10.1001/jama.2018.10960
125. Tang H, Quertermous T, Rodriguez B, et al. Genetic structure, self-identified race/ethnicity, and confounding in case-control association studies. Am J Hum Genet. 2005;76(2):268–275. doi:10.1086/427888
126. Mersha TB, Abebe T. Self-reported race/ethnicity in the age of genomic research: its potential impact on understanding health disparities. Hum Genomics. 2015;9:1. doi:10.1186/s40246-014-0023-x
127. Bonham VL, Sellers SL, Gallagher TH, et al. Physicians attitudes toward race, genetics, and clinical medicine. Genet Med. 2009;11(4):279–286. doi:10.1097/GIM.0b013e318195aaf4
128. Tamminga W, Wemer J, Oosterhuis B, Zeeuw RD, Leij LD, Jonkman J. The prevalence of CYP2D6 and CYP2C19 genotypes in a population of healthy Dutch volunteers. Eur J Clin Pharmacol. 2001;57(10):717–722.
129. Persson I, Aklillu E, Rodrigues F, Bertilsson L, Ingelman-Sundberg M. S-mephenytoin hydroxylation phenotype and CYP2C19 genotype among Ethiopians. Pharmacogenetics. 1996;6(6):521–526.
130. Matimba A, Del-Favero J, Broeckhoven CV, Masimirembwa C. Novel variants of major drug-metabolising enzyme genes in diverse African populations and their predicted functional effects. Hum Genomics. 2009;3(2):169. doi:10.1186/1479-7364-3-2-169
 © 2019 The Author(s). This work is published and licensed by Dove Medical Press Limited. The
full terms of this license are available at https://www.dovepress.com/terms
and incorporate the Creative Commons Attribution
- Non Commercial (unported, 3.0) License.
By accessing the work you hereby accept the Terms. Non-commercial uses of the work are permitted
without any further permission from Dove Medical Press Limited, provided the work is properly
attributed. For permission for commercial use of this work, please see paragraphs 4.2 and 5 of our Terms.
© 2019 The Author(s). This work is published and licensed by Dove Medical Press Limited. The
full terms of this license are available at https://www.dovepress.com/terms
and incorporate the Creative Commons Attribution
- Non Commercial (unported, 3.0) License.
By accessing the work you hereby accept the Terms. Non-commercial uses of the work are permitted
without any further permission from Dove Medical Press Limited, provided the work is properly
attributed. For permission for commercial use of this work, please see paragraphs 4.2 and 5 of our Terms.