Back to Journals » International Journal of Nanomedicine » Volume 11
Improved molecular fingerprint analysis employing multi-branched gold nanoparticles in conjunction with surface-enhanced Raman scattering
Authors Johnston J, Taylor E, Gilbert R, Webster T ![]()
Received 28 July 2015
Accepted for publication 5 October 2015
Published 22 December 2015 Volume 2016:11 Pages 45—53
DOI https://doi.org/10.2147/IJN.S93222
Checked for plagiarism Yes
Review by Single anonymous peer review
Peer reviewer comments 2
Editor who approved publication: Professor Carlos Rinaldi
Jencilin Johnston,1 Erik N Taylor,1,2 Richard J Gilbert,2 Thomas J Webster1,3
1Department of Chemical Engineering, 2Department of Chemistry and Chemical Biology, Northeastern University, Boston, MA, USA; 3Center of Excellence for Advanced Materials Research, King Abdulaziz University, Jeddah, Saudi Arabia
Abstract: Vibrational spectroscopy is a powerful analytical tool that assesses molecular properties based on spectroscopic signatures. In this study, the effect of gold nanoparticle morphology (spherical vs multi-branched) was assessed for the characterization of a Raman signal (ie, molecular fingerprint) that may be helpful for numerous medical applications. Multi-branched gold nanoparticles (MBAuNPs) were fabricated using a green chemistry method which employed the reduction of gold ion solute by 2-[4-(2-hydroxyethyl)-1-piperazyl] ethane sulfonic acid. Two types of reporter dyes, indocyanine (IR820 and IR792) and carbocyanine (DTTC [3,3'-diethylthiatricarbocyanine iodide] and DTDC [3,3'-diethylthiadicarbocyanine iodide]), were functionalized to the surface of the MBAuNPs and stabilized with denatured bovine serum albumin, thus forming the surface-enhanced Raman spectroscopy tag. Fluorescein isothiocyanate-conjugated anti-epidermal growth factor receptor to the surface-enhanced Raman spectroscopy tags and the properties of the resulting conjugates were assessed through determination of the Raman signal. Using the MBAuNP Raman probes synthesized in this manner, we demonstrated that MBAuNP provided significantly more surface-enhanced Raman scattering signal when compared with the associated spherical gold nanoparticle of similar size and concentration. MBAuNP enhancements were retained in the surface-enhanced Raman spectroscopy tags complexed to anti-epidermal growth factor receptor, providing evidence that this could be a useful biological probe for enhanced Raman molecular fingerprinting. Furthermore, while utilizing IR820 as a novel reporter dye linked with MBAuNP, superior Raman signal fingerprint results were obtained. Such results provide significant promise for the use of MBAuNP in the detection of numerous diseases for which biologically specific surface markers exist.
Keywords: gold nanostars, IR820, SERS
Introduction
The discovery by Sir CV Raman that light energy is scattered by the substance onto which it is incident was termed the Raman Effect and was the basis for the Nobel Prize in 1930 in physics. When the light energy, E=hυ, is incident on a molecule, it is scattered with the same amount of energy, called Rayleigh scattering. If the energy of the scattered light is lost or gained, generally due to molecular vibrations, it is called inelastic scattering or Raman scattering. If the scattered light has lost energy from that of the incident light, it is called Stokes Raman scattering and if it has gained energy it is called anti-Stokes Raman scattering (Figure 1). Since this vibrational effect is unique for each molecule, the Raman effect may be considered as a molecular fingerprint. However, the Raman signal is very weak, where only one photon out of 1010 incident photons is scattered.1 Surface-enhanced Raman scattering (SERS) has been employed as a method to enhance Raman signals in the order of 1012 to 1014.
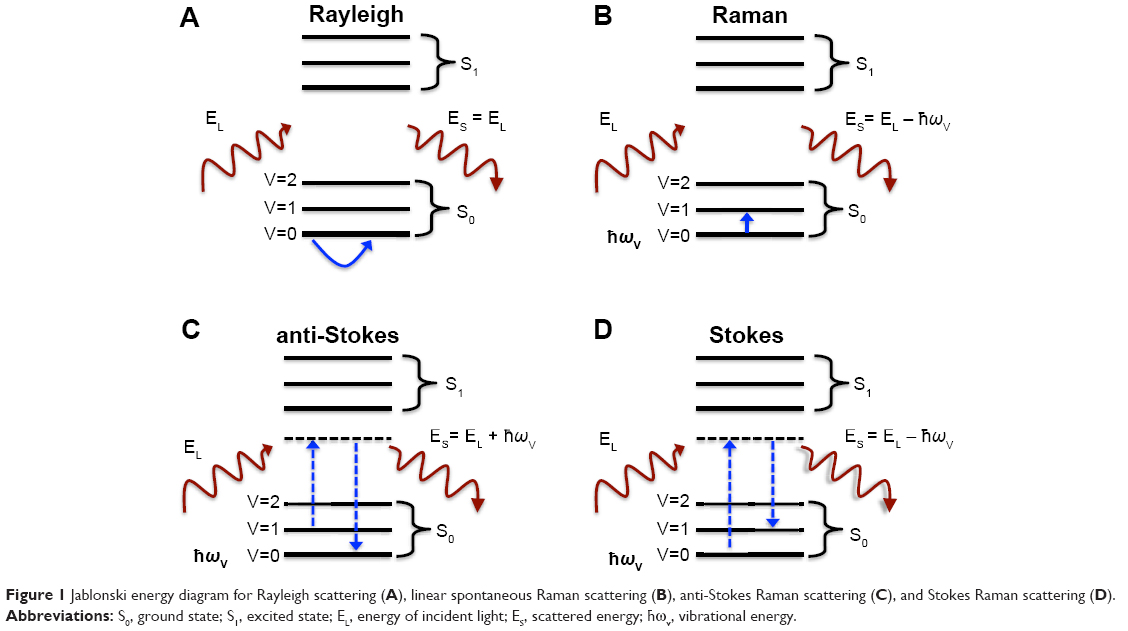 | Figure 1 Jablonski energy diagram for Rayleigh scattering (A), linear spontaneous Raman scattering (B), anti-Stokes Raman scattering (C), and Stokes Raman scattering (D). |
SERS is a nondestructive, ultrasensitive, reproducible, inelastic vibrational scattering technique which gives accurate fingerprints of the molecules of interest.2 Surface plasmonic resonance results from the oscillation of free electrons in conductive metals like copper, silver, and gold, when excited by the incident light energy. Localized surface plasmon resonance occurs when these oscillations are confined to the nanostructure.3 Localized surface plasmon resonance underlies the SERS effect with the promotion of oscillatory effects in free electrons on the surface of the nanoparticles and through the generation of higher dipole moments in these electrons, thus creating “hotspots”.4 When reporter molecules are adherent on the hotspots, the localized surface plasmon resonance effect caused by the electrons induces a dipole moment on the molecules adsorbed on the nanoparticles which causes the molecules to polarize, thereby setting the adherent molecules into vibration. Since vibrational scattering is unique for each molecule, this method gives an accurate result of the analyte, thereby giving the molecular fingerprint of the analyte. Gold, which has good biocompatible properties and good optical properties,5 has been utilized to enhance the weak Raman scattering signal emitted by the analyte when irradiated with the monochromatic laser light.
In this study, we synthesized multi-branched gold nanoparticles (MBAuNPs) and adhered two different kinds of Raman reporters, indocyanine and carbocyanine dyes, to identify the dye that yields maximum Raman intensity. A comparative study on the enhancement effect of MBAuNP and spherical AuNP was performed and a relative enhancement factor of MBAuNP was determined and calculated. Such results provided significant promising data for the use of MBAuNP (as compared to AuNPs) in the detection and treatment of numerous diseases from cancer to cardiovascular disease.
Materials and methods
Materials
Hydrotetracholoaurate (HAuCl4), 2-[4-(2-hydroxyethyl)-1-piperazyl] ethane sulfonic acid (HEPES), IR820, IR792, DTTC (3,3′-diethylthiatricarbocyanine iodide), DTDC (3,3′-diethylthiadicarbocyanine iodide), and sodium hydroxide (NaOH) were bought from Sigma-Aldrich Co., St Louis, MO, USA. Spherical AuNPs 60 nm in diameter were bought from Cytodiagnostics, ON, Canada. The monoclonal anti-epidermal growth factor receptor (EGFR) antibody conjugated with fluorescein isothiocyanate (FITC) was bought from Abcam, Cambridge, MA, USA. Sodium bicarbonate was purchased from Thermo Fisher Scientific, Waltham, MA, USA.
Synthesis of MBAuNP
MBAuNP were prepared at room temperature at pH 7.4 using a seedless, green chemistry method6 in which HAuCl4 was reduced by the HEPES. All the glassware were washed with aqua regia, ethanol, and deionized water. A 15 mM HEPES solution was prepared by adding 1.5 mL of 100 mM HEPES to 8.5 mL of deionized water. The pH of the solution was adjusted to 7.4 by the addition of 1 M NaOH. Then, 0.25 mL of 20 mM HAuCl4 was added and the colorless solution turned turbid blue within 30 to 45 minutes.
Characterization of MBAuNP
The synthesized MBAuNPs were characterized using a SpectraMax Paradigm to obtain the absorption spectrum of these particles and a JOEL transmission electron microscope (TEM) 1010 was used to obtain the size and shape of the nanoparticles. For this, 10 μL of the washed MBAuNP was placed on a neat parafilm and the copper grid was placed on the droplet and dried to remove excess solution. Then, they were scanned using a JEOL TEM 1010. A Hitachi 4800 Scanning Electron Microscope was used to obtain the morphology of the nanoparticles. For this, a sample holder was coated with a palladium coating and the MBAuNPs were placed on the coated sample holder and dried; then, it was scanned in the scanning electron microscope. Lastly, a DLS 90 Plus Brookhaven instrument was used to obtain the hydrodynamic size of the particles.
Preparation of SERS tags
A stock solution of a 1 mM concentration of the Raman probes, DTTC, DTDC, IR792, and IR820, was prepared. An amount of 5 μM of each of the Raman probe solutions was prepared by the addition of 5 μL of the Raman probe solution to 995 μL of deionized water. Raman probe solutions of varying volumes from 1 to 10 mL were added to 1 mL of colloidal MBAuNP solution by vortexing at medium speed and incubating for 10 minutes. Then, the excess Raman probes were removed by centrifuging at 3,000 rpm for 10 minutes. The centrifuged MBAuNP were then incubated in 0.5 mg/mL of denatured bovine serum albumin (dBSA) for 1 hour. The excess dBSA was removed by centrifuging three times at 3,000 rpm for 10 minutes and by rinsing with deionized water.
Raman spectra of Raman probes
The Raman spectra of the different Raman probes, DTTC, DTDC, IR792, and IR820, were obtained using a Horiba Jobin Yvon LabHR800 instrument with power of 20 mW at 10× magnification. The instrument was first calibrated for the silicon peak at 520 cm−1. An amount of 20 μL of the samples was placed on the fused silica slide and irradiated with a red laser at a wavelength of 785 nm.
Conjugation of SERS tag with antibodies
The SERS tag of the Raman probe, IR820, was conjugated with the FITC-conjugated antibody through an ethyl dimethylaminopropyl carbodiimide–N-hydroxysuccinimide coupling reaction.7 An amount of 5 μL of 0.2 M freshly prepared ethyl dimethylaminopropyl carbodiimide and 10 μL of 0.2 M freshly prepared N-hydroxysuccinimide was added to the SERS tags suspended in 15 mM HEPES and gently mixed for 3 minutes. The excess ethyl dimethylaminopropyl carbodiimide–N-hydroxysuccinimide was removed by centrifuging three times with 15 mM HEPES at 3,000 rpm for 10 minutes. Then, the FITC-conjugated anti-EGFR was reacted with the carboxyl-activated SERS tags for 2 hours at room temperature and then at 4°C overnight. The excess and unbound antibodies were removed by three rounds of centrifugation at 3,000 rpm for 10 minutes.
All the experiments were repeated three times.
Results and discussion
Synthesis of MBAuNP
HEPES is a zwitter ion. At pH 7.4, the HEPES buffer, which has piperazine groups, produces nitrogen-centered free radicals that reduce the trivalent gold ions to divalent gold ions and monovalent gold ions, and finally into gold zerovalent ions which is due to the aggregation of the reduced gold ions. This reaction proceeds until the availability of gold ions and after that the HEPES acts as a stabilizing agent. The salt HAuCl4 contains Au3+ ions, and these ions are reduced by the free radicals generated by HEPES at pH 7.4. Since the availability of these Au3+ ions is limited, the reduction continues until their availability.8 Per the literature, the mechanism for the redox reaction is:
Au(III) + HEPES→Au(II) + cationic free radicals
2Au(II) → Au(III) + Au(I)
Au(I) + HEPES → Au(0) + cationic radicals
n Au(0) → (Au(0))n {AuNPs}
Cationic free radicals + O2 → degraded products.
Characterization of MBAuNP
The ultraviolet-visible spectra of the MBAuNP showed the presence of two peaks: a transverse plasmonic8 resonance of a small peak at 530 nm, confirming the presence of a spherical core, and a longitudinal plasmonic resonance8 of broad peak at 665 nm, confirming the presence of the branched shaped aggregation on the spherical core (Figure 2). The broad red shift from 630 to 700 nm is caused by the collective oscillation of free electrons (the surface plasmonic effect) on the aggregated gold ions, which were present on the branches of the MBAuNP.
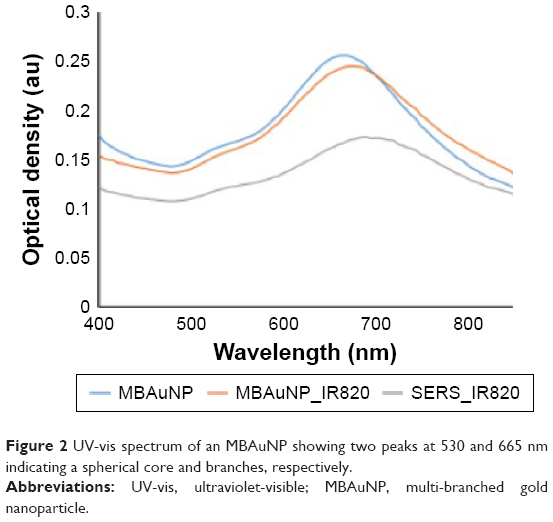 | Figure 2 UV-vis spectrum of an MBAuNP showing two peaks at 530 and 665 nm indicating a spherical core and branches, respectively. |
The ultraviolet-visible spectrum of MBAuNP was confirmed by the TEM images, which confirmed the presence of the spherical core surrounded with 12 to 14 numbers of branches with varying lengths from 8 to 29 nm. The size of MBAuNP ranged from 55 nm to 65 nm (Figure 3). The more the number of branches, the higher the oscillation of free electrons on the surface, causing a plasmonic effect, which is the underlying cause for the SERS effect. This was further confirmed by the scanning electron microscope image, which showed a uniform morphology of MBAuNP and provides an insight into 3D orientation of distributed branched structures (Figure 4). The bright fields on the edges of the MBAuNP were due to the aggregated Au ions on the core.
 | Figure 3 TEM images of an MBAuNP. |
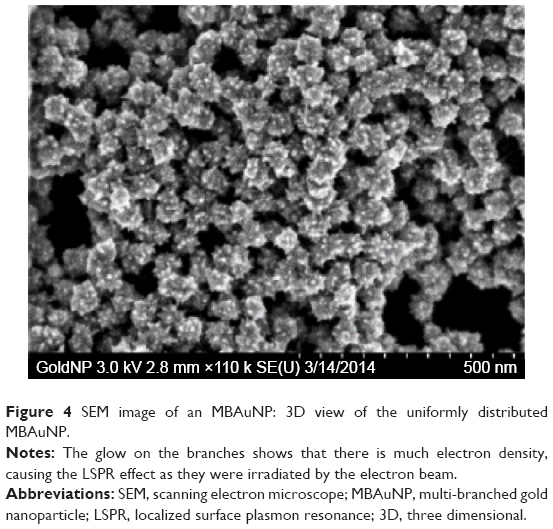 | Figure 4 SEM image of an MBAuNP: 3D view of the uniformly distributed MBAuNP. |
The DLS data showed that the MBAuNP, MBAuNP_IR820, and SERS_IR820 tag was 69.8, 76.7, and 79.2 nm, respectively. The increase in the hydrodynamic diameter indicates the presence of reporter IR820 on the MBAuNP and the encapsulation of dBSA of the same as shown in Figure 5.
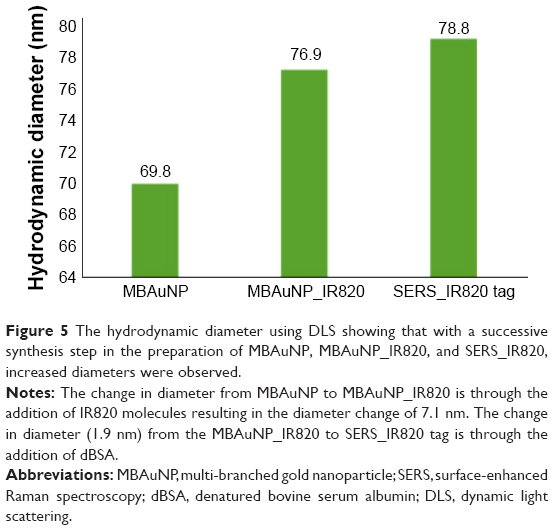 | Figure 5 The hydrodynamic diameter using DLS showing that with a successive synthesis step in the preparation of MBAuNP, MBAuNP_IR820, and SERS_IR820, increased diameters were observed. |
Characterization of SERS tags
The Raman spectra of the Raman probes functionalized on the MBAuNP showed the maximum Raman intensity of 213.6, 598.5, 1,020.52, and 1,999.21 for DTDC, DTTC, IR792, and IR820, respectively (Figure 6). Since IR820 exhibited maximum Raman intensity, we prepared SERS tags with an IR820 probe for further experiments.
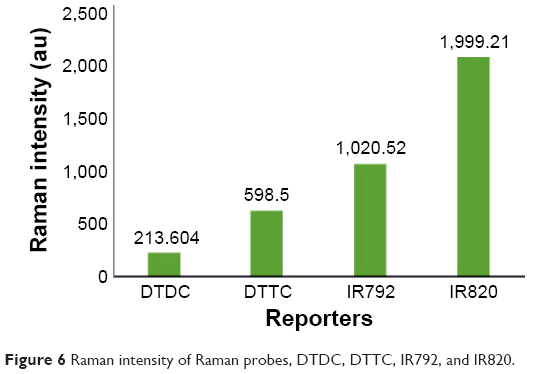 | Figure 6 Raman intensity of Raman probes, DTDC, DTTC, IR792, and IR820. |
Bovine serum albumin, which is generally used as a stabilizing agent, has 35 thiol (–SH) groups of which 34 are involved in the formation of disulfide bonds leaving one free thiol group. These –SH are liberated by denaturing the bovine serum albumin, thereby making more –SH groups available for conjugating with MBAuNP. Moreover, dBSA is used as a stabilizing agent due to its ability to quench the fluorescence.9 The dBSA attached to the MBAuNP through cysteine bonds and were formed by reducing bovine serum albumin with sodium borohydride.6 These free thiol (–SH) groups, which possess a high affinity toward AuNP surfaces, were used to bind dBSA to the nanoparticle while making available carboxyl groups for the attachment of the antibody.
Raman spectra of the SERS tag with IR820, MBAuNP with IR820, and IR820 solution without MBAuNP are shown in Figure 7. The encapsulation of functionalized MBAuNP with IR820 by dBSA showed a decrease in the Raman intensity, as shown in Figure 7.
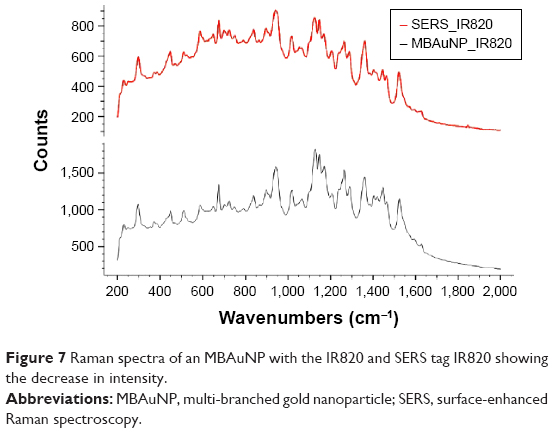 | Figure 7 Raman spectra of an MBAuNP with the IR820 and SERS tag IR820 showing the decrease in intensity. |
Fingerprint of IR820
The IR820 has two indole rings, separated by a polymethine chain with one benzyl chloride at the middle of the chain, and the entire chain is terminated by benzene rings at the ends10,11 as shown in the inset of Figure 8.
 | Figure 8 Fingerprint of IR820; the inset shows the chemical structure of IR820. |
The peaks were analyzed with reference to the study completed by Gediminas Niaura et al and Giuseppe Perna et al on Fourier Transform–Raman spectrum for N-[2-(1H-indol-3-yl)ethyl]-8-mercaptooctanamide12 and vibrational characterization for Eumelanin.13 The SERS peak at 1,523.07 cm−1 corresponds to the pyrrole stretching, 1,626.78 cm−1 corresponds to the superposition of in-plane benzene and pyrrole stretching mode, 1,446.21 cm−1 corresponds to –NH deformation and benzene deformation. The C–N bond stretching of the pyrrole ring at 1,359.74 cm−1 and Fermi resonance effect was observed at 1,127.79, 1,147.69, and 1,168.97 cm−1 for the –CH bond of the benzene ring and C–C bonds from the backbone structure of polymethine at 1,228.28 and 1,264.35 cm−1. Thus, the fingerprint of the IR820 was obtained by the SERS effect clearly showing the backbone, polymethine structure, indole, and benzene rings.
Comparison of MBAuNP SERS tags with spherical AuNP SERS tags
The Raman intensity enhancement of the MBAuNP SERS tags was studied and compared with those of the spherical AuNP. A SERS tag of spherical AuNP was prepared by the method similar to that explained in the “Materials and methods” section. Though the spherical particles enhanced the Raman signal, it was much less when compared to that of the MBAuNP. Moreover, the number of spherical AuNPs per mL, 1.957×10¹⁰, was greater than that of the MBAuNP per mL, 1.577×10¹⁰; the number of particles was calculated in reference with Khlebtsov14 and is shown in the Supplementary materials (Section 1). So, the results of this study showed that it is the shape of the nanoparticles that plays a vital role in the SERS effect more than the number of particles. The fingerprint region of the IR820 was clearly visible for the MBAuNP than that of the spherical particles (Figure 9). The Raman scattering signal enhancement factor of the MBAuNP was calculated as 4.028×10⁴; the calculation for SERS enhancement factor is shown in Supplementary materials (Section 2).
 | Figure 9 A comparative study of Raman spectra of SERS_MBAuNP_IR820 tag and SERS_Spherical_IR820 tag: the spherical nanoparticle enhances the Raman signal from IR820 but is much less than that of MBAuNP. |
FITC-conjugated anti-EGFR with SERS tag
The conjugation of FITC-conjugated anti-EGFR was confirmed with the aid of a Carl-Zeiss confocal microscope. The antibody attached particles aggregated to enable easy visualization through the confocal microscope. The SERS tags with antibody showed green fluorescence from FITC (Figure 10).
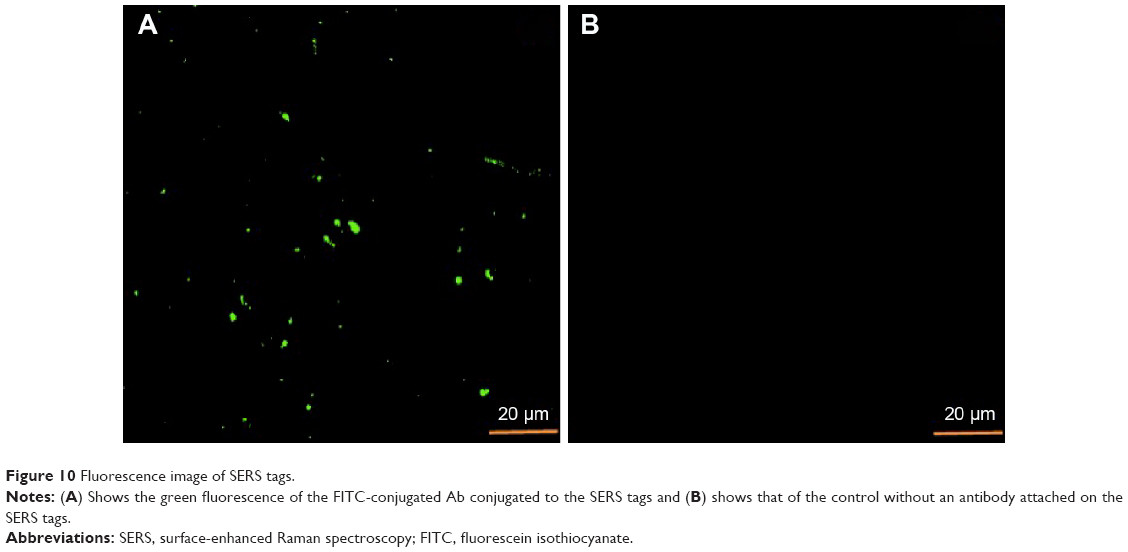 | Figure 10 Fluorescence image of SERS tags. |
Conclusion
Results demonstrate that MBAuNP enhanced the Raman signal of IR820, with and without complexation to anti-EGFR antibody, considerably more than the enhancement seen with spherical AuNPs. The enhancement factor of MBAuNP was 4.028×10⁴. This study demonstrates promise for the use of MBAuNP complexed with various antibodies in the detection and characterization of various diseases with discernible surface markers. Future studies will extend these findings by employing MBAuNP-enhanced SERS to detect EGFR, and similar marker substances, on the surface of cancer cells.
Acknowledgment
The authors would like to thank Northeastern University for sponsoring this study.
Disclosure
The authors report no conflicts of interest in this work.
References
Hao F, Nehl C, Hafner J, Norlander P. Plasmon resonances of gold nanostar. Nano Lett. 2007;7(3):729–732. | ||
Wang Y, Yan B, Chen L. SERS tags: novel optical nanoprobes for bioanalysis. ACS Chem Rev. 2013;113(3):1391–1428. | ||
Elsevier. Raman spectroscopy and related techniques. Available form: www.knovel.com. Accessed October 19, 2015. | ||
Alvarez-Puebla RA, Liz-Marzán LM. SERS-based diagnosis and biodetection. Small. 2010;6(5):604–610. | ||
Yigit MV, Medarova Z. In vivo and ex vivo applications of gold nanoparticles for biomedical SERS imaging. Am J Nucl Med Mol Imaging. 2012;2(2):232–241. | ||
Xie J, Zhang Q, Lee J, Wang D. The synthesis of SERS-active gold nanoflower tags for in vivo applications. ACS Nano. 2008;2(12):2473–2480. | ||
Bartczak D, Kanaras A. Preparation of peptide-functionalized gold nanoparticles using one pot EDC/sulfo-Nhs coupling. Langmuir. 2011;27(16):10119–10123. | ||
Habib A, Tabata M, Wu Y. Formation of gold nanoparticles by Good’s buffer. Chem Soc Jpn. 2005;78:262–269. | ||
Li H, Guo Y, Xiao L, Chen B. Selective and sensitive detection of acetyl cholinesterase activity using denatured protein protected gold nanoclusters as a label-free probe. Analyst. 2014;139:285–289. | ||
Fernandez-Fernandez A, Manchanda R, Lei T, et al. Comparative study of the optical and heat generation properties of IR820 and indocyanine green. Mol Imaging. 2012;11(2):99–113. | ||
Fernandez-Fernandez A, Manchanda R, Lei T, Srinivasan S, McGoron AJ. IR820 conjugates for image-guided cancer therapy. IFMBE Proc. 2013;39:1636–1639. | ||
Razmutė I, Kuodis Z, Eicher-Lorka O, Niaura G. Surface enhanced Raman spectroscopy of indole ring terminated self assembled monolayer on silver electrode. CHEMIJA. 2006;17(1):25–30. | ||
Perna G, Lasalvia M, Gallo C, Quartucci G, Capozzi V. Vibrational characterization of synthetic Eumelain by means of Raman and Surface Enhanced Raman Scattering. Open Surf Sci J. 2013;5:1–8. | ||
Khlebtsov N. Determination of size and concentration of gold nanoparticles from extinction spectra. Anal Chem. 2008;80(17): 6620–6625. |
Supplementary materials
Section 1
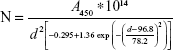
The diameter of multi-branched gold nanoparticle (MBAuNP) was calculated using the Mie theory for Maxwell’s equations, which gives the extinction and scattering efficiency of small nanoparticles. In accordance with Khlebtsov,14 the particle diameter was calculated from ultraviolet-visible spectra. The explanation is as follows.
For the particles whose diameter, d, varies from 35 to 100 nm:
|
|

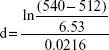
for d>25 nm, the theoretical fit parameters were λ0=512, L1=6.53, and L2=0.216.
For spherical gold nanoparticles:
|
|
d=67.39 nm.
The number density of the particle is given by the equation:
|
|
The Beer’s law, A=ε*C*l,
where
A is the absorbance
C is the concentration of the nanoparticle
l is the path length.
For l=1 cm and area of the micro-well plate to be 0.56 cm2.
For A450=0.3125, d=60 nm, the number of spherical particle was found to be 1.957×10¹⁰/mL which is ~ equal to that of the vendors quote.
In a similar way, the number of MBAuNP/mL was calculated to be:
NMBAuNP =1.577×10¹⁰/mL |
Section 2
The surface-enhanced Raman spectroscopy (SERS) enhancement factor can be determined using the following equation:
|
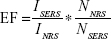
where
EF is the enhancement factor
ISERS and INRS are the SERS intensity and normal Raman intensity, respectively
NSERS and NNRS are the number of particles probed for SERS and normal Raman setting.
An amount of 20 μL of a 5 μM IR820 solution and 20 μL of multi-branched gold nanoparticle (MBAuNP)_IR820 were studied under identical conditions: laser power of 20 mW and 785 nm wavelength at 10× magnification.
The number of particles (IR820) adhered on the MBAuNP was calculated using optical density; it was found that there were 901 molecules adsorbed on one MBAuNP.
There were 1.577×10¹⁰ MBAuNPs in 1 mL (calculated using ultraviolet spectrum).
Since the enhancements are more at hotspots which are the branches for this MBAuNP, assuming the branches to be the triangle and from the transmission electron microscope image, the width of branch =7 nm and the length of the branch =20 nm.
The area of the hotspot =½*base*height =70 nm2.
The transmission electron microscope image shows that the number of branches varies from 12 to 14; assuming there were 12 branches on one MBAuNP:
The total surface area available for the IR820 to be adsorbed =12*70=840 nm2.
The total surface area of the hotspots/surface area of the spherical core =840/(π*302+840)=0.229.
The total number of particles adherent on the hotspots in one MBAuNP =0.229*901=206.3 molecules of IR820.
There were 6.3×10⁸ MBAuNPs in 20 μL, so the number of IR820 molecules adhered on these MBAuNP, NSERS =1.3013×10¹¹ molecules.
NNRS, the number molecules probed for normal Raman =6.023*1013.
The peak at 1,127.79 cm−1 was considered for this study because it represents the –CH bond stretching of the benzene ring.
ISERS at 1,127.79 cm−1 is 1,404.14 units.
INRS at 1,127.79 cm−1 is 734.06 units.
|
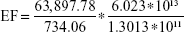
EF =4.028*104.
 © 2015 The Author(s). This work is published and licensed by Dove Medical Press Limited. The
full terms of this license are available at https://www.dovepress.com/terms
and incorporate the Creative Commons Attribution
- Non Commercial (unported, 3.0) License.
By accessing the work you hereby accept the Terms. Non-commercial uses of the work are permitted
without any further permission from Dove Medical Press Limited, provided the work is properly
attributed. For permission for commercial use of this work, please see paragraphs 4.2 and 5 of our Terms.
© 2015 The Author(s). This work is published and licensed by Dove Medical Press Limited. The
full terms of this license are available at https://www.dovepress.com/terms
and incorporate the Creative Commons Attribution
- Non Commercial (unported, 3.0) License.
By accessing the work you hereby accept the Terms. Non-commercial uses of the work are permitted
without any further permission from Dove Medical Press Limited, provided the work is properly
attributed. For permission for commercial use of this work, please see paragraphs 4.2 and 5 of our Terms.