Back to Journals » Clinical Ophthalmology » Volume 12
Identifying risk factors for blindness from primary open-angle glaucoma by race: a case–control study
Authors Williams AM ![]() , Huang W, Muir KW
, Huang W, Muir KW ![]() , Stinnett SS, Stone JS
, Stinnett SS, Stone JS ![]() , Rosdahl JA
, Rosdahl JA ![]()
Received 7 June 2017
Accepted for publication 27 December 2017
Published 20 February 2018 Volume 2018:12 Pages 377—383
DOI https://doi.org/10.2147/OPTH.S143417
Checked for plagiarism Yes
Review by Single anonymous peer review
Peer reviewer comments 4
Editor who approved publication: Dr Scott Fraser
Andrew M Williams,1 Wei Huang,2 Kelly W Muir,3,4 Sandra S Stinnett,3 Jordan S Stone,5 Jullia A Rosdahl3
1Department of Ophthalmology, University of Pittsburgh Medical Center, Pittsburgh, PA, USA; 2Charlotte Eye Ear Nose & Throat Associates, Charlotte, NC, USA; 3Department of Ophthalmology, Duke University Medical Center, Durham, NC, USA; 4Health Services Research and Development, Durham Veterans Affairs Medical Center, Durham, NC, USA; 5School of Medicine, University of California San Diego, La Jolla, CA, USA
Purpose: To examine the factors associated with blindness from primary open-angle glaucoma (POAG) among black and white patients at our institution.
Patients and methods: For this retrospective, case–control study, patients legally blind from POAG (“cases”) were matched on age, race, and gender with non-blind POAG patients (“controls”). Thirty-seven black case–control pairs and 19 white case–control pairs were included in this study. Clinical variables were compared at initial presentation and over the course of follow-up.
Results: Black case–control pairs and white case–control pairs had similar characteristics at presentation, including cup-to-disc ratio and number of glaucoma medications. However, over the course of follow-up, black cases underwent significantly more glaucoma surgeries than matched controls (2.4 versus 1.2, p=0.001), whereas white cases and controls had no significant difference in glaucoma operations (0.9 versus 0.6, p=0.139). Our analysis found that glaucoma surgery is associated with blindness in black patients (odds ratio [OR] 1.6, 95% CI 1.1–2.2) but not in white patients (OR 1.5, 95% CI 0.7–3.2).
Conclusion: Black and white case–control pairs with POAG shared similar risk factors for blindness at presentation. However, over the follow-up period, black cases required significantly more glaucoma surgeries compared to black controls, whereas there was no significant difference in surgery between white cases and controls. There was no difference in medication changes in either case–control set.
Keywords: health disparities, glaucoma surgery, glaucoma treatment, glaucoma medications
Introduction
Primary open-angle glaucoma (POAG) is a leading cause of irreversible blindness. Global prevalence of glaucoma was estimated at 64.3 million people in 2013 and is projected to increase to 76.0 million by 2020.1 Despite significant progress to reduce rates of blindness from glaucoma, loss of sight from this disease remains a significant burden on public health.2
Large population-based studies have revealed that black patients suffer disproportionally from glaucoma and glaucoma-related blindness. For example, the Baltimore Eye Survey demonstrated stark differences in ocular health between white and black residents of East Baltimore aged 40 years or older, where black residents were twice as likely to be blind compared to white residents.3 The age-adjusted rate of POAG was 4- to 6.6-fold higher in blacks than whites in this population, and POAG onset began about 10 years earlier in black residents.4,5 In a different setting, the Salisbury Eye Evaluation Project demonstrated that black Medicare beneficiaries in a semirural area had race-specific prevalence of visually impairing glaucoma that was 15 times higher than their white neighbors.6 More recently, national survey data revealed continued racial disparities in glaucoma disease burden,7 and we found at our tertiary eye center that black (versus white) race remains a significant risk factor for glaucoma blindness.8
The purpose of this study is to examine factors associated with blindness from POAG among black and white patients at our tertiary eye center. We utilize a case–control design that pairs blind POAG cases with non-blind POAG controls, matched on age, gender, and race. Within this case–control set, we compare relevant clinical variables between black cases and controls and white cases and controls to assess the risk factors for blindness for the two racial groups.
Patients and methods
Data sources
This retrospective chart review was approved by the Duke University Institutional Review Board; informed consent was waived based on its retrospective design, minimal risk, and confidentiality protections. We utilized a dataset of glaucoma patient visits at Duke, which we described previously.8 In brief, our dataset represents a random sample of patients with a glaucoma diagnosis code who visited a glaucoma service provider at the Duke University Eye Center between July 2007 and July 2010. Of 4,707 total unique patients identified, the medical records of 1,629 were randomly selected for abstraction. After initial chart review, 174 patients were excluded due to lack of available electronic medical record documentation (n=135), lack of glaucoma diagnosis (n=39), or not being seen by the glaucoma service (n=1). The remaining 1,454 were included in the dataset. Demographic information, visual function metrics, ocular history, and number and types of glaucoma treatments and surgeries were among the information obtained from the medical records. Race was determined by patient self-identification.
For this follow-up, case–control study on POAG-related blindness, 95 blind POAG cases were identified from the dataset. Cases were included if they were blind at presentation or if blindness developed over the course of follow-up. Blindness was determined using the US legal definition: in the better-seeing eye, a best-corrected visual acuity no better than 20/200 or a constricted visual field less than 20°. Each record was reviewed for other potential causes of blindness, and blind subjects were not included in this study if there was significant macular degeneration, central retinal vein occlusion, or other severe eye disease that could confound with POAG as the cause of blindness.
Of the 95 blind POAG cases identified, 80 could be matched to non-blind POAG controls based on race, age (within year of birth), and gender (Figure 1). Specifically, non-blind controls were identified for 27 out of 30 blind black men, 24 of 30 blind black women, 14 of 17 blind white men, and 15 of 18 blind white women. For these 80 case–control pairs, one author (WH) carried out a comprehensive chart review of the subjects’ original medical records. Of these original 80 case–control pairs, a total of 24 pairs were excluded because of the inability to locate paper charts (three cases, four controls), race and/or gender mismatch error between the query tool (Duke Enterprise Data Unified Content Explorer)9 and the medical record (one case, six controls), and non-POAG diagnosis miscoded as POAG (five cases, five controls). The remaining 56 case–control pairs were included in our analysis. The race–gender composition of these 56 case–control pairs included 21 pairs of black men, 16 pairs of black women, 9 pairs of white men, and 10 pairs of white women.
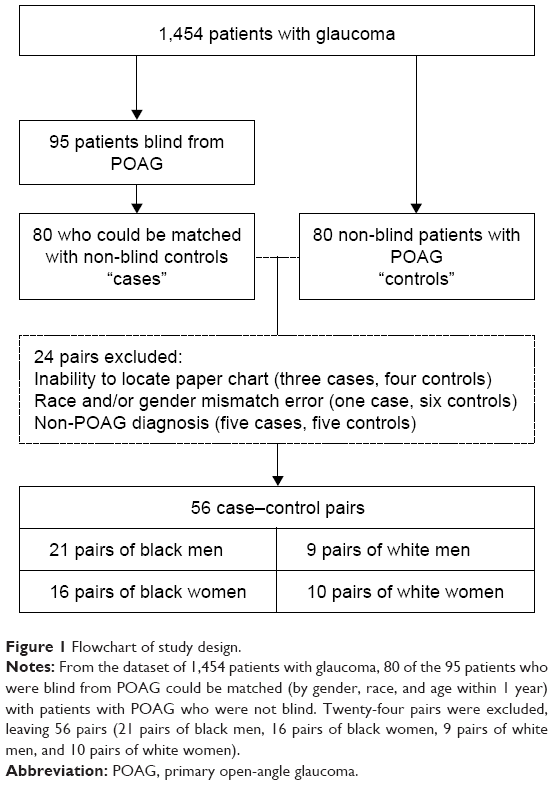 | Figure 1 Flowchart of study design. |
Measurements
Four categories of measurements were obtained for the 56 case–control pairs: 1) demographic information (age, gender, and race); 2) clinical variables at presentation to our tertiary eye center (baseline visual acuity, intraocular pressure [IOP], cup-to-disc ratio, and automated Humphrey visual fields); 3) ocular history at presentation (comorbid ocular diagnoses and glaucoma history, medications, and surgeries); and 4) clinical course on our service (duration of follow-up, number of glaucoma medications added, and number and types of glaucoma surgeries undergone). Medical and surgical treatment of glaucoma was used as a surrogate measure of disease progression.
Statistical analyses
Statistical analyses were performed using SAS software, version 9.3 (SAS Inc., Cary, NC, USA). A p-value less than 0.05 was considered statistically significant. Descriptive statistics were summarized as mean ± SD.
A Wilcoxon rank sum test was conducted to compare initial visual acuity, IOP, cup-to-disc ratio, and visual fields between black cases and black controls and between white cases and white controls. Fisher’s exact test was also used to compare history of prior treatments before presentation for the two case–control sets.
Mean deviation on initial visual field and duration of follow-up were compared between cases and controls using the Wilcoxon rank sum test. A chi-squared test was used to compare types of prior glaucoma treatments at presentation between cases and controls. Comparison between the proportions of black and white patients who presented to our service with blindness from glaucoma was made using Fisher’s exact test. Presenting ocular comorbidities and initial glaucoma hemifield test values were compared using Fisher’s exact test.
Medical and surgical treatments undergone during the course of follow-up were examined between cases and controls using a Wilcoxon rank sum test. Fisher’s exact test was used to compare history of laser trabeculoplasty over the course of follow-up. Number of medication changes was examined only for patients who did not undergo glaucoma surgery, as routine pre- and postoperative medication adjustments would confound with medication changes made in response to disease progression.
Finally, multivariable logistic regression was conducted for each clinical variable by race, controlling for age and gender, to calculate adjusted ORs for blindness, along with corresponding 95% CIs.
Results
A total of 37 black and 19 white case–control pairs of blind POAG cases and non-blind POAG controls were included. The average age and gender representation were similar between groups, as summarized in Table 1. There was no difference in number of years of follow-up at our eye center between black cases and white cases (8.00±5.51 versus 5.89±5.24, p=0.142) or between black controls and white controls (7.59±5.99 versus 7.37±5.90, p=0.869).
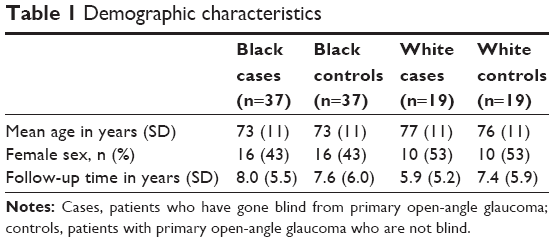 | Table 1 Demographic characteristics |
Initial presentation
The majority of patients who were blind from POAG within the study period had arrived blind at initial presentation to our glaucoma service, and there was no statistically significant difference in blindness at presentation between black cases (24/37) and white cases (14/19) (p=0.560).
Measures of visual function at initial presentation differed significantly between cases and controls of both races. Mean initial visual acuity in the better-seeing eye in LogMAR units (with Snellen equivalent) for black cases was 0.7±0.9 (20/100) compared to 0.1±0.1 (20/25) for black controls (p<0.001). Similarly, mean initial visual acuity in the better-seeing eye was 0.9±0.9 (20/160) for white cases compared to 0.1 (20/25) for white controls (p<0.001). Glaucoma Hemifield Test Results presented a similar pattern, with significant differences between cases and controls (p<0.001 for blacks, p=0.004 for whites in the better-seeing eye) (Table 2). These results indicated that poorer vision at presentation was a risk factor associated with eventual POAG blindness for both racial groups.
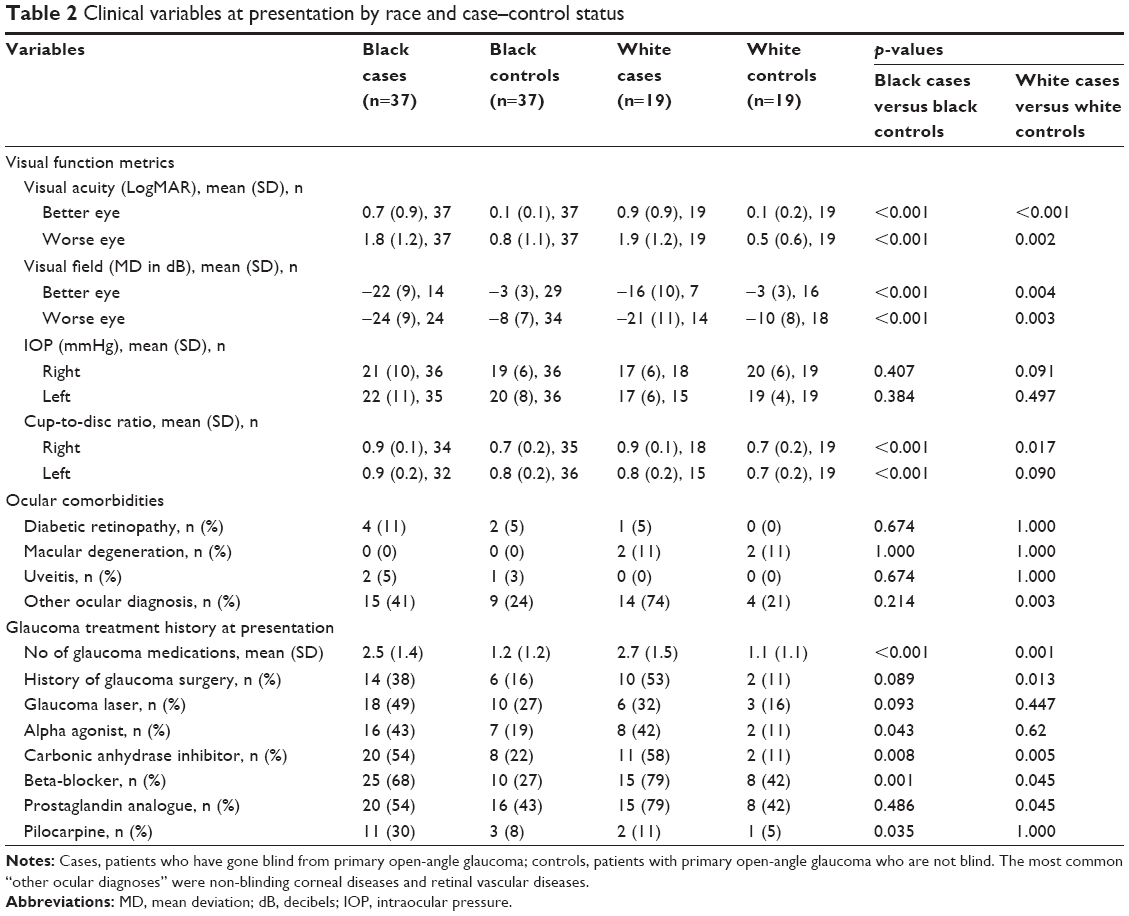 | Table 2 Clinical variables at presentation by race and case–control status |
In contrast, initial IOP was not significantly different between cases and controls of either race. Black cases averaged an IOP (in mmHg) of 21±10 in the right eye and 22±11 in the left eye compared to 19±6 and 20±8 for black controls (p=0.407 and p=0.384, respectively). Similarly, white cases averaged an IOP of 17±6 in the right eye and 17±6 in the left eye compared to 20±6 and 19±4 for white controls (p=0.091 and p=0.497, respectively) (Table 2).
The cup-to-disc ratio was significantly greater in black cases than controls (p<0.001), but greater in white cases than white controls only in the right eye but not in the left: 0.9±0.1 and 0.7±0.2 (p=0.017), and 0.8±0.2 and 0.7±0.2 (p=0.090), respectively (Table 2).
Ocular comorbidities at presentation were similar between black and white cases and controls, as demonstrated in Table 2. There was no significant association between blindness and diabetic retinopathy or uveitis (p=0.674 for black, p=1.00 for white), and macular degeneration was present only in white patients but not associated with blindness from POAG (p=1.000). White cases had significantly more “other” ocular diagnoses, including non-blinding corneal and retinal vascular disease, than white controls (p=0.003), but there was no difference between black cases and controls (p=0.214).
At presentation, cases were taking significantly more glaucoma medications than controls for both races (black: 2.5 versus 1.2, p<0.001; white: 2.7 versus 1.1, p=0.001). History of any glaucoma surgery was significantly associated with POAG blindness for white patients (p=0.013) but not for black patients (p=0.089), whereas history of glaucoma laser treatment was not significantly associated with blindness for either black (p=0.093) or white patients (p=0.447) (Table 2).
Clinical course
Over the duration of follow-up at our tertiary glaucoma service, a higher total number of glaucoma surgeries was associated with blindness among black case–control pairs but not among white, whereas number of glaucoma medications added was not associated with blindness for either race. Among patients who did not undergo surgery or laser treatment, black cases averaged an additional 1.3 medications over the course of follow-up compared to 0.7 for controls (p=0.131), whereas white cases averaged 0.5 medications removed compared to 0.8 added for controls (p=0.055). Regarding surgical interventions, black cases compared to controls underwent significantly more total surgeries (p=0.001) – including trabeculectomy (p=0.009), tube surgeries (p=0.012), and transscleral diode/endocyclophotocoagulation (p=0.011) – but there was no difference in surgical revision rates between cases and controls (p=0.428). None of these interventions was associated with blindness for white patients (p>0.100 for all). The power for detecting a difference of 0.3 in total surgeries in white cases compared to controls at a significance level of 0.05 was 17% (with n=19 in each group). A difference-in-differences analysis was conducted to examine the interaction between surgery and blindness for black cases and controls and white cases and controls, which trended toward significance (p=0.175). There was no difference in rates of laser trabeculoplasty or other ocular procedures between cases and controls of either race (p>0.200 for all) (Table 3).
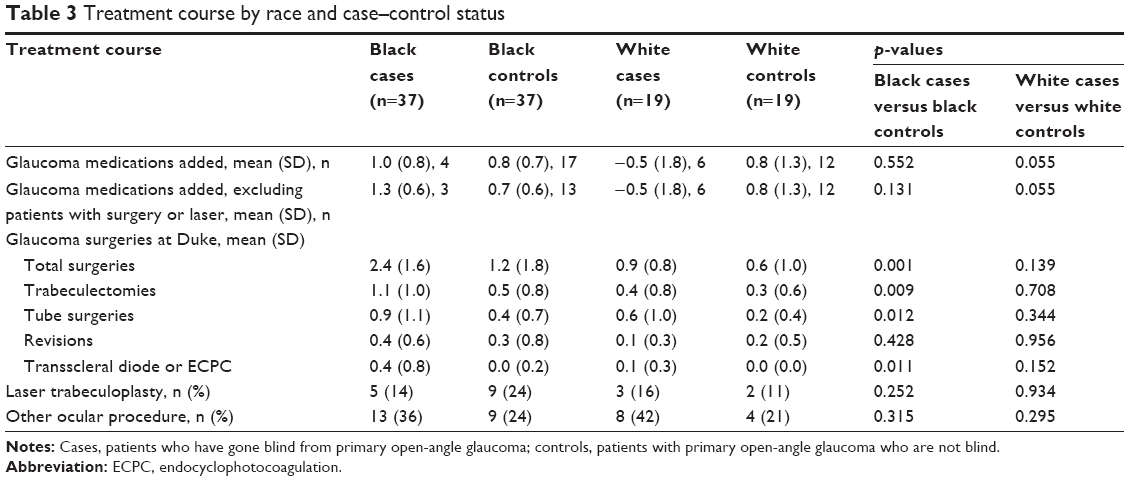 | Table 3 Treatment course by race and case–control status |
A multivariable logistic regression model adjusting for age and sex confirmed many of the unadjusted associations between clinical variables and risk of blindness (Table 4). Number of glaucoma medications at presentation was a predictor of blindness for both black patients (odds ratio [OR] 2.1, 95% CI 1.4–3.2) and white patients (OR 2.9, 95% CI 1.5–5.9), as was prior history of glaucoma surgery (black patients: OR 3.2, 95% CI 1.1–9.5; white patients: OR 9.2, 95% CI 1.6–52.6). In contrast to clinical variables at presentation, surgical procedures over the treatment course at our institution were significantly associated with blindness only for black patients. Specifically, total number of surgeries (OR 1.6, 95% CI 1.1–2.2), trabeculectomies (OR 2.1, 95% CI 1.2–3.8), and tube surgeries (OR 2.1, 95% CI 1.2–3.7) were significant risk factors for blindness for black patients, but there was no such association between these variables and blindness for white patients in our sample (p>0.05 for all). There was no association between number of medications added and blindness for either race (p>0.05) (Table 4).
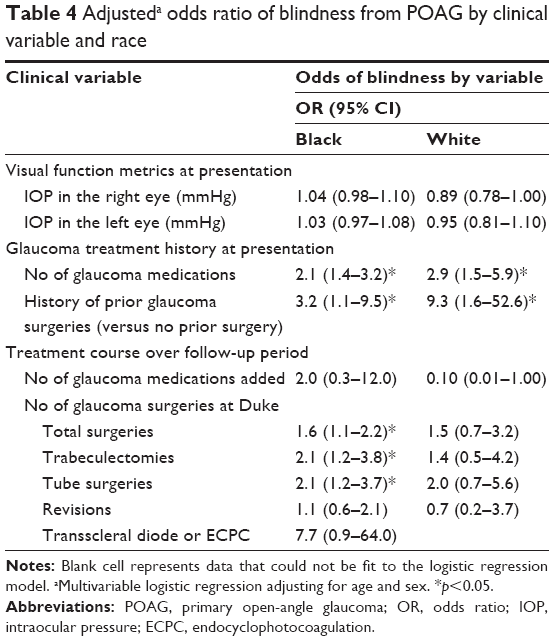 | Table 4 Adjusteda odds ratio of blindness from POAG by clinical variable and race |
Discussion
In this case–control study, black patients who have gone blind from POAG underwent more glaucoma operations than non-blind black POAG controls, but no association between surgery and blindness was identified among white patients. In contrast, there was no significant difference in medication changes between black cases and controls. Visual function metrics at initial presentation were similar between both case–control sets.
Previous population studies and retrospective reviews have identified risk factors for progression to blindness from glaucoma. At presentation, advanced stage of disease and moderate-to-advanced visual field loss are risk factors for developing blindness,10–16 as are higher initial IOP,10,15–18 greater cup-to-disc ratio,11 older age,10,13 and black or nonwhite race.6,8,11 Over the course of treatment, glaucoma patients who have gone blind are more likely than non-blind patients to have taken four or more glaucoma medications,8 changed medications,14 undergone glaucoma surgery,8,17 had fluctuation in IOP,12,14,16 demonstrated poor compliance or follow-up,11–13,16,17 had more annual visits to an ophthalmologist,14 taken more visual field tests,14 had a longer mean duration of disease,15 and died at an older age.15
Our study confirms the significance of many of these risk factors between cases and controls at our tertiary eye center, including initial cup-to-disc ratio, initial visual field loss, and number of glaucoma surgeries over the course of follow-up. Notably, however, higher initial IOP at presentation was not greater in the cases than controls in our study population. The lack of association between initial IOP and blindness has been noted previously in other studies on glaucoma-related blindness,11,14 which could reflect heterogeneity in the types and mechanisms of glaucoma represented in these populations. Alternatively, patients presenting to a tertiary eye center for glaucoma care may have had various degrees of previous treatments before presentation. In fact, cases in our study sample were more likely than non-blind controls to present to our eye center taking more glaucoma medications and having already undergone glaucoma surgery, which could have lowered the mean IOP of cases to the level of controls. Importantly, although clinical characteristics at initial presentation differed between cases and controls, these risk factors for blindness did not differ between black and white case–control sets.
In contrast, black and white case–control sets differed significantly in risk factors for blindness over the clinical course at our center. Specifically, we found that black cases underwent more glaucoma surgeries than controls, whereas there was no significant difference between white cases and white controls. Black cases may have undergone more operations due to a higher risk of trabeculectomy failure in this racial group, leading to higher rates of repeat operations.19–21 For example, the Advanced Glaucoma Intervention Study (AGIS) trials revealed that black patients had higher rates of failure of first glaucoma intervention22 and that initial intervention with trabeculectomy is less effective compared to whites,23 even at 10 years of follow-up.24 Given that the present report used surgical treatment as a surrogate measure of disease progression, the higher rates of surgery in black cases compared to controls could suggest either that a subgroup of black patients respond poorly to surgery or that a subgroup of black patients had generally more aggressive disease, and therefore underwent more surgical intervention. The black patients were also younger which may have contributed to surgical failure. We also found that the white patients who were blind from glaucoma had more ocular comorbidities such as non-blinding corneal diseases and retinal vascular diseases than the non-blind white patients, and this difference was not found in the black glaucoma patients. It is possible that the presence of the ocular comorbidities affected the clinical decision regarding glaucoma surgery.
Factors other than differences in response to treatment could also account for the more aggressive clinical course of black glaucoma cases in our study. In this retrospective dataset, we are unable to ascertain adherence rates to the prescribed glaucoma therapy, which has been independently associated with blindness.11–13,16,25–27 Additionally, other unexamined variables that could factor into progression to blindness include socioeconomic status,28 health literacy,29–30 and central corneal thickness. A prospective, longitudinal study would provide further insight into reasons for racial disparities in POAG blindness. To the best of our knowledge, large national databases do not include granular clinical data for blindness determination, but widespread adoption of electronic record systems and clinical outcomes data repositories will likely make larger retrospective studies at this level of detail possible. Nonetheless, our case–control study design highlights important differences in treatment course between black and white patients who have gone blind from glaucoma.
In conclusion, this study finds that black and white case–control sets at our tertiary eye center had similar risk factors for blindness at initial presentation, but black cases underwent more glaucoma surgeries than black controls, while white cases and controls had no significant difference in number of surgeries. The contrasting differences in treatment patterns between black and white patients blinded by POAG may reflect racial differences in response to medication or surgery, underlying genetic susceptibility to glaucoma progression, or social factors that could not be examined in our retrospective study. Further research is needed to confirm whether these treatment differences occur with larger sample sizes in other practice settings and to identify what underlying factors could account for racial differences in treatment among patients blind from POAG.
Disclosure
Dr Muir receives salary support from a VA Health Services Research and Development Career Development Award. Dr Rosdahl received salary support from a K12 career development award from the National Eye Institute.
The authors report no other conflicts of interest in this work.
References
Tham YC, Li X, Wong TY, Quigley HA, Aung T, Cheng CY. Global prevalence of glaucoma and projections of glaucoma burden through 2040: a systematic review and meta-analysis. Ophthalmology. 2014;121(11):2081–2090. | ||
Malihi M, Moura Filho ER, Hodge DO, Sit AJ. Long-term trends in glaucoma-related blindness in Olmsted County, Minnesota. Ophthalmology. 2014;121(1):134–141. | ||
Tielsch JM, Sommer A, Witt K, Katz J, Royall RM. Blindness and visual impairment in an American urban population: the Baltimore Eye Survey. Arch Ophthalmol. 1990;108(2):286–290. | ||
Sommer A, Tielsch JM, Katz J, et al. Racial differences in the cause-specific prevalence of blindness in east Baltimore. N Engl J Med. 1991;325(20):1412–1417. | ||
Tielsch JM, Sommer A, Katz J, Royall RM, Quigley HA, Javitt J. Racial variations in the prevalence of primary open-angle glaucoma: the Baltimore Eye Survey. JAMA. 1991;266(3):369–374. | ||
Munoz B, West SK, Rubin GS, et al. Causes of blindness and visual impairment in a population of older Americans: the Salisbury Eye Evaluation Study. Arch Ophthalmol. 2000;118(6):819–825. | ||
Zhang X, Cotch MF, Ryskulova A, et al. Vision health disparities in the United States by race/ethnicity, education, and economic status: findings from two nationally representative surveys. Am J Ophthalmol. 2012;154(6):53–62. | ||
Stone JS, Muir KW, Stinnett SS, Rosdahl JA. Glaucoma blindness at a tertiary eye care center. N C Med J. 2015;76(4):211–218. | ||
Horvath MM, Winfield S, Evans S, Slopek S, Shang H, Ferranti J. The DEDUCE Guided Query tool: providing simplified access to clinical data for research and quality improvement. J Biomed Inform. 2011;44(2):266–276. | ||
Rossetti L, Digiuni M, Giovanni M, et al. Blindness and glaucoma: a multicenter data review from 7 academic eye clinics. PLoS One. 2015;10(8):e0136632. | ||
Chen PP. Blindness in patients with treated open-angle glaucoma. Ophthalmology. 2003;110(4):726–733. | ||
Forsman E, Kivelä T, Vesti E. Lifetime visual disability in open-angle glaucoma and ocular hypertension. J Glaucoma. 2007;16(3):313–319. | ||
Chen PP. Risk and risk factors for blindness from glaucoma. Curr Opin Ophthalmol. 2004;15(2):107–111. | ||
Oliver JE, Hattenhauer MG, Herman D, et al. Blindness and glaucoma: a comparison of patients progressing to blindness from glaucoma with patients maintaining vision. Am J Ophthalmol. 2002;133(6):764–772. | ||
Peters D, Bengtsson B, Heijl A. Factors associated with lifetime risk of open-angle glaucoma blindness. Acta Ophthalmol. 2014;92(5):421–425. | ||
Kooner KS, AlBdoor M, Cho BJ, Adams-Huet B. Risk factors for progression to blindness in high tension primary open angle glaucoma: comparison of blind and nonblind subjects. Clin Ophthalmol. 2008;2(4):757–762. | ||
Pleet A, Sulewski M, Salowe RJ, et al. Risk factors associated with progression to blindness from primary open-angle glaucoma in an African-American population. Ophthalmic Epidemiol. 2016;23(4):248–256. | ||
Kwon YH, Kim CS, Zimmerman MB, Alward WL, Hayreh SS. Rate of visual field loss and long-term visual outcome in primary open-angle glaucoma. Am J Ophthalmol. 2001;132(1):47–56. | ||
Borisuth NS, Phillips B, Krupin T. The risk profile of glaucoma filtration surgery. Curr Opin Ophthalmol. 1999;10(2):112–116. | ||
Morris DA, Peracha MO, Shin DH, Kim C, Cha SC, Kim YY. Risk factors for early filtration failure requiring suture release after primary glaucoma triple procedure with adjunctive mitomycin. Arch Ophthalmol. 1999;117(9):1149–1154. | ||
Kupin TH, Juzych MS, Shin DH, Khatana AK, Olivier MM. Adjunctive mitomycin C in primary trabeculectomy in phakic eyes. Am J Ophthalmol. 1995;119(1):30–39. | ||
AGIS Investigators. The Advanced Glaucoma Intervention Study (AGIS): 4. Comparison of treatment outcomes within race: seven-year results. Ophthalmology. 1998;105(7):1146–1164. | ||
AGIS Investigators. The Advanced Glaucoma Intervention Study (AGIS): 9. Comparison of glaucoma outcomes in black and white patients within treatment groups. Am J Ophthalmol. 2001;132(3):311–320. | ||
AGIS Investigators. The Advanced Glaucoma Intervention Study (AGIS): 13. Comparison of treatment outcomes within race: 10-year results. Ophthalmology. 2004;111(4):651–664. | ||
Friedman DS, Hahn SR, Gelb L, et al. Doctor–patient communication, health-related beliefs, and adherence in glaucoma: results from the glaucoma adherence and persistency study. Ophthalmology. 2008;115(8):1320–1327. | ||
Schwartz GF, Quigley HA. Adherence and persistence with glaucoma therapy. Surv Ophthalmol. 2008;53 Suppl 1:S57–S68. | ||
Newman-Casey PA, Blachley T, Lee PP, Heisler M, Farris KB, Stein JD. Patterns of glaucoma medication adherence over four years of follow-up. Ophthalmology. 2015;122(10):2010–2021. | ||
Fraser S, Bunce C, Wormald R, Brunner E. Deprivation and late presentation of glaucoma: case-control study. BMJ. 2001;322(7287):639–643. | ||
Juzych MS, Randhawa S, Shukairy A, Kaushal P, Gupta A, Shalauta N. Functional health literacy in patients with glaucoma in urban settings. Arch Ophthalmol. 2008;126(5):718–724. | ||
Muir KW, Santiago-Turla C, Stinnett SS, et al. Health literacy and adherence to glaucoma therapy. Am J Ophthalmol. 2006;142(2):223–226. |
 © 2018 The Author(s). This work is published and licensed by Dove Medical Press Limited. The
full terms of this license are available at https://www.dovepress.com/terms
and incorporate the Creative Commons Attribution
- Non Commercial (unported, 3.0) License.
By accessing the work you hereby accept the Terms. Non-commercial uses of the work are permitted
without any further permission from Dove Medical Press Limited, provided the work is properly
attributed. For permission for commercial use of this work, please see paragraphs 4.2 and 5 of our Terms.
© 2018 The Author(s). This work is published and licensed by Dove Medical Press Limited. The
full terms of this license are available at https://www.dovepress.com/terms
and incorporate the Creative Commons Attribution
- Non Commercial (unported, 3.0) License.
By accessing the work you hereby accept the Terms. Non-commercial uses of the work are permitted
without any further permission from Dove Medical Press Limited, provided the work is properly
attributed. For permission for commercial use of this work, please see paragraphs 4.2 and 5 of our Terms.