Back to Journals » Pharmacogenomics and Personalized Medicine » Volume 12
Identification of Candidate Genes and Therapeutic Agents for Light Chain Amyloidosis Based on Bioinformatics Approach
Received 24 August 2019
Accepted for publication 3 December 2019
Published 3 January 2020 Volume 2019:12 Pages 387—396
DOI https://doi.org/10.2147/PGPM.S228574
Checked for plagiarism Yes
Review by Single anonymous peer review
Peer reviewer comments 2
Editor who approved publication: Dr Martin H Bluth
Wenxiang Bai,1,2,* Honghua Wang,1,* Hua Bai1,3
1Comprehensive Cancer Center, Xiangshui People’s Hospital, Xiangshui 224600, People’s Republic of China; 2Department of Respiratory Medicine, Xiangshui People’s Hospital, Xiangshui, 224600, People’s Republic of China; 3Department of Hematology, The Affiliated Drum Tower Hospital of Nanjing University Medical School, Nanjing 210008, People’s Republic of China
*These authors contributed equally to this work
Correspondence: Hua Bai
Comprehensive Cancer Center, Xiangshui People’s Hospital, Xiangshui 224600, People’s Republic of China
Email [email protected]
Objective: Systemic amyloid light chain (AL) amyloidosis is a rare plasma cell disease. However, the regulatory mechanisms of AL amyloidosis have not been thoroughly uncovered, identification of candidate genes and therapeutic agents for this disease is crucial to provide novel insights into exploring the regulatory mechanisms underlying AL amyloidosis.
Methods: The gene expression profile of GSE73040, including 9 specimens from AL amyloidosis patients and 5 specimens from normal control, was downloaded from GEO datasets. Differentially expressed genes (DEGs) were sorted with regard to AL amyloidosis versus normal control group using Limma package. The gene enrichment analyses including GO and KEGG pathway were performed using DAVID website subsequently. Furthermore, the protein–protein interaction (PPI) network for DEGs was constructed by Cytoscape software and STRING database. DEGs were mapped to the connectivity map datasets to identify potential molecular agents of AL amyloidosis.
Results: A total of 1464 DEGs (727 up-regulated, 737 down-regulated) were identified in AL amyloidosis samples versus control samples, these dysregulated genes were associated with the dysfunction of ribosome biogenesis and immune response. PPI network and module analysis uncovered that several crucial genes were defined as candidate genes, including ITGAM, ITGB2, ITGAX, IMP3 and FBL. More importantly, we identified the small molecular agents (AT-9283, Ritonavir and PKC beta-inhibitor) as the potential drugs for AL amyloidosis.
Conclusion: Using bioinformatics approach, we have identified candidate genes and pathways in AL amyloidosis, which can extend our understanding of the cause and molecular mechanisms, and these crucial genes and pathways could act as biomarkers and therapeutic targets for AL amyloidosis.
Keywords: light chain amyloidosis, bioinformatics approach, differentially expressed genes, candidate genes, therapeutic agent
Introduction
Amyloid light chain (AL) amyloidosis is a life-threatening protein deposition disease and the most common type of systemic amyloidosis.1 Pathologically, AL amyloidosis is characterized by the accumulation of monoclonal light chain in multiple organs as amyloid fibrils, predominantly in the kidney, liver, peripheral nerves and heart.2 Clinically, it has an insidious onset and is difficult to recognize at an earlier stage. Once the symptoms become evident, visceral damage is usually irreversible, eventually leading to severe organ damage and shortens survival.3 So early diagnosis and targeted therapy of this cancer are essential for AL amyloidosis patients and to get a better prognosis. As for the early diagnosis of AL amyloidosis, amyloid deposition is the most widely used biomarker, but it is required invasive organ biopsy for HE staining, Congo red staining, and electron microscopy.4 Moreover, the molecular mechanism of AL amyloidosis occurrence and progression remains unclear. Therefore, it will be worthwhile to uncover the AL amyloidosis etiology for the purpose of identifying new molecular biomarkers and discovering potential molecular agents.
The gene expression array platform for the analysis of differentially expressed genes (DEGs) is particularly valuable as a molecular technique with significant clinical applications: from molecular diagnosis to classification of cancer typing, from risk stratification to prognosis evaluation, from the discovery of potential molecular agents discovery to the predication of treatment response.5,6 With the wide application of gene chips technique, gene expression profiling studies on myeloma and AL amyloidosis have been performed in the last several years using microarray technology, and most of the microarray data have been deposited in public datasets. Re-analyzing these public data can provide valuable clues for new studies. Many comparative analyses of the DEGs have been carried out on cancers in recent years.7–9 However, none of the aforementioned studies has been completely investigated in AL amyloidosis.
In this work, we have downloaded the original data (GSE73040) from NCBI Gene Expression Omnibus (http://www.ncbi.nlm.nih.gov/geo/) and reanalyzed them using bioinformatics approaches, which employ powerful statistical methods,10 including identification of DEGs in AL amyloidosis, gene ontology and pathway enrichment analysis with DAVID (https://david.ncifcrf.gov/), integration of DEGs PPI network (http://string-db.org), and discovery of small molecules with cMAP (https://portals. broadinstitute.org/cmap). Subsequently, we provided the novel insight of AL amyloidosis progression at the molecular level, and also identified the candidate genes for diagnosis, prognosis, and therapeutic targets.
Methods
Affymetrix Microarray Data
The microarray data of GSE73040 were downloaded from GEO datasets. GSE73040, which was based on Agilent GPL6244 platform, was submitted by Paiva et al11 GSE73040 dataset contained 14 samples, including 5 Control samples and 9 amyloidosis samples.
Data Preprocessing and DEGs Screening
The robust multi-array average (RMA) algorithm in affy package was applied to preprocess the raw expression data in the R package.12,13 Then, the limma package in R software was used to identify DEGs between AL amyloidosis and control samples,14 with the statistical significance of p < 0.05 and the fold change >2.
Gene Ontology and Pathway Enrichment Analysis of DEGs
To investigate the functional pathways of AL amyloidosis, Database for Annotation, Visualization and Integrated Discovery (DAVID) was applied to perform the GO analysis and Kyoto Encyclopedia of Genes and Genomes (KEGG) pathways enrichment analysis of DEGs.15 p < 0.05 was chosen as the cut-off value for enriched functional pathways.
Integration of PPI Network and Module Analysis
Firstly, Search Tool for the Retrieval of Interacting Genes (STRING) analysis was performed to investigate DEGs-encoded proteins and PPI.16 The combined score of >0.4 was considered as the threshold for significant protein pairs. Then, cytoscape was utilized for visualization and calculate the capabilities of the PPI network under default parameters.17 Thirdly, the Network Analyzer plug-in was utilized to calculate the degree score of hub genes. To investigate more specific regulatory relationship of proteins, we performed the module analysis of the PPI network by using the MCODE with default setting.18
Identification of Small Molecular Agents
The Connectivity Map (cMap) database provides a systematic method for discovering connections between small molecular agents and diseases.19 The query signature in the CMAP dataset is a list of up-regulated and down-regulated genes, then, the DEGs in the PPI network were mapped onto the cMap database. The |connectivity score| > 0.8 was used as the cut-off value to identify candidate small molecular agents. So the identified agents would be forcefully correlated with the query signature, indicating their potential action with AL amyloidosis.
qRT-PCR
Total RNA was extracted from plasma cells with TRIzol reagent (Life Technologies, USA). For mRNA detection, each RNA sample was revere-transcribed into cDNA using the reverse transcription kit (Takara, Japan). qRT-PCR was performed to detect the levels of mRNA using the comparative Ct method. GAPDH was chosen as the internal control for mRNA.
Statistical Analysis
The expression differences between two groups were analyzed by unpaired t-test. Data were presented as mean ± SE. The data were analyzed by SPSS 22.0 software, and visualized by GraphPad Prism 6.0. Moreover, a p-Value < 0.05 was considered to be statistically significant.
Results
DEGs Between the AL Amyloidosis and Control Groups
In total, 1464 genes were identified to be differentially expressed genes, including 727 up-regulated genes and 737 down-regulated genes in AL amyloidosis. As shown in the heatmap (Figure 1), DEGs were divided into 2 clusters according to the clustering analysis result. Meanwhile, normal and AL amyloidosis specimens were also classified into 2 different groups.
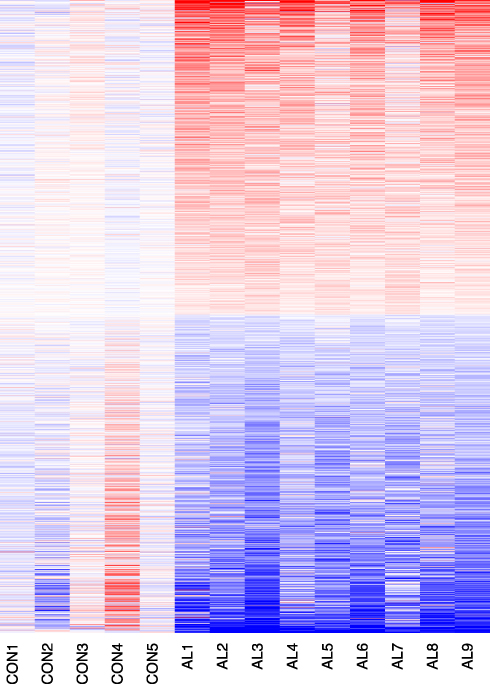 |
Figure 1 Heatmap and clustering analysis of DEGs. Red: high expression level; Blue: low expression level. |
Gene Enrichment and Pathways Analysis of DEGs
To explore the specific function pattern of DEGs, functional enrichment analysis was performed by DAVID. GO analysis revealed that up-regulated DEGs were mainly significantly enriched in biological processes, including rRNA processing, mitochondrial translational elongation and termination; the down-regulated DEGs were mainly enriched in biological processes, including immune response, regulation of immune response and leukocyte migration. For molecular function, the up-regulated DEGs were enriched in poly (A) RNA binding, structural constituent of ribosome and unfolded protein binding; the down-regulated DEGs were enriched in RAGE receptor binding, protein binding and receptor activity. Additionally, GO cell component analysis showed that the DEGs were significantly enriched in the nucleolus, mitochondrion, plasma membrane and extracellular region (Table 1).
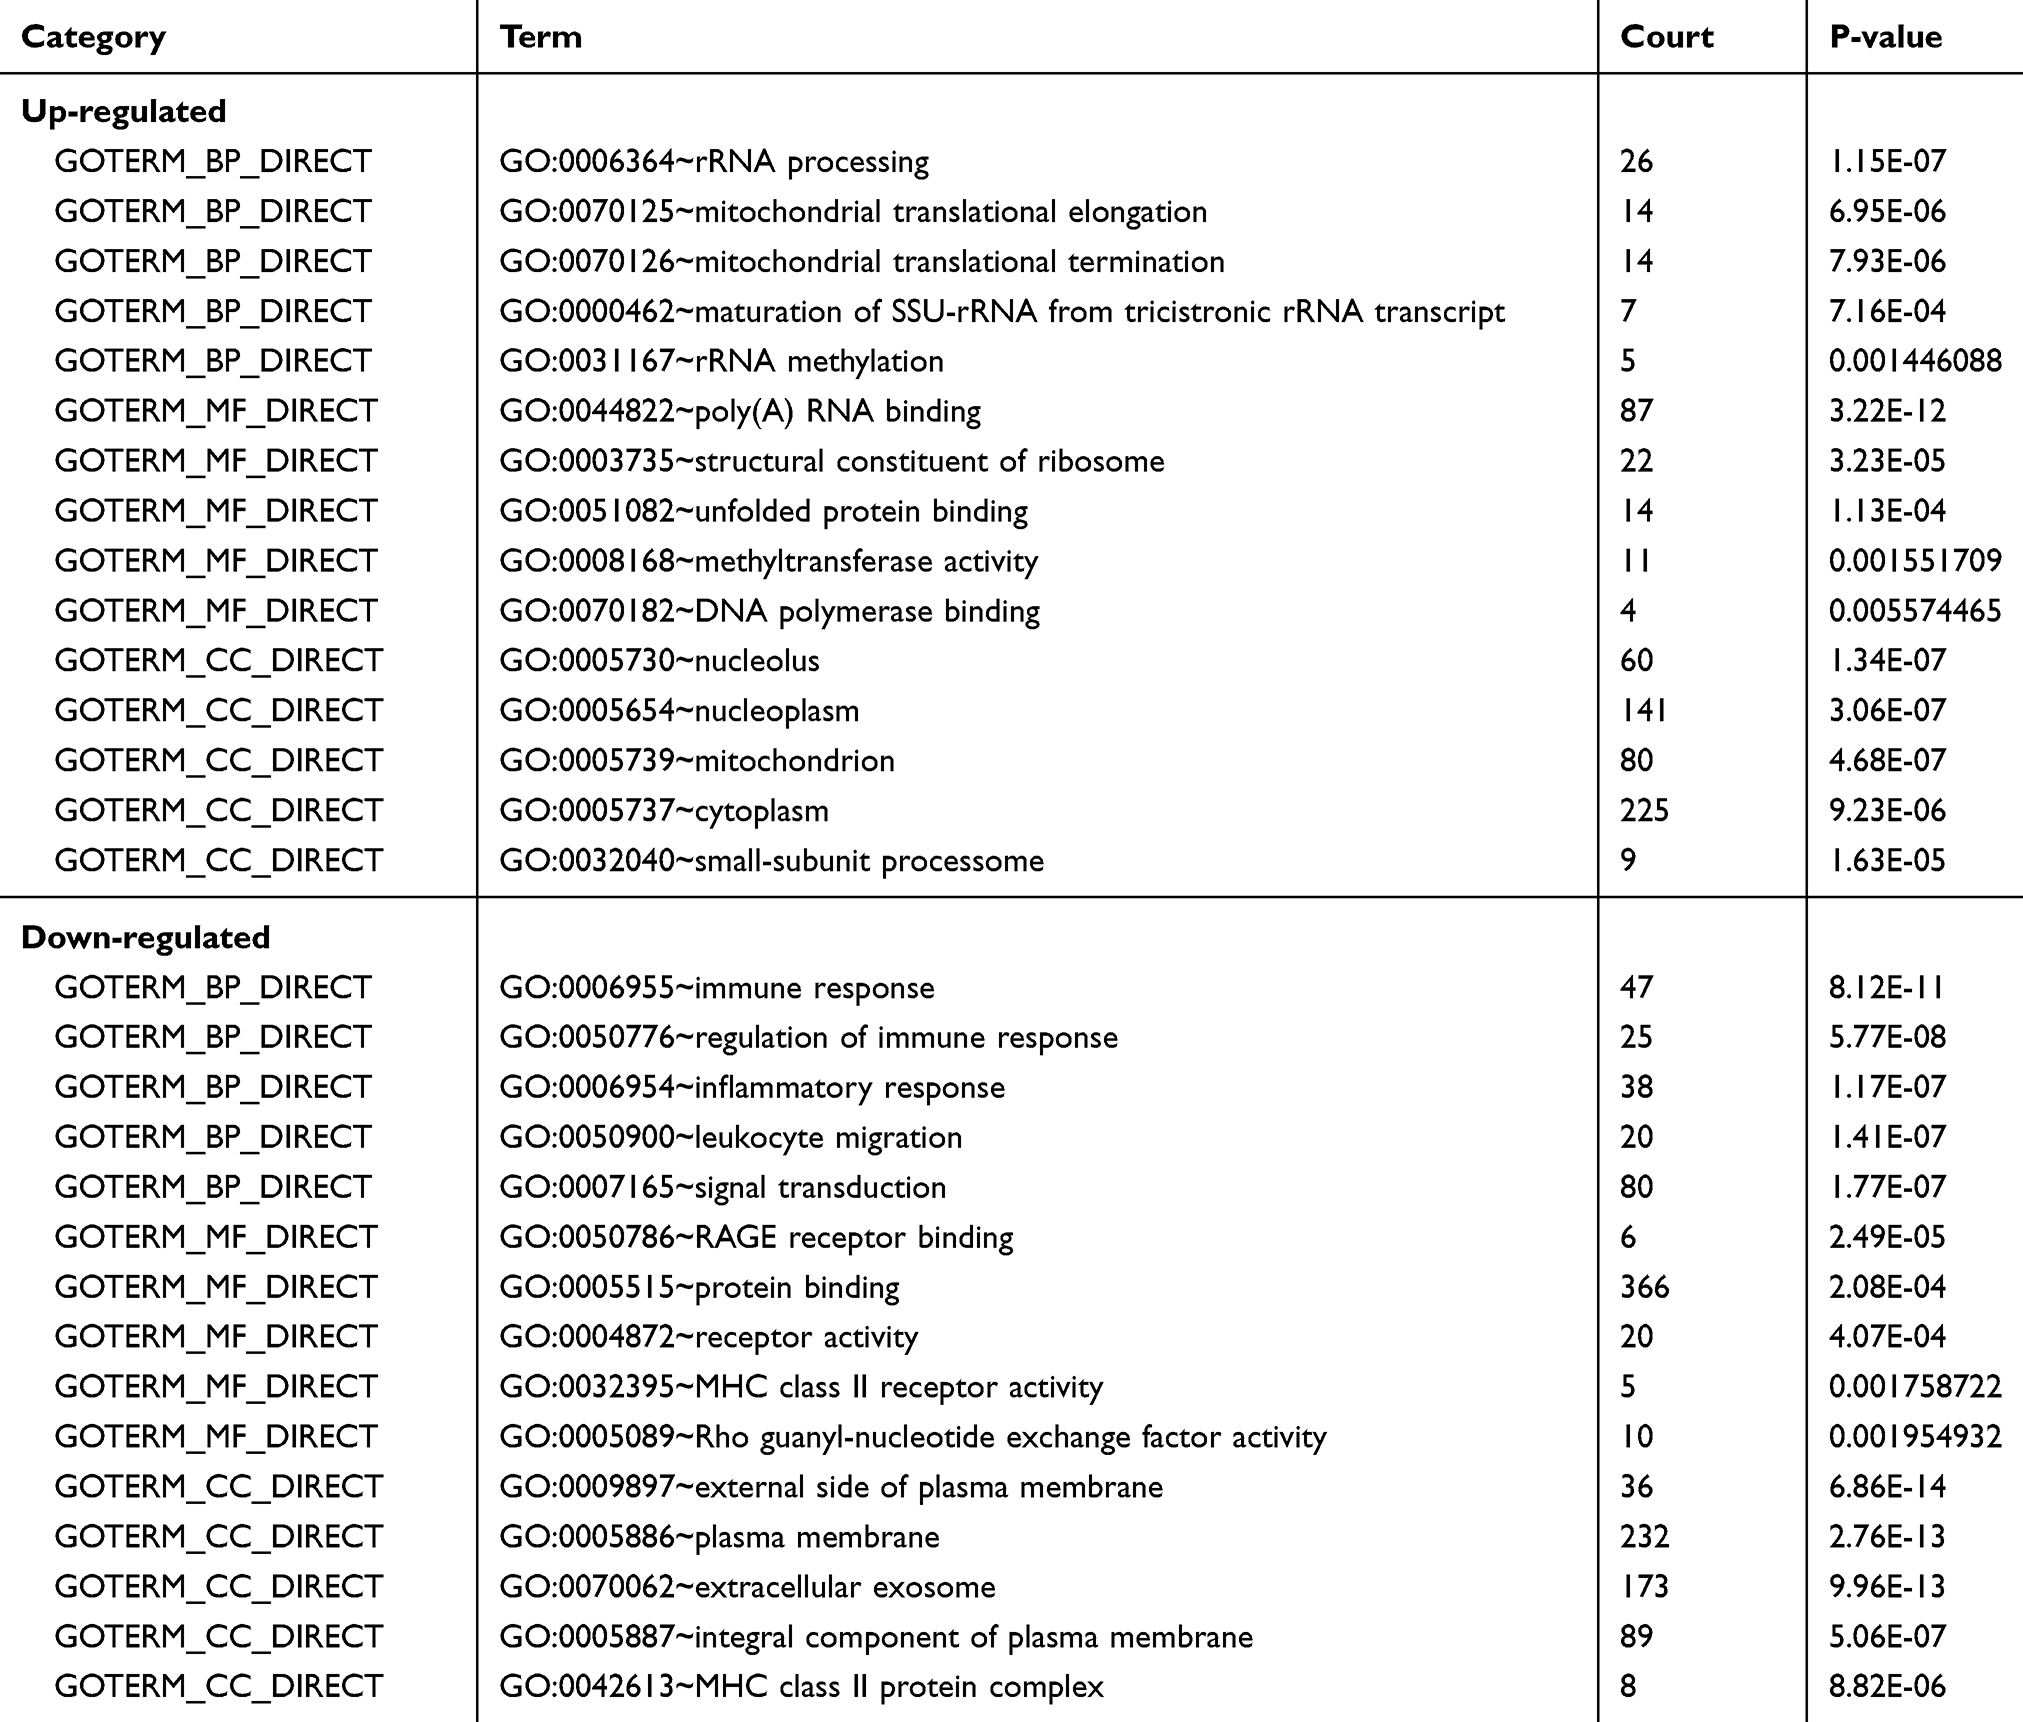 |
Table 1 Top Five Enriched GO of Downregulated DEGs and Upregulated DEGs |
Moreover, the KEGG pathway enrichment analysis by up-regulated DEGs and down-regulated DEGs was listed in Table 2. Among them, the top three up-regulated DEGs were enriched in ribosome biogenesis in eukaryotes, metabolic pathways and ribosome, while the down-regulated DEGs were enriched in hematopoietic cell lineage, tuberculosis, staphylococcus aureus infection and cell adhesion molecules (CAMs).
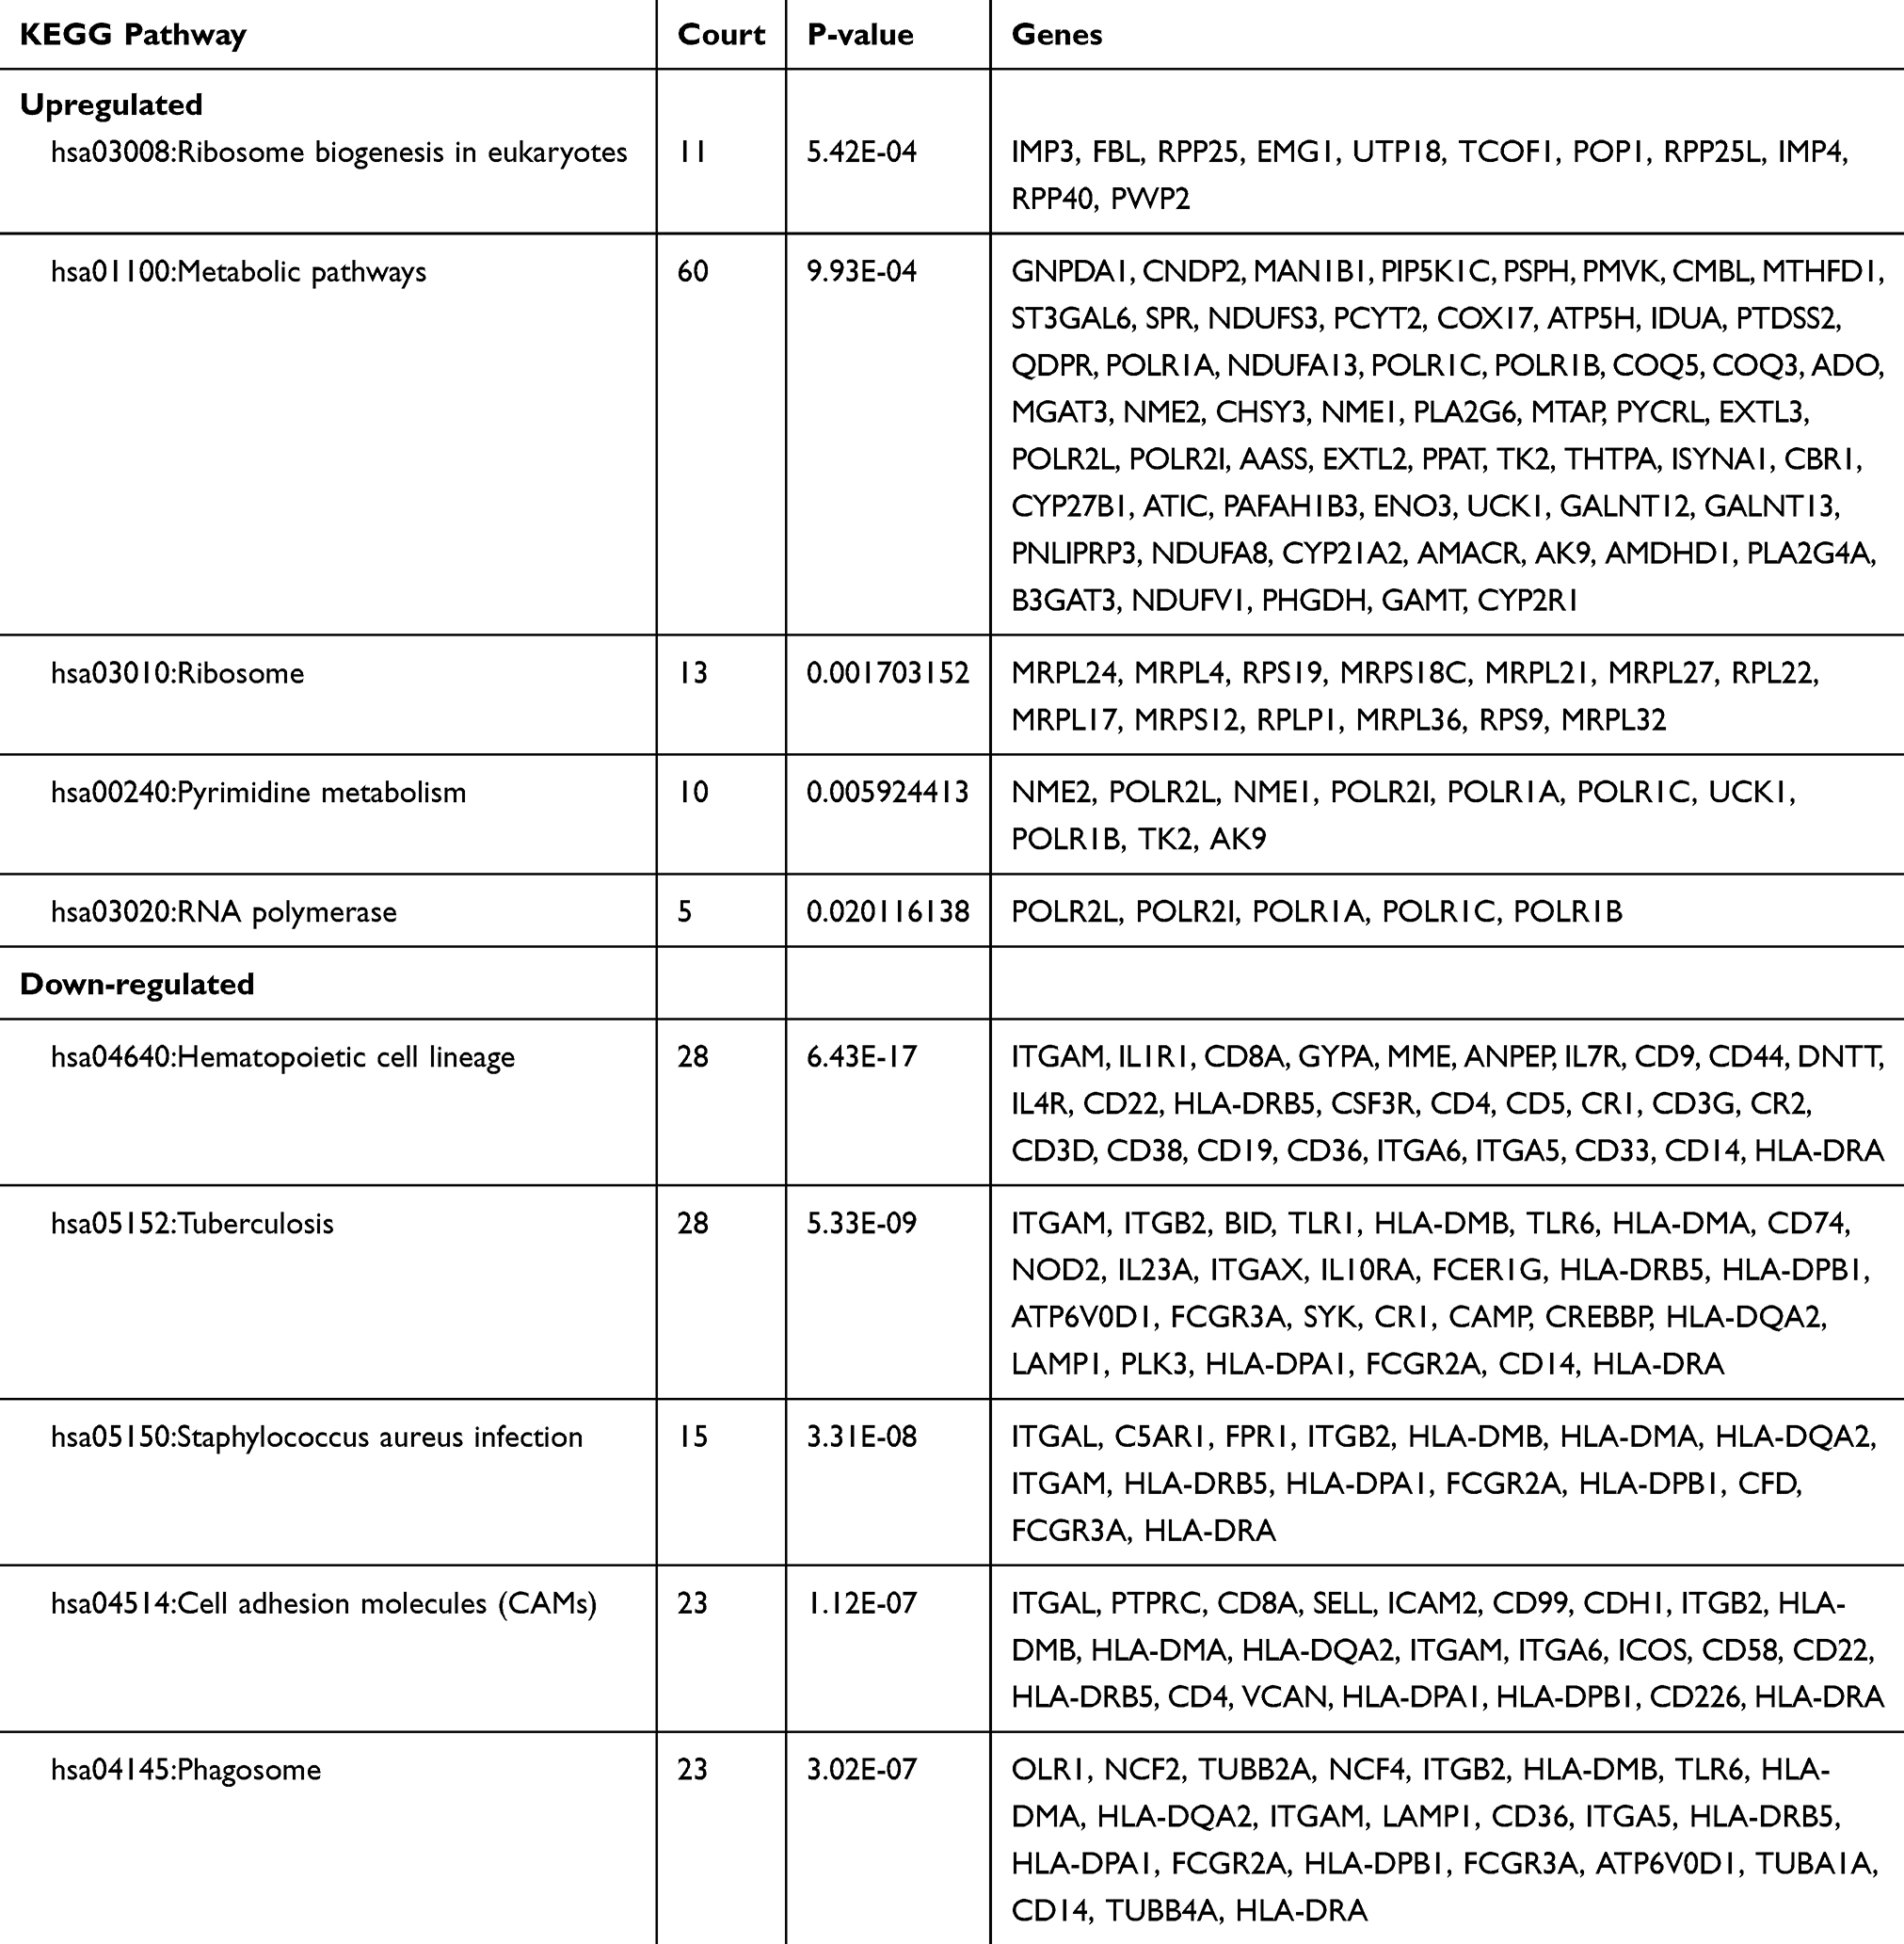 |
Table 2 The Top Five Enriched KEGG Pathways of DEGs |
Construction of PPI Network and Sub-Network
By integrating DEG pairs with combined score >0.4, PPI network was constructed according to the STRING and visualized in Cytoscape, involving 1270 nodes (DEGs) and 7818 edges (Figure 2), accounting for 86.74% of all DEGs. As is shown in Figure 3, the topology property of the PPI network indicates that the node degree distribution of the PPI network was in power-law distribution (Figure 3). Based on the connectivity degree in the giant network, the numbers of PPI pairs that the gene/protein possessed were screened. In our study, we identified 5 critical nodal genes, such as ITGAM (degree, 129), ITGB2 (degree, 103), ITGAX (degree, 94), IMP3 (degree, 62) and FBL (degree, 62), which might participate in AL amyloidosis progression.
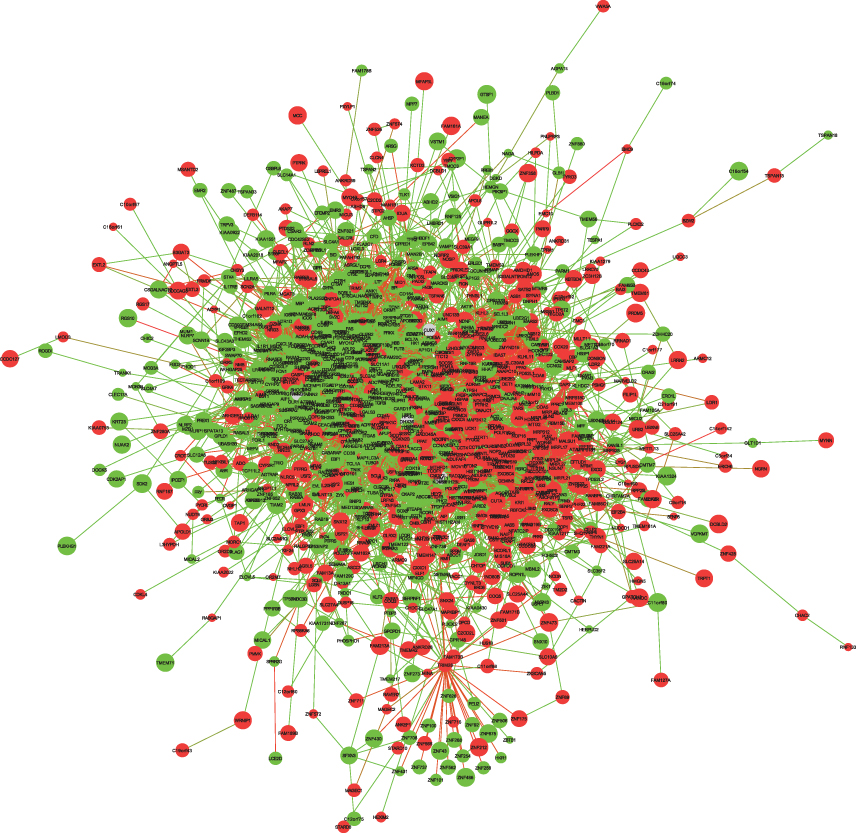 |
Figure 2 The giant network consisting of 1270 nodes and 7818 edges was extracted from the whole PPI network. Key nodes in the giant network are highlighted in different colors: red corresponds to the up-regulated gene and green corresponds to the down-regulated gene in AL amyloidosis. |
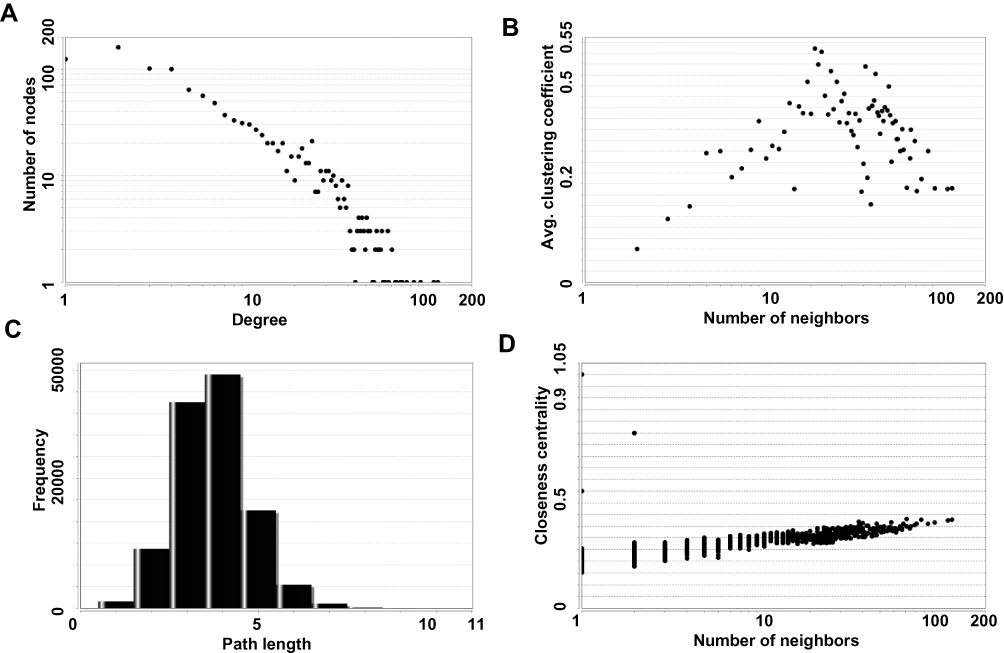 |
Figure 3 The topology parameters were analyzed according to the giant networks. (A) Degree distribution; (B) average clustering coefficient; (C) shortest path distribution; (D) closeness centrality. |
Moreover, biological network consists of several functional modules in which these components of the complex and interactions generally lead to the same biological process. We extracted several modules from the PPI network using MCODE analysis. The most highly connected sub-network (cluster rank 1; Score 26.741) was obtained from PPI network complex (Figure 4A), consisting of 28 nodes and 361 interactions (in which IMP3 and FBL were involved). Another sub-network (cluster rank 3; Score 17.537) was obtained from PPI network complex (Figure 4B), consisting of 96 nodes and 833 interactions (in which ITGAM, PTPRC, ITGB2 and ITGAX were enriched). Accordingly, for the genes identified in this PPI sub-network, a total of 20 KEGG pathways were enriched (Table 3). The top two pathways were Hematopoietic cell lineage and Primary immunodeficiency.
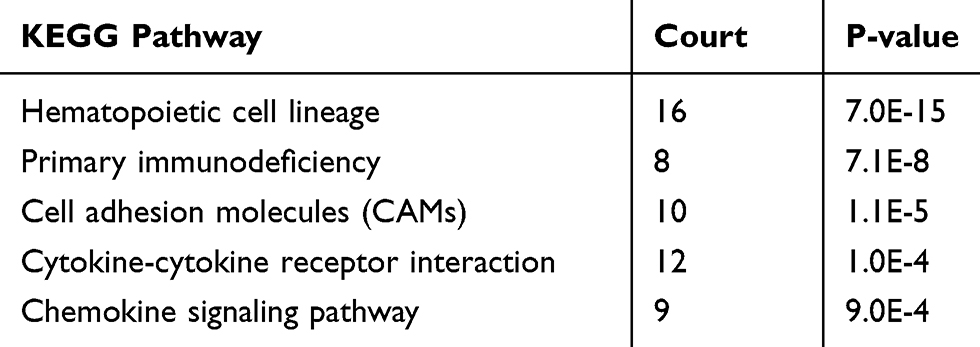 |
Table 3 The Statistically Significant Sub-Pathways Identified by DEGs (Top 5) |
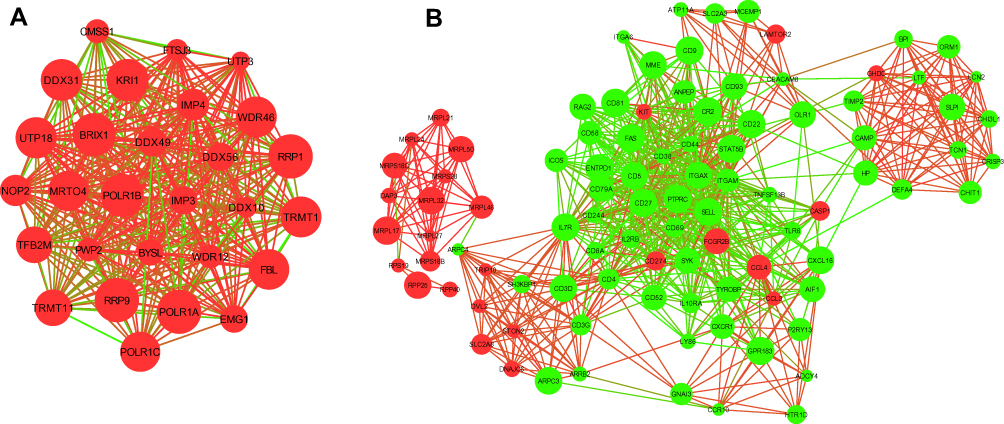 |
Figure 4 The significant module was extracted from the giant network: (A) red corresponds to the up-regulated gene; (B) green corresponds to the down-regulated gene in NEC. |
We utilized the qRT-PCR to detect the expression of key genes in AL amyloidosis patients. As shown in Figure 5A and B, the expression of FBL and IMP3 were up-regulated in AL amyloidosis patients compared with healthy control, while the expression of ITGAM, ITGB2 and ITGAX in AL amyloidosis were all lower than healthy controls. These results will support FBL and IMP3 as the biomarker of AL amyloidosis.
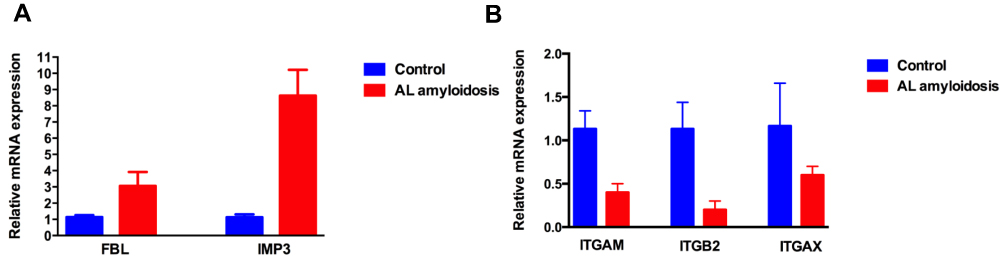 |
Figure 5 The expression of key genes in AL amyloidosis patients’ clonal plasma cells. (A) FBL and IMP3 were up-regulated in AL amyloidosis patients compared with healthy control; (B) ITGAM, ITGB2 and ITGAX were down-regulated in AL amyloidosis patients compared with healthy control. |
Identification of Small Molecular Agents
Based on the results of cMap database mapping, we found several small molecular agents from the cMap database that were potentially correlated to AL amyloidosis. As showed in Table 4, the top 5 small molecular agent were selected according to rank and score, indicating their relatively significant correlation with AL amyloidosis, such as AT-9283, Ritonavir, Indirubin, PKC beta-inhibitor and Cholic-acid.
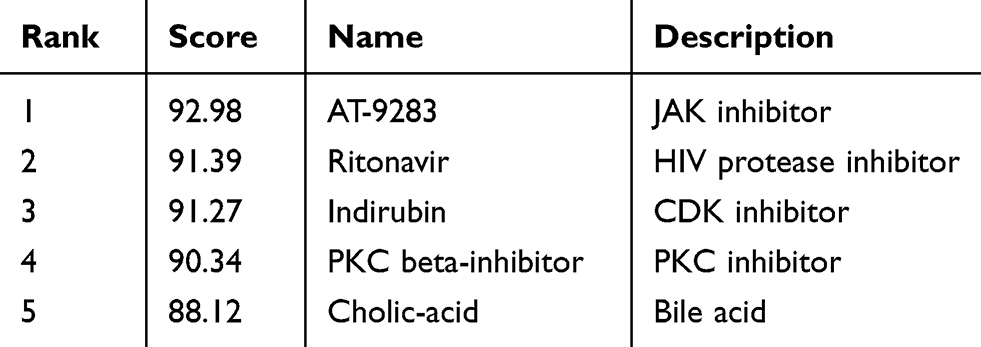 |
Table 4 The Small Molecular Agents Identified of DEGs (Top 5) |
Discussion
In our study, a total of 1464 DEGs, including 727 up-regulated genes and 737 down-regulated genes were identified between the AL amyloidosis and control groups. These up-regulated genes were mainly enriched in several functional terms such as positive regulation of mitochondrion, ribosome and unfolded protein binding. As we all know, ribosome and mitochondrion play a vital role in protein synthesis by protein translation and are also essential for cell growth, proliferation, and development.20,21 Down-regulated genes were mainly enriched in several functional terms such as hematopoietic cell lineage, RAGE receptor binding and immune response. RAGE receptor has been shown to contribute to several chronic diseases such as diabetes, amyloidosis, inflammatory conditions.22 Then, PPI network was constructed and several hub genes were identified. According to the analysis of the PPI network, the highly connected module was identified and five hub genes were selected as candidate genes, including IMP3, FBL, ITGAM, ITGB2 and ITGAX. Among the five genes, IMP3 and FBL were enriched in ribosome biogenesis, while ITGAM, ITGB2 and ITGAX might be involved in hematopoietic cell lineage and immune response.
Ribosome biogenesis is a multistage process that involves transcriptional and posttranscriptional regulation, and it is over activated in cancer cells.23,24 In our study, overexpression IMP3 and FBL gene was accordant with GO/KEGG pathway analysis (hsa03008: Ribosome biogenesis in eukaryotes). IMP3 and FBL gene expression are higher in AL amyloidosis than normal samples, which may suggest that overexpression IMP3 and FBL play effect in cancer ribosomes development. In addition, previous study reported that IMP3 was an RNA-binding protein required for ribosomal RNA processing, which was chosen as a prognostic marker in a number of human types of cancer.25,26 The overexpression of FBL contributes to tumorigenesis and is related to poor survival in patients with cancer.27 High expression of FBL was accompanied by modifications of the rRNA methylation pattern, impairment of translational fidelity, and an increase of internal ribosome entry site-dependent translation initiation of key cancer genes.28 Additionally, P53 is involved in FBL regulation and suppresses the expression of the rRNA methyl-transferase fibrillarin by binding directly to FBL.28,29 In summary, molecular signature of AL amyloidosis consists of 23 genes representing mainly ribosomal proteins, and these signatures appear pathogenetically supported the effect of ribosome dysfunction in AL amyloidosis.
Hematopoietic cell lineage is the progress of hematopoietic stem cell undergo either self-renewal or differentiation into a multilineage committed progenitor cells. In our study, the down-regulated DEGs were significantly enriched in hematopoietic cell lineage and immune response, which weakened these pathways about hematopoietic and immunologic function, were conducive to tumor progression. The top four down-regulated genes with the highest degrees in the PPI network were ITGAM (CD11b), PTPRC (CD45), ITGB2 (CD18) and ITGAX (CD11c). Theses aberrant expression of antigens may play a vital role in regulating immune responses in AL amyloidosis patients. Zhu et al have successfully detected the CD45 deficiency drives Amyloid-β Peptide Oligomers and accelerates cerebral amyloidosis.30 However, no studies focus on CD11b, CD18 and CD11c in AL amyloidosis. Compose complement receptor type 3 (CR3, comprising CD11b/CD18) and type 4 (CR4, comprising CD11c/CD18) belong to the family of β2 integrins, and act as control points in immunity and cancer.31 For instance, by interaction with iC3b, CR3 and CR4 mediate the uptake of opsonized cells and particles by macrophages, neutrophils, monocytes and dendritic cells;32 by interaction with ICAM1, ICAM4 and LFA1, CR3 and CR4 serve the important task of the formation of the immunological synapse, crucial the contact between antigen presenting cells and T lymphocytes.33–35 Furthermore, a former study showed that pharmacological activation of CD11b/CD18 could promote pro-inflammatory macrophage polarization and suppress tumor growth in animal models of murine and human cancer.36 CR3 and CR4 were proved to enable complement-dependent cell cytotoxicity toward antibody-coated tumor cells as part of biological therapy.37 As revealed in our sub-network, KEGG pathways were also predicted correlations with the hematopoietic cell lineage and immunodeficiency, providing a clue that ITGAM, ITGB2 and ITGAX might also be involved in AL amyloidosis progression via regulating immune response.
Furthermore, the study found candidate small molecules that may be involved in promoting or suppressing the development of AL amyloidosis. AT-9283 was identified to be small molecular agents with the highest score, which has been reported that AT-9283 significantly inhibits myeloma cell growth and promotes apoptosis in vivo and vitro.38 Another molecule, Enzastaurin (PKC beta-inhibitor) is an oral serine/threonine kinase inhibitor of the protein kinase C and phosphatidylinositol 3 kinase/Akt pathways that promote apoptosis of myeloma cells in a caspase-independent manner.39 Two Phase II trials were designed to explore the efficacy of AT-9283 (NCT01145989) and Enzastaurin (NCT00718419) in patients with multiple myeloma.40,41 Additionally, ritonavir could increase the level of endoplasmic reticulum stress in myeloma cells, which sensitizes bortezomib-resistant cells to bortezomib-induced apoptosis.42 Importantly, MM have previously been administered these small molecular agents, strongly supporting the investigation of repurposing AT-9283, Enzastaurin and ritonavir for AL amyloidosis therapy.
Conclusion
Taken together, our study has identified several candidate genes (ITGAM, ITGB2, ITGAX, IMP3 and FBL) that were involved in the mechanism of AL amyloidosis, and IMP3 and FBL play essential roles in dysfunction of Ribosome biogenesis. Besides, ITGAM, ITGB2 and ITGAX are crucial for hematopoietic cell lineage and immune response to AL amyloidosis occurrence and progression. Furthermore, AT-9283, Enzastaurin and ritonavir may act as potential molecular drugs for AL amyloidosis treatment. Our results provide better understanding of AL amyloidosis pathogenesis. Further research of these candidate genes and therapeutic agents are urgently needed to determine their effects in AL amyloidosis.
Disclosure
The authors report no conflicts of interest in this work.
References
1. Wechalekar AD, Gillmore JD, Hawkins PN. Systemic amyloidosis. Lancet. 2016;387(10038):2641–2654. doi:10.1016/S0140-6736(15)01274-X
2. Merlini G, Seldin DC, Gertz MA. Amyloidosis: pathogenesis and new therapeutic options. J Clin Oncol. 2011;29(14):1924–1933. doi:10.1200/JCO.2010.32.2271
3. Rosenzweig M, Landau H. Light chain (AL) amyloidosis: update on diagnosis and management. J Hematol Oncol. 2011;4:47. doi:10.1186/1756-8722-4-47
4. Cohen AD, Comenzo RL. Systemic light-chain amyloidosis: advances in diagnosis, prognosis, and therapy. Hematol Am Soc Hemat Educ Program. 2010;2010:287–294. doi:10.1182/asheducation-2010.1.287
5. Vogelstein B, Papadopoulos N, Velculescu VE, Zhou S, Diaz LA
6. Nannini M, Pantaleo MA, Maleddu A, Astolfi A, Formica S, Biasco G. Gene expression profiling in colorectal cancer using microarray technologies: results and perspectives. Cancer Treat Rev. 2009;35(3):201–209. doi:10.1016/j.ctrv.2008.10.006
7. Guo Y, Bao Y, Ma M, Yang W. Identification of key candidate genes and pathways in colorectal cancer by integrated bioinformatical analysis. Int J Mol Sci. 2017;18(4). doi:10.3390/ijms18040722
8. Fang E, Zhang X, Wang Q, Wang D. Identification of prostate cancer hub genes and therapeutic agents using bioinformatics approach. Cancer Biomarkers. 2017;20(4):553–561. doi:10.3233/CBM-170362
9. Zhang K, Xu Z, Sun Z. Identification of the key genes connected with plasma cells of multiple myeloma using expression profiles. Onco Targets Ther. 2015;8:1795–1803. doi:10.2147/OTT
10. Horimoto K, Toh H. Statistical estimation of cluster boundaries in gene expression profile data. Bioinformatics. 2001;17(12):1143–1151. doi:10.1093/bioinformatics/17.12.1143
11. Paiva B, Martinez-Lopez J, Corchete LA, et al. Phenotypic, transcriptomic, and genomic features of clonal plasma cells in light-chain amyloidosis. Blood. 2016;127(24):3035–3039. doi:10.1182/blood-2015-10-673095
12. Irizarry RA, Hobbs B, Collin F, et al. Exploration, normalization, and summaries of high density oligonucleotide array probe level data. Biostatistics. 2003;4(2):249–264. doi:10.1093/biostatistics/4.2.249
13. Gautier L, Cope L, Bolstad BM, Irizarry RA. affy–analysis of Affymetrix GeneChip data at the probe level. Bioinformatics. 2004;20(3):307–315. doi:10.1093/bioinformatics/btg405
14. Ritchie ME, Phipson B, Wu D, et al. limma powers differential expression analyses for RNA-sequencing and microarray studies. Nucleic Acids Res. 2015;43(7):e47. doi:10.1093/nar/gkv007
15. Dennis G
16. Szklarczyk D, Franceschini A, Wyder S, et al. STRING v10: protein-protein interaction networks, integrated over the tree of life. Nucleic Acids Res. 2015;43(Database issue):D447–452. doi:10.1093/nar/gku1003
17. Shannon P, Markiel A, Ozier O, et al. Cytoscape: a software environment for integrated models of biomolecular interaction networks. Genome Res. 2003;13(11):2498–2504. doi:10.1101/gr.1239303
18. Bandettini WP, Kellman P, Mancini C, et al. MultiContrast Delayed Enhancement (MCODE) improves detection of subendocardial myocardial infarction by late gadolinium enhancement cardiovascular magnetic resonance: a clinical validation study. J Cardiovasc Magn Reson. 2012;14:83. doi:10.1186/1532-429X-14-83
19. Lamb J, Crawford ED, Peck D, et al. The connectivity map: using gene-expression signatures to connect small molecules, genes, and disease. Science. 2006;313(5795):1929–1935. doi:10.1126/science.1132939
20. van der Bliek AM, Sedensky MM, Morgan PG. Cell biology of the mitochondrion. Genetics. 2017;207(3):843–871. doi:10.1534/genetics.117.300262
21. Pelletier J, Thomas G, Volarevic S. Ribosome biogenesis in cancer: new players and therapeutic avenues. Nat Rev Cancer. 2018;18(1):51–63. doi:10.1038/nrc.2017.104
22. Bierhaus A, Humpert PM, Morcos M, et al. Understanding RAGE, the receptor for advanced glycation end products. J Mol Med. 2005;83(11):876–886. doi:10.1007/s00109-005-0688-7
23. Bywater MJ, Poortinga G, Sanij E, et al. Inhibition of RNA polymerase I as a therapeutic strategy to promote cancer-specific activation of p53. Cancer Cell. 2012;22(1):51–65. doi:10.1016/j.ccr.2012.05.019
24. Bashan A, Yonath A. Correlating ribosome function with high-resolution structures. Trends Microbiol. 2008;16(7):326–335. doi:10.1016/j.tim.2008.05.001
25. Burdelski C, Jakani-Karimi N, Jacobsen F, et al. IMP3 overexpression occurs in various important cancer types and is linked to aggressive tumor features: a tissue microarray study on 8877 human cancers and normal tissues. Oncol Rep. 2018;39(1):3–12. doi:10.3892/or.2017.6072
26. Jeng YM, Chang CC, Hu FC, et al. RNA-binding protein insulin-like growth factor II mRNA-binding protein 3 expression promotes tumor invasion and predicts early recurrence and poor prognosis in hepatocellular carcinoma. Hepatology. 2008;48(4):1118–1127. doi:10.1002/hep.22459
27. Shubina MY, Musinova YR, Sheval EV. Proliferation, cancer, and aging-novel functions of the nucleolar methyltransferase fibrillarin? Cell Biol Int. 2018;42(11):1463–1466. doi:10.1002/cbin.v42.11
28. Marcel V, Ghayad SE, Belin S, et al. p53 acts as a safeguard of translational control by regulating fibrillarin and rRNA methylation in cancer. Cancer Cell. 2013;24(3):318–330. doi:10.1016/j.ccr.2013.08.013
29. El Hassouni B, Sarkisjan D, Vos JC, Giovannetti E, Peters GJ. Targeting the ribosome biogenesis key molecule fibrillarin to avoid chemoresistance. Curr Med Chem. 2018.
30. Zhu Y, Hou H, Rezai-Zadeh K, et al. CD45 deficiency drives amyloid-beta peptide oligomers and neuronal loss in Alzheimer’s disease mice. J Neurosci. 2011;31(4):1355–1365. doi:10.1523/JNEUROSCI.3268-10.2011
31. Ley K, Laudanna C, Cybulsky MI, Nourshargh S. Getting to the site of inflammation: the leukocyte adhesion cascade updated. Nat Rev Immunol. 2007;7(9):678–689. doi:10.1038/nri2156
32. Sandor N, Lukacsi S, Ungai-SAL Amyloidosisnki R, et al. CD11c/CD18 dominates adhesion of human monocytes, macrophages and dendritic cells over CD11b/CD18. PLoS ONE. 2016;11(9):e0163120. doi:10.1371/journal.pone.0163120
33. Diamond MS, Staunton DE, de Fougerolles AR, et al. ICAM-1 (CD54): a counter-receptor for Mac-1 (CD11b/CD18). J Cell Biol. 1990;111(6 Pt 2):3129–3139. doi:10.1083/jcb.111.6.3129
34. Ihanus E, Uotila L, Toivanen A, et al. Characterization of ICAM-4 binding to the I domains of the CD11a/CD18 and CD11b/CD18 leukocyte integrins. Eur J Biochem. 2003;270(8):1710–1723. doi:10.1046/j.1432-1033.2003.03528.x
35. Springer TA, Dustin ML. Integrin inside-out signaling and the immunological synapse. Curr Opin Cell Biol. 2012;24(1):107–115. doi:10.1016/j.ceb.2011.10.004
36. Schmid MC, Khan SQ, Kaneda MM, et al. Integrin CD11b activation drives anti-tumor innate immunity. Nat Commun. 2018;9(1):5379. doi:10.1038/s41467-018-07387-4
37. Vorup-Jensen T, Jensen RK. Structural immunology of complement receptors 3 and 4. Front Immunol. 2018;9:2716. doi:10.3389/fimmu.2018.02716
38. Santo L, Hideshima T, Cirstea D, et al. Antimyeloma activity of a multitargeted kinase inhibitor, AT9283, via potent Aurora kinase and STAT3 inhibition either alone or in combination with lenalidomide. Clin Cancer Res. 2011;17(10):3259–3271. doi:10.1158/1078-0432.CCR-10-3012
39. Podar K, Tai YT, Davies FE, et al. Vascular endothelial growth factor triggers signaling cascades mediating multiple myeloma cell growth and migration. Blood. 2001;98(2):428–435. doi:10.1182/blood.V98.2.428
40. Jourdan E, Leblond V, Maisonneuve H, et al. A multicenter phase II study of single-agent enzastaurin in previously treated multiple myeloma. Leuk Lymphoma. 2014;55(9):2013–2017. doi:10.3109/10428194.2013.861066
41. Hay AE, Murugesan A, DiPasquale AM, et al. A phase II study of AT9283, an aurora kinase inhibitor, in patients with relapsed or refractory multiple myeloma: NCIC clinical trials group IND.191. Leuk Lymphoma. 2016;57(6):1463–1466. doi:10.3109/10428194.2015.1091927
42. Kraus M, Malenke E, Gogel J, et al. Ritonavir induces endoplasmic reticulum stress and sensitizes sarcoma cells toward bortezomib-induced apoptosis. Mol Cancer Ther. 2008;7(7):1940–1948. doi:10.1158/1535-7163.MCT-07-2375
 © 2020 The Author(s). This work is published and licensed by Dove Medical Press Limited. The
full terms of this license are available at https://www.dovepress.com/terms
and incorporate the Creative Commons Attribution
- Non Commercial (unported, 3.0) License.
By accessing the work you hereby accept the Terms. Non-commercial uses of the work are permitted
without any further permission from Dove Medical Press Limited, provided the work is properly
attributed. For permission for commercial use of this work, please see paragraphs 4.2 and 5 of our Terms.
© 2020 The Author(s). This work is published and licensed by Dove Medical Press Limited. The
full terms of this license are available at https://www.dovepress.com/terms
and incorporate the Creative Commons Attribution
- Non Commercial (unported, 3.0) License.
By accessing the work you hereby accept the Terms. Non-commercial uses of the work are permitted
without any further permission from Dove Medical Press Limited, provided the work is properly
attributed. For permission for commercial use of this work, please see paragraphs 4.2 and 5 of our Terms.