Back to Journals » Patient Preference and Adherence » Volume 13
How psychological distance of a study sample in discrete choice experiments affects preference measurement: a colorectal cancer screening case study
Authors Veldwijk J ![]() , Groothuis-Oudshoorn CGM, Kihlbom U
, Groothuis-Oudshoorn CGM, Kihlbom U ![]() , Langenskiöld S, Dekker E, Kallenberg FGJ, de Wit GA, Lambooij MS
, Langenskiöld S, Dekker E, Kallenberg FGJ, de Wit GA, Lambooij MS
Received 21 July 2018
Accepted for publication 16 November 2018
Published 12 February 2019 Volume 2019:13 Pages 273—282
DOI https://doi.org/10.2147/PPA.S180994
Checked for plagiarism Yes
Review by Single anonymous peer review
Peer reviewer comments 2
Editor who approved publication: Dr Johnny Chen
Jorien Veldwijk,1–3 Catharina GM Groothuis-Oudshoorn,4 Ulrik Kihlbom,2,5,6 Sophie Langenskiöld,2,5,6 Evelien Dekker,7 Frank GJ Kallenberg,7 G Ardine de Wit,3,8 Mattijs S Lambooij3
1Erasmus School of Health Policy and Management, Erasmus University, Rotterdam, the Netherlands; 2Centre for Research Ethics & Bioethics, Uppsala University, Uppsala, Sweden; 3Centre for Nutrition, Prevention and Health Services, National Institute for Public Health and the Environment, Bilthoven, the Netherlands; 4Health Technology and Services Research, University of Twente, Enschede, the Netherlands; 5Department of Health Economics, Uppsala University, Uppsala, Sweden; 6Department of Learning, Informatics, Management and Ethics, Karolinska Institute, Stockholm, Sweden; 7Department of Gastroenterology and Hepatology, Academic Medical Center, Amsterdam, the Netherlands; 8Julius Center for Health Sciences and Primary Care, University Medical Center Utrecht, Utrecht, the Netherlands
Purpose: The purpose of this study was to investigate to what extent the outcomes of a discrete choice experiment (DCE) differ based on respondents’ psychological distance to the decision at hand.
Methods: A DCE questionnaire regarding individuals’ preferences for genetic screening for colorectal cancer (CRC) within the Dutch national CRC screening program was created. The DCE contained nine D-efficient designed choice tasks and was distributed among two populations that differ in their psychological distance to the decision at hand: 1) a representative sample of the Dutch general population aged 55–65 years, and 2) a sample of Dutch individuals who attended an information appointment regarding colonoscopies following the detection of blood in their stool sample in the CRC screening program. The DCE consisted of four attributes related to the decision whether to participate in genetic screening for CRC: 1) risk of being genetically predisposed, 2) risk of developing CRC, 3) frequency of follow-up colonoscopies, and 4) survival. Direct attribute ranking, dominant decision-making behavior, and relative importance scores (based on panel MIXL) were compared between the two populations. Attribute level estimates were compared with the Swait and Louviere test.
Results: The proportion of respondents who both ranked survival as the most important attribute, and showed dominant decision-making behavior for this attribute, was significantly higher in the screened population compared to the general population. The relative importance scores of the attributes significantly differed between populations. Finally, the Swait and Louviere test also revealed significant differences in attribute level estimates in both the populations.
Conclusion: The study outcomes differed between populations depending on their psychological distance to the decision. This study shows the importance of adequate sample selection; therefore, it is advocated to increase attention to study sample selection and reporting in DCE studies.
Keywords: discrete choice experiment, preferences, stated preferences, sample, psychological distance, genetic screening
Introduction
Discrete choice experiments (DCEs) are used to elicit individuals’ preferences for goods, products, and services.1–3 In a DCE, respondents are asked to state their preferences by completing several hypothetical choice tasks. DCEs are built on the random utility theory (RUT), assuming that decisions about any good, product, or service depend on the valuation of the levels of its characteristics or attributes.1–3 DCEs are increasingly being used in health care and public health4,5 for different purposes, the provision of accurate insights in preferences of the target population for specific treatment characteristics is one example. This enables drug developers and/or program designers to 1) develop and adjust treatments to reflect the preferences of anticipated users and 2) provide accurate estimates of the potential uptake rate of a treatment. Since this implies that DCEs can be used as input for policy-making, the accuracy and validity of measured (ie, stated) preferences are essential. In other words, for stated preferences to accurately reflect revealed preferences, they should at least be measured among the actual target population for the intervention at hand.
Identifying the target population and recruiting the study sample are often relatively straightforward tasks when studying preferences for specific and available treatments. Patients, especially the chronically ill, often have experience with decision-making in relation to treatment or health, which adds to the validity of the elicited preferences.3 However, in a number of other health care situations, particularly in the public health setting, defining target populations and recruiting study samples is less straightforward. For some newly designed treatments or preventive initiatives, the exact target population might not even exist (yet), for instance in relation to genetic screening. For this reason, several DCEs on public health initiatives, a sample of the general population is recruited instead.5–7 In contrast to patients, such populations might be less experienced in making health-related decisions. They might also have problems imagining situations that are unfamiliar and do not apply to them at this particular point in life. Eliciting preferences from such relatively inexperienced (general) populations for a specific public health initiative, which will only become available in the future, might lead to biased estimates. In which case respondents’ stated preferences inaccurately reflect revealed preferences of the actual target population.
Several theories suggest that individuals’ attitudes, preferences, and intentions are influenced by awareness, risk perception, experience, and time to the event in question.8–16 In particular the construal level theory, postulating individuals’ preferences depends on their psychological distance to the decision at hand.14,15 Psychological distance has several dimensions, among which temporal distance (time to the event) and hypothetical distance (experience with the event) are most relevant in health-related decision-making.14,15 For example, if people are asked to express their preferences in relation to a future cancer screening test that is years away, the psychological distance is vast, which suggests that their decisions will reflect rather the abstract thoughts about the characteristics of the screening (eg, improved life expectancy).17 If asked to express their preferences regarding the same screening test being introduced next week, people will likely depend on more concrete thoughts about the characteristics of screening test instead (eg, the discomfort of the test).17 This example illustrates the fact that individuals’ decision-making regarding more distant events results in high construal and relative abstract thinking, while decision-making regarding more close and upcoming events results in low construal and relative concrete thinking.14,15 The aim of this study was to investigate if and to what extent the outcomes of a DCE differ based on respondents’ psychological distance to the decision at hand.
Materials and methods
DCE case study
A DCE on preferences for genetic screening for colorectal cancer (CRC) was used as a case for this study. From 2014 onward, all Dutch residents aged 55–75 years are gradually invited to participate in the national population-based screening program for CRC, which is based on a fecal immunochemical test (FIT). If the test is positive (ie, blood is detected in stool, indicating an increased CRC risk), a colonoscopy is planned and participants are asked to report on their family cancer history. Depending on colonoscopy findings and family history results, further genetic analysis might be advised.
Study populations
For our purpose, we recruited two separate samples of participants who differed in relative psychological distance to genetic screening for CRC.
Population 1 – general population
Individuals were eligible to participate in this part of the study if they were 55–65 years of age and were not yet invited to participate in the national CRC screening program. Respondents were recruited via an existing online panel of the general Dutch population. The sample is representative for the entire target population with respect to age, gender, and educational level. In total, 5,500 individuals were invited to participate in this study and recruitment continued until at least 500 questionnaires were completed in full.18
Population 2 – screened population
Individuals were eligible to participate in this part of the study if they had participated in the Dutch population-based CRC screening (as introduced in 2014 for all Dutch citizens aged 55–75 years), had a subsequent positive FIT, and were attending an intake appointment for a colonoscopy at the Bergman Clinics IZA or IZB. Questionnaires were handed out to all individuals fulfilling the above criteria. In total, endoscopy nurses handed out 675 questionnaires of which 288 were returned (43%). Excluding all respondents with >10% missing choice tasks resulted in 210 usable questionnaires.
For the total study, the Dutch Central Committee on Research involving Human Subjects concluded that formal testing by an institutional review board was not necessary, as respondents were only required to complete an anonymous and noninvasive questionnaire once (the decision to complete the survey either online or on paper was deemed to be informed consent for this study), which is in accordance with the Dutch legislation and guidelines laid down in the Declaration of Helsinki.
Attributes, levels, and experimental design
To construct the DCE used for this study, attributes were selected based on previously published studies,19–27 interviews with six experts (ie, a scientist with a specific interest in public health genomics, a scientist with a specific interest in ethics of genetics/genomics, a specialist in cancer genetics, and three medical specialists in gastroenterology), and five group interviews28 (n=38) with individuals from the target population. Further details on the selection of the attributes and levels for this DCE are described in Veldwijk et al18 Finally, four attributes with three levels each were selected for this DCE (Table 1).
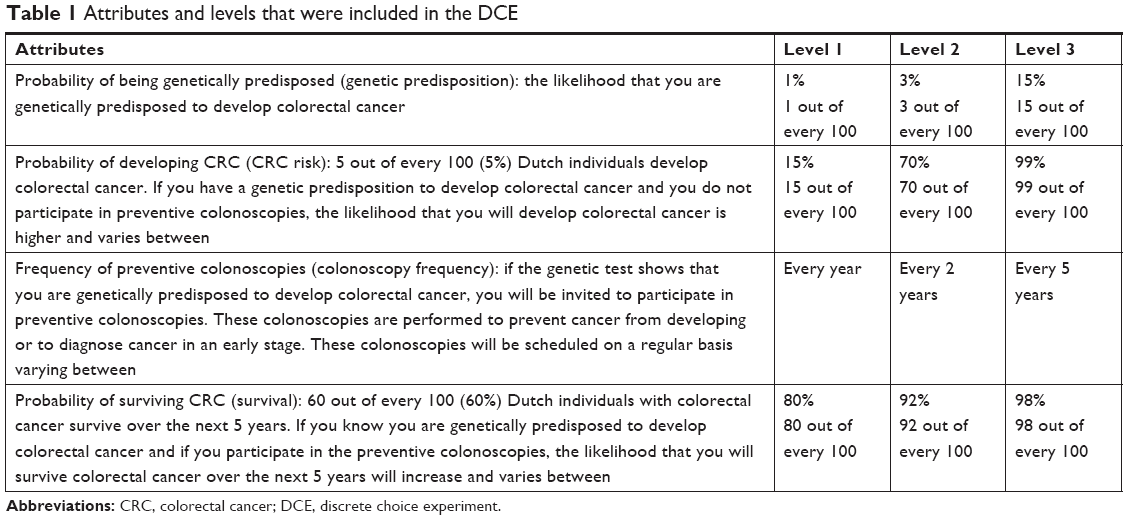 | Table 1 Attributes and levels that were included in the DCE |
NGene 1.0 (ChoiceMetrics, 2011) software was used to develop a D-efficient main-effects design.29 A design was constructed based on a panel mixed-multinomial-logit model, using effect codes for all attributes and including beta priors from the pilot study. The DCE consisted of nine unique choice tasks each containing two alternatives. Before participants were asked to complete the choice tasks, they received detailed information on the meaning of all attributes and levels as well as an explanation on how to complete a choice task, illustrated by an example. Although the design included forced choices, participants were asked after each choice task whether they would actually participate in the chosen situation or not (ie, opt-out). The draft questionnaire was pilot tested among a subgroup (n=90) of the population, of which four (n=4) were “think aloud” tests. Whether correct wording was used and whether the target population understood the attributes, levels, and choice tasks were tested.
Questionnaire
The final questionnaire consisted of the DCE as described above, as well as a separate section of background questions which respondents answered before completing the DCE. This section of the questionnaire comprised questions on demographics such as gender, age, educational level, health literacy, and ethnicity. Educational level was dichotomized into higher (ie, tertiary education) or lower education (ie, all other educational levels). Health literacy was measured by a validated Dutch version of the Set of Brief Screening Questions (SBSQ)30 in which participants scored three questions on a 5-point Likert scale ranging from 0 to 4. An average score of ≤2 indicates inadequate health literacy, while an average score of >2 indicates adequate health literacy.30 Ethnicity was dichotomized into Dutch vs non-Dutch. The part of the questionnaire that included the DCE also included a direct ranking exercise during which respondents were asked to mark the attribute which they thought was most important for their decision regarding genetic testing for CRC.
Statistical analyses
Direct attribute ranking
Direct attribute ranking scores were obtained from all respondents in both the populations. Chi-squared tests were used to test whether the proportion of respondents who ranked a certain attribute as most important differed between the general and screened population.
Dominant decision-making behavior
The proportion of respondents who always chose to opt-out, who always chose the scenario with the highest survival, and who always chose the highest frequency of preventive colonoscopies was calculated within both the populations. Chi-squared tests were conducted to test whether these proportions differed significantly between the general and the screened population.
Preference heterogeneity and relative importance
Nlogit 5.0 (econometric software) was used to estimate the panel mixed multinomial logit (MIXL) models which were chosen for this study to adjust for the multilevel structure of the data (every respondent answered nine choice tasks) and to be able to allow for preference heterogeneity.31 Results were considered statistically significant when P<0.10. Only forced choices were analyzed. The systematic utility component (V) describes the measurable part of the utility of a specific genetic screening test based on the attributes that were included in the DCE, which was tested using the following equation:
|
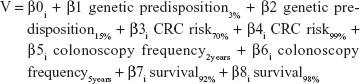
β1–β8 are the attribute level estimates that indicate the relative importance of each attribute level. The sign of the estimate indicates whether the attribute level has a positive or a negative influence on the utility. β0 was included as an alternative specific constant term. All attributes were considered categorical and therefore recoded using effects coding, accounting for potential non-linearity.32 In contrast to dummy coding, this coding procedure codes the reference category as –1 and the sum of the effect coded attribute levels is always zero.32 The coefficient for the reference categories of the attributes included in this study are therefore calculated as –1*(β effect code 1 + β effect code 2). Based on the significance of the estimates of the SD, which attributes should be included as random parameters due to significant preference heterogeneity and with what distribution (CRC risk, colonoscopy frequency, and survival were included as random parameters, all with normal distributions) were determined.
Relative importance scores were calculated based on the results of the panel MIXL models separately for the general and the screened population. Within each attribute, the difference between the estimates of the smallest and largest attribute level estimate was calculated. The largest difference value received an importance score of 1, and the other difference values were divided by the largest difference value, resulting in a relative distance of all attributes compared to the most important attribute.
Differences in attribute level estimates and the role of the scale parameter
When comparing the attribute level estimates of two data sets, the role of the scale parameter should be taken into account. The attribute level estimates that are estimated in the multinomial logit (MNL) model are a ratio of the true parameter estimates and a scale parameter (ie, inverse variance). Since variances differ between data sets, the attribute level estimates cannot be compared directly between data sets before scale factor differences (variance differences) between the models are ruled out.33 The Swait and Louviere test was used for this purpose.33 For further details on the procedure, see Supplementary material S1.
Sensitivity analyses
About 25% of the respondents from the screened population was excluded due to >10% missing choice tasks (ie, missing answers on two or more choice tasks). In most instances these were consecutive choice tasks; therefore, it is assumed that this was most likely due to accidently skipping a page (implying 2–4 missed choice tasks at once). To ensure robustness of our results, all DCE analyses were conducted separately for data sets including and excluding these respondents. In addition, since older age and male gender are associated with a higher likelihood of CRC and thereby positive FIT,25 significant differences in demographic characteristics were expected and were also found between the general and screened population. To account for these obvious and significant differences, separate analyses were conducted to investigate the role of the scale parameter by means of matching respondents of both the populations through propensity scores,34 as well as comparing data sets separately for males, females, lower educated respondents, higher educated respondents, and respondents aged 55–65 years only.
Results
Respondents’ characteristics
Respondents in the general population were significantly younger (59.5 vs 65.5 years of age) compared to respondents in the screened population (Table 2). The general population sample consisted of significantly more females (50.9% vs 39.2%), respondents with inadequate health literacy (3.4% vs 1.0%) and respondents with a Dutch origin (96.6% vs 93.3%) compared to the screened population (Table 2).
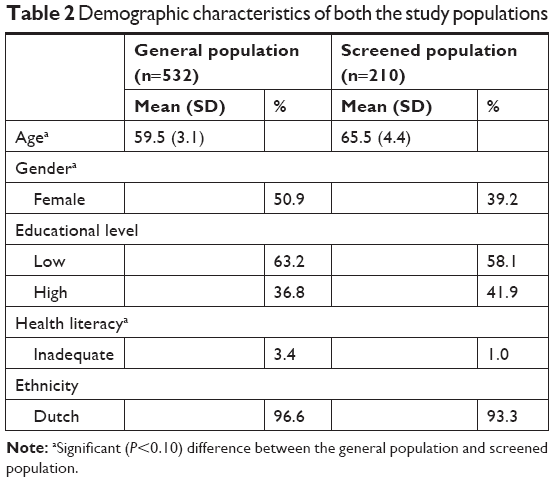 | Table 2 Demographic characteristics of both the study populations |
Direct attribute ranking
In the screened population, a significantly higher proportion of respondents indicated that survival was the most important attribute for them compared to the general population (64% vs 56%, P=0.05). Regarding the importance of the other attributes, no significant differences were found between the populations.
Dominant decision-making behavior
The proportion of respondents in the screened population who always chose the alternative with the highest survival was significantly higher compared to the proportion in the general population (13.8% vs 9.2%, P=0.07). Although the proportion of respondents who always chose to opt-out and always chose the alternative with the highest frequency of preventive colonoscopies was higher in the general population compared to the proportion in the screened population, this difference was not statistically significant (opt-out: 3.6% vs 2.4%, P=0.41; frequency of colonoscopies: 11.1% vs 8.6%, P=0.31).
Preference heterogeneity and relative importance
Within both the MNL and panel MIXL, the attribute level estimates show equal directions in the general and the screened population (Table 3). For instance, all respondents preferred a survival of 98% over a survival of 80% and biannual preventive colonoscopies over having a preventive colonoscopy every 5 years. Significant preference heterogeneity was shown for three out of the four attributes in both samples (Table 3). The relative importance scores of the attributes differed between the general and the screened population. Although survival was most important in both populations the distance of the importance values of the other attributes relative to survival were smaller in the general population compared to the screened population (Table 3).
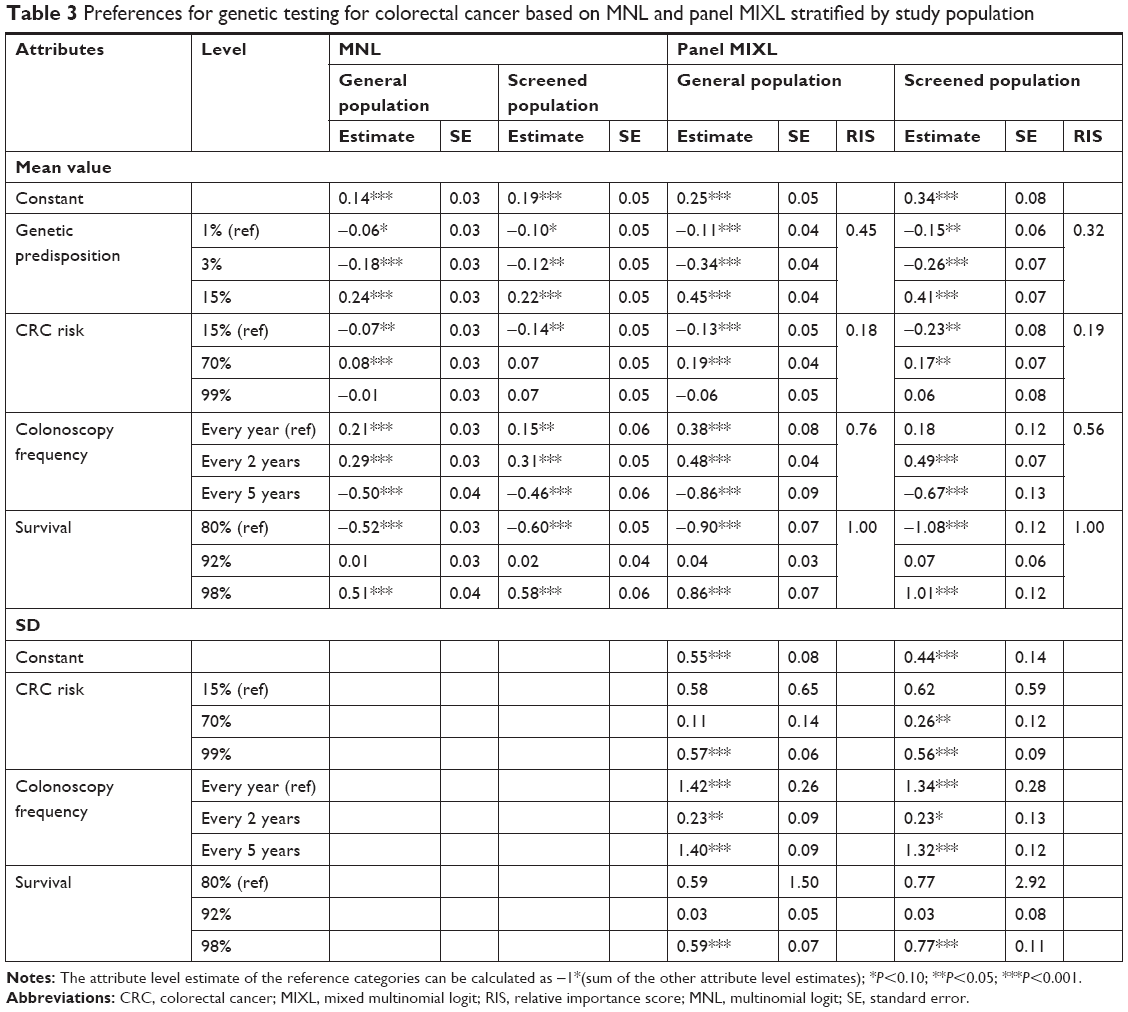 | Table 3 Preferences for genetic testing for colorectal cancer based on MNL and panel MIXL stratified by study population |
Differences in attribute level estimates and the role of the scale parameter
Identifying the scale parameter according to the Swait and Louviere test can only be performed by using an MNL model. The log likelihood of the MNL model was fitted separately in both the data sets (general population: −2,897.5; screened population: −1,041.4) and those were tested against the log likelihood of the MNL model for the pooled data set (−4,310.5), which accounted for potential scale parameter differences (scale parameter was estimated at 1.22; Figure 1). By means of the chi-squared test the hypothesis of equal attribute level estimates was rejected (P<0.05). The differences in attribute level estimates between the general and the screened population were statistically significant.
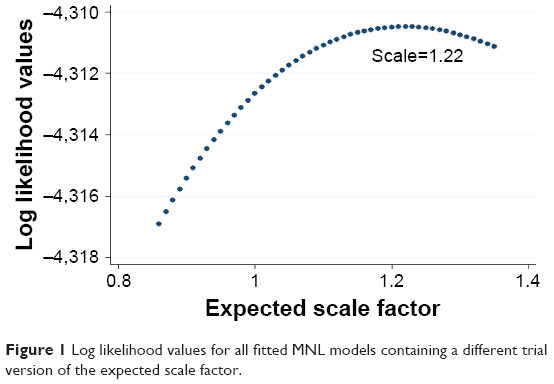 | Figure 1 Log likelihood values for all fitted MNL models containing a different trial version of the expected scale factor. |
Sensitivity analyses
Including the respondents with >10% missing values on their choice tasks did not change any of the study outcomes. In addition, the significant differences in attribute level estimates between the general and the screened population were also confirmed when accounting for differences in demographic variables by means of propensity scores. Finally, when performing the above-mentioned scale parameter analysis separately for males, females, lower educated respondents, higher educated respondents, and respondents aged 55–65 years, significant differences in the attribute level estimates between the general and the screened population were confirmed.
Discussion
This study shows that selecting different target populations for the same DCE yields different study outcomes. Respondents with different psychological distance to the decision at hand showed differences in terms of direct attribute ranking, dominant decision-making behavior, relative importance scores, and attribute level estimates. Respondents with higher risk of being diagnosed with CRC (screened population) are (by definition) closer to the actual decision-making in relation to genetic testing.
Results of this study are in line with the assumptions of the construal level theory, where more distant decisions are processed on a higher level using more abstract notions of the event, while decisions that are closer in time are processed on a lower level using more concrete features of the decision.14,15 Respondents in the screened population focused on the more concrete aspects of the decision, namely the survival attribute, and less on the more abstract attributes, ie, “genetic predisposition” and “CRC risk.” Although “colonoscopy frequency” initially seems to be one of the more a concrete attributes, results show that it was not as important for decision-making in the screened population as it appear to be in the general population. There are two separate possible explanations for this: first, respondents in the screened population had already experienced a consultation where they had received information about colonoscopies. This might have lowered their level of anxiety in relation to the procedure, and adjusted their (possibly unrealistic) expectations about the preventive capability this procedure has (ie, the misconception that more frequent colonoscopies reduces the risk of developing CRC).18,35,36 Second, if the possibility of one’s own death becomes probable and realistic, people tend to focus on this fact, disregarding other factors (ie, death priming).16,37–39 It is possible that the results from this DCE have been influenced by this as the results reveal a significantly larger proportion of respondents in the screened population showing dominant decision-making behavior in relation to the survival attribute in the DCE.
In this context, it is important to mention that being based on the RUT,1–3 DCEs are subject to rather strong assumptions regarding rational decision-making. In this paper, we show that these strong assumptions do not necessarily hold. Responses from respondents with a large psychological distance (ie, general population) were more in line with the underlying theory, however, their stated preferences are not in alignment with responses from the actual target population (ie, screened population). Therefore, we issue a word of caution against conducting DCES in the general population to predict preferences and uptake regarding specific treatments within an actual target/patient population. Based on the current study results, we recommend to pay more attention to the context in which respondents make decisions (acknowledging psychological distance as a feature) in future DCEs. When designing their DCEs, researchers need to consider the contextual factors that might affect preferences and (when possible) control for them. Of course, selecting the adequate population is vital. However, if the target population does not exist (yet) or the topic of the DCE is completely unfamiliar to the population, other measures to either reduce or control for the effect of psychological distance on preferences need to be evaluated.40 For example, the use of refined educational tools such as serious games (scenario-based educational tools)41–43 could help to improve respondents’ ability to imagine the choice situations. Such tools may also be a means to control the way in which concrete features at large distance influence people.40 Selecting the right population, or eliciting well-informed preferences from a more distant population that has been educated on the topic, has the potential to significantly improve the external validity of DCEs.
In addition, we identify a need for more research to determine whether the effects of psychological distance on preferences is constant over different decision situations, disease areas and respondent populations. If this is the case, researchers using DCE to study preferences in relation to new treatments or preventive initiatives where the actual target population is not (yet) fully defined, will, at least, be clear about the potential bias of their results incurred by the respondents psychological distance to the decision at hand.
This study was subject to some limitations. First, given the context of this study (CRC screening), the current sample was relatively older compared to the general Dutch population. Since higher age is potentially associated with greater experience with making health-related decisions, differences in preferences due to psychological distance might be even greater among the younger population. Second, in agreement with other questionnaires and previous DCEs, the current sample included a lower number of individuals from an ethnic minority than present in the general population. Cultural differences in such subpopulations may impact psychological distance, but those effects are unknown from this study. Third, although this study included respondents from two populations that differed in their psychological distance toward the decision, the actual target population of genetic tests for CRC (ie, individuals with confirmed CRC after colonoscopy and/or a specific family history) could not be included. Since differences in outcomes were already identified using the current samples, it is expected that those differences would even be more pronounced when comparing the general population to this actual target population. Finally, the current study used a minimal design, since only nine choice tasks were included. As a general rule of thumb, we would have power to estimate eight (9 – 1) parameters in such a design. However, because of the similarity between the results of the MNL model and the panel MIXL presented in our paper, the fact that we only estimated generic attribute level estimates, we have no indications that the presented results would not be sound.
Conclusion
In this study, direct attribute ranking, dominant decision-making behavior, relative importance scores, and attribute level estimates differed when comparing two populations with a different psychological distance to the decision at hand. This study shows the importance of adequate sample selection. It is therefore advocated to increase attention to study sample selection and reporting in DCE studies.
Acknowledgments
Authors would like to thank Josepine Fernow of the Centre for Research Ethics & Bioethics from Uppsala University for her assistance with writing this manuscript. This paper was presented at the International Choice Modelling Conference and at the International Academy of Choice Modelling Conference as an oral presentation with interim findings. The abstract was published on the International Choice Modelling Conference website (http://www.icmconference.org.uk/index.php/icmc/ICMC2017/paper/view/1071) and printed within an abstract book (attendee access only) for both the conferences.
Disclosure
The authors report no conflicts of interest in this work.
References
Hensher D, Rose JM, Greene WH. Applied choice analysis: second edition. Cambridge, UK: Cambridge University Press; 2015. | ||
Louviere JJ, Hensher DA, Swait JD. Swait, stated choice methods; analysis and application. Cambridge: Cambridge University Press; 2000. | ||
Amaya-Amaya M, Gerard K, editor. Using Discrete Choice Experiments to Value Health and Health Care. Dordrecht: Springer; 2008. | ||
Clark MD, Determann D, Petrou S, Moro D, de Bekker-Grob EW. Discrete choice experiments in health economics: a review of the literature. Pharmacoeconomics. 2014;32(9):883–902. | ||
de Bekker-Grob EW, Ryan M, Gerard K. Discrete choice experiments in health economics: a review of the literature. Health Econ. 2012;21(2):145–172. | ||
Marshall D, Bridges JF, Hauber B, et al. Conjoint analysis applications in health – how are studies being designed and reported? An update on current practice in the published literature between 2005 and 2008. Patient. 2010;3(4):249–256. | ||
Watson V, Becker F, de Bekker-Grob E. Discrete choice experiment response rates: a meta-analysis. Health Econ. 2017;26(6):810–817. | ||
Glanz K, Rimer BK, Viswanath K, Behavior H. Education: theory, research and practice. 4th ed. San Fransisco: Jossey-Bass; 2008. | ||
Ajzen I, Fishbein M. Understanding attitudes and predicting social behavior. Englewood Cliffs, NJ: Pretence Hall; 1980. | ||
Ajzen I. The theory of planned behavior. Organ Behav Hum Decis Process. 1991;50(2):179–211. | ||
Fishbein M, Ajzen I. Belief, attitude, intention and behavior: an introduction to theory and research. Reading, MassA: Addison-Wesley; 1975. | ||
Becker MH. The health belief model and personal health behavior. Health Education Monographs. Winter, 1974; volume 11, issue 1. | ||
Janz NK, Becker MH. The health belief model: a decade later. Health Educ Q. 1984;11(1):1–47. | ||
Liberman N, Trope Y. The role of feasibility and desirability considerations in near and distant future decisions: a test of temporal construal theory. J Pers Soc Psychol. 1998;75(1):5–18. | ||
Trope Y, Liberman N. Temporal construal. Psychol Rev. 2003;110(3):403–421. | ||
Kahneman D, Tversky A. Prospect theory: an analysis of decision under risk. Econometrica. 1979;47(2):263–291. | ||
Mühlbacher AC, Juhnke C. Patient preferences versus physicians’ judgement: does it make a difference in healthcare decision making? Appl Health Econ Health Policy. 2013;11(3):163–180. | ||
Veldwijk J, Lambooij MS, Kallenberg FG, et al. Preferences for genetic testing for colorectal cancer within a population-based screening program: a discrete choice experiment. Eur J Hum Genet. 2016;24(3):361–366. | ||
Hall J, Fiebig DG, King MT, Hossain I, Louviere JJ. What influences participation in genetic carrier testing? Results from a discrete choice experiment. J Health Econ. 2006;25(3):520–537. | ||
Kuppermann M, Wang G, Wong S, et al. Preferences for outcomes associated with decisions to undergo or forgo genetic testing for Lynch syndrome. Cancer. 2013;119(1):215–225. | ||
Matro JM, Ruth KJ, Wong YN, et al. Cost sharing and hereditary cancer risk: predictors of willingness-to-pay for genetic testing. J Genet Couns. 2014;23(6):1002–1011. | ||
Severin F, Schmidtke J, Mühlbacher A, Rogowski WH. Eliciting preferences for priority setting in genetic testing: a pilot study comparing best-worst scaling and discrete-choice experiments. Eur J Hum Genet. 2013;21(11):1202–1208. | ||
Walsh J, Arora M, Hosenfeld C, Ladabaum U, Kuppermann M, Knight SJ. Preferences for genetic testing to identify hereditary colorectal cancer: perspectives of high-risk patients, community members, and clinicians. J Canc Educ. 2012;27(1):112–119. | ||
American Gastroenterological Association. American gastroenterological association medical position statement: hereditary colorectal cancer and genetic testing. Gastroenterology. 2001;121(1):195–197. | ||
Dutch Society For Clinical Genetics. CBO guideline hereditary colorectal cancer 2008. Oisterwijk: Van den Boogaard; 2008. | ||
Giardiello FM, Allen JI, Axilbund JE, et al. Guidelines on genetic evaluation and management of Lynch syndrome: a consensus statement by the US Multi-society task force on colorectal cancer. Am J Gastroenterol. 2014;109(8):1159–1179. | ||
Vasen HFA, van der Meulen-de Jong AE, de Vos Tot Nederveen Cappel WH, Oliveira J; ESMO Guidelines Working Group. Familial colorectal cancer risk: ESMO clinical recommendations. Ann Oncol. 2009;20(Supplement 4):iv51–iv53. | ||
Hiligsmann M, van Durme C, Geusens P, et al. Nominal group technique to select attributes for discrete choice experiments: an example for drug treatment choice in osteoporosis. Patient Prefer Adherence. 2013;7:133–139. | ||
Hensher DA, Rose JM, Greene WH. Applied choice analysis: a primer. New York: Cambridge University Press; 2005. | ||
Fransen MP, van Schaik TM, Twickler TB, Essink-Bot ML. Applicability of internationally available health literacy measures in the Netherlands. J Health Commun. 2011;16(sup 3):134–149. | ||
Fiebig DG, Keane MP, Louviere J, Wasi N. The generalized multinomial logit model: Accounting for scale and coefficient heterogeneity. Mark Sci. 2010;29(3):393–421. | ||
Bech M, Gyrd-Hansen D. Effects coding in discrete choice experiments. Health Econ. 2005;14(10):1079–1083. | ||
Swait J, Louviere J. The role of the scale parameter in the estimation and comparison of multinomial logit models. J Mark Res. 1993;30(3):305–314. | ||
Rosenbaum PR, Rubin DB. The central role of the propensity score in observational studies for causal effects. Biometrika. 1983;70(1):41–55. | ||
Grilo Bensusan I, Herrera Martín P, Aguado Álvarez MV. Prospective study of anxiety in patients undergoing an outpatient colonoscopy. Rev Esp Enferm Dig. 2016;108(12):765–769. | ||
Mikocka-Walus AA, Moulds LG, Rollbusch N, Andrews JM. “It’s a tube up your bottom; it makes people nervous”: the experience of anxiety in initial colonoscopy patients. Gastroenterol Nurs. 2012;35(6):392–401. | ||
Liu W, Aaker J. Do you look to the future or focus on today? The impact of life experience on intertemporal decisions. Organ Behav Hum Decis Process. 2007;102(2):212–225. | ||
Slovic P, Risk perception of perception of risk. Science. 1987;236(4799):280–285. | ||
Wade-Benzoni KA, Tost LP, Hernandez M, Larrick RP. It’s only a matter of time: death, legacies, and intergenerational decisions. Psychol Sci. 2012;23(7):704–709. | ||
Hamilton RW, Thompson DV. Is there a substitute for direct experience? Comparing consumers’ preferences after direct and indirect product experiences. J Consum Res. 2007;34(4):546–555. | ||
Syrowatka A, Krömker D, Meguerditchian AN, Tamblyn R. Features of computer-based decision aids: systematic review, thematic synthesis, and meta-analyses. J Med Internet Res. 2016;18(1):e20. | ||
Reichlin L, Mani N, McArthur K, Harris AM, Rajan N, Dacso CC. Assessing the acceptability and usability of an interactive serious game in aiding treatment decisions for patients with localized prostate cancer. J Med Internet Res. 2011;13(1):e4. | ||
Lieberman DA. Management of chronic pediatric diseases with interactive health games: theory and research findings. J Ambul Care Manage. 2001;24(1):26–38. |
Supplementary material
The role of the scale parameter
According to the method proposed by Swait and Louviere,1 the role of the scale parameter when comparing two data sets can be determined by confirming that β1 = β2 and μ1 = μ2, where β represents the attribute level estimates and μ represents the accompanying standard error. In order to do so, a four-step specific procedure that contains two hypotheses needs to be followed.
- An MNL model is fitted within both the population data sets separately. For both those models, the log likelihood is collected (L1 and L2).1
- The attribute level codes in one of the data sets are multiplied by a trial version of the expected scale factor. The two data sets are then combined and the log likelihood for this pooled data set is determined (Lm).1 This routine is repeated for different trial versions of the expected scale factor. This second step will result in a list of log likelihoods of which 1 represents the model with the best fit.
- The following hypothesis is tested: λA = −2*[Lm − (L1 + L2)] < χ2 with (K+1) degrees of freedom.1 In this hypothesis, the log likelihood of the optimal model in step 2 (while accounting for a specific scale parameter) is compared with the log likelihoods of the two separate models from step 1. This value is compared with the χ2 value of the number of parameters in the model plus 1.1 If this hypothesis is rejected, the differences in attribute level estimates between both the models are statistically significant. If this hypothesis is accepted, the attribute level estimates of both the models do not differ significantly and testing for the scale factor can be continued.
- Both the data sets from step 1 are pooled and an MNL model is fitted. The log likelihood of this model (Lp) is then compared with the log likelihood of the optimal model found in step 2 (Lm), using the following hypothesis: λB = −2[Lp − Lm] < χ2 with (K+1) degrees of freedom.1 If this hypothesis is rejected, the scale parameter is statistically different from 1 and differences between the two models of both the data sets are explained by scale. If this hypothesis is accepted, the models of both the data sets are equal and the scale parameter does not differ from 1.
Reference
Swait J, Louviere J. The role of the scale parameter in the estimation and comparison of multinomial logit models. J Mark Res. 1993;30(3):305–314. |
 © 2019 The Author(s). This work is published and licensed by Dove Medical Press Limited. The
full terms of this license are available at https://www.dovepress.com/terms
and incorporate the Creative Commons Attribution
- Non Commercial (unported, 3.0) License.
By accessing the work you hereby accept the Terms. Non-commercial uses of the work are permitted
without any further permission from Dove Medical Press Limited, provided the work is properly
attributed. For permission for commercial use of this work, please see paragraphs 4.2 and 5 of our Terms.
© 2019 The Author(s). This work is published and licensed by Dove Medical Press Limited. The
full terms of this license are available at https://www.dovepress.com/terms
and incorporate the Creative Commons Attribution
- Non Commercial (unported, 3.0) License.
By accessing the work you hereby accept the Terms. Non-commercial uses of the work are permitted
without any further permission from Dove Medical Press Limited, provided the work is properly
attributed. For permission for commercial use of this work, please see paragraphs 4.2 and 5 of our Terms.