Back to Journals » Vascular Health and Risk Management » Volume 15
High level of individual lipid profile and lipid ratio as a predictive marker of poor glycemic control in type-2 diabetes mellitus
Authors Artha IMJR, Bhargah A ![]() , Dharmawan NK, Pande UW, Triyana KA, Mahariski PA
, Dharmawan NK, Pande UW, Triyana KA, Mahariski PA ![]() , Yuwono J, Bhargah V
, Yuwono J, Bhargah V ![]() , Prabawa IPY
, Prabawa IPY ![]() , Manuaba IBAP
, Manuaba IBAP ![]() , Rina IK
, Rina IK
Received 24 March 2019
Accepted for publication 3 May 2019
Published 5 June 2019 Volume 2019:15 Pages 149—157
DOI https://doi.org/10.2147/VHRM.S209830
Checked for plagiarism Yes
Review by Single anonymous peer review
Peer reviewer comments 2
Editor who approved publication: Prof. Dr. Pietro Scicchitano
Video abstract presented by Agha Bhargah.
Views: 617
I Made Junior Rina Artha,1 Agha Bhargah,1,2 Nyoman Khrisna Dharmawan,2 Utami Wijayaswari Pande,2 Komang Agus Triyana,2 Pande Agung Mahariski,2 Jessica Yuwono,2 Varennia Bhargah,2 I Putu Yuda Prabawa,3 Ida Bagus Amertha Putra Manuaba,4,5 I Ketut Rina6
1Department of Cardiology and Vascular Medicine, Faculty of Medicine, Udayana University, Sanglah General Hospital, Denpasar, Bali, Indonesia; 2Faculty of Medicine, Udayana University, Denpasar, Bali, Indonesia; 3Clinical Pathology Department, Faculty of Medicine, Udayana University, Sanglah General Hospital, Denpasar, Bali, Indonesia; 4International Ph.D Program in Medicine, College of Medicine, Taipei Medical University, Taipei, Taiwan; 5Medical and Health Education Unit, Faculty of Medicine, Udayana University, Denpaser, Bali, Indonesia; 6Cardiology Department, Puri Raharja General Hospital, Denpasar, Bali, Indonesia
Introduction: Diabetes is often accompanied by undiagnosed dyslipidemia. The aim of the study is to investigate the clinical relevance of lipid profiles and lipid ratios as predictive biochemical models for glycemic control in patients with type 2 diabetes mellitus (T2DM).
Methods: This is a retrospective study recruiting 140 patients with T2DM during a one-year period, 2018–2019, at the Diabetic Center Sanglah General Hospital and Internal Medicine Polyclinic Puri Raharja General Hospital. Demographic characteristics, glycosylated hemoglobin (HBA1c) , and lipid profile were recorded and analyzed using SPSS version 25.0 for Windows. The sample is then classified into good (HBA1c≤7) and poor (HBA1c>7) glycemic control. Risk analysis model, receiver operator characteristics (ROC) analysis, and correlation test were used to evaluate the association of HBA1c level with lipid profile and lipid ratio parameters.
Result: Lipid profile findings such as total cholesterol (TC), low-density lipoprotein cholesterol (LDL-C) , triglycerides (TG), and lipid ratio parameter (LDL-C to high-density lipoprotein cholesterol (HDL-C) ratio) were higher in patients in the poor glycemic control group (p<0.05) and HDL-C was significantly lower in patients with poor glycemic control (p=0.001). There is a significant positive correlation between LDL, total cholesterol, LDL-C, TG, and TC to HDL-C ratio, triglycerides, and TC/HDL-C ratio with HBA1c level. Meanwhile, a negative correlation was observed on HDL-C with the HBA1c level. Only TC/HDL-C ratio and LDL-C/HDL-C ratio parameters may be used as predictive models (AUC>0.7), with cutoff point, sensitivity, and specificity of 4.68 (77%; 52%) and 3.06 (98%; 56%) respectively. A risk analysis model shows that the LDL-C/HDL-C ratio parameter is the most influential risk factor in the occurrence of poor glycemic control (adjusted OR =38.76; 95% CI: 27.32–56.64; p<0.001).
Conclusion: Lipid profiles (LDL-C) and lipid ratios (LDL-C/HDL-C and TC/HDL-C ratio) show potential markers that can be used in predicting glycemic control in patients with T2DM.
Keywords: dyslipidemia, glycemic, diabetes, risk
Introduction
Diabetes is a metabolic disease characterized by a state of hyperglycemia caused by a defect of insulin action, insulin secretion or both (insulin resistance).1,2 The incidence of diabetes itself is still something that should be aware of developing and developed countries. In the USA in 2012 the incidence of diabetes was 1.9 million people, while globally the incidence of diabetes mellitus was estimated around 8.3%.3 It was estimated that in 2017 there are 451 million (age 18–99 years) people with diabetes worldwide. These figures were expected to increase to 693 million by 2045. It was estimated that almost half of all people (49.7%) living with diabetes are undiagnosed. The increase in the incidence of diabetes shows that in the future there will be more diabetes-related complications that will be faced such as coronary heart disease (CAD), peripheral arterial disease (PAD), stroke, and other conditions caused by endothelial dysfunction in diabetic conditions.4,5 Apart from that, the future challenge for health practitioners is to provide adequate therapy for individuals who have diabetes to achieve the best glycemic control.6
Cardiovascular-related morbidity and mortality are common complications in diabetes and could be associated with dyslipidemia. So, control of lipid profiles and glycemic index is a critical factor in the prevention of cardiovascular complication.5,6
Glycosylated hemoglobin (HBA1c) is an absolute indicator of long-term blood glucose control (a reflection of blood sugar control in the last three months) and is a gold standard of glycemic control in patients with type 2 diabetes mellitus (T2DM).6,7 Increased HBA1c has been known as a risk factor for cardiovascular disorders in patients with diabetes. Many individuals with diabetes who have poor glycemic control experience a dyslipidemic state such as an increase in triglycerides (TG), low-density lipoprotein cholesterol (LDL-C), and a decrease in high-density lipoprotein cholesterol (HDL-C).4,7 Individuals with diabetes accompanied by the coexistence of metabolic syndrome (hypertension, dyslipidemia, abdominal obesity, and hyperglycemia) have a very high risk for the occurrence of a cardiovascular complication.3,4
A close linkage between glycemic control with lipid profiles makes it necessary to pay special attention to both aspects in order to prevent microvascular and macrovascular complications associated with diabetes.8–10 Based on recommendations for treatment of dyslipidemia by the European Society of Cardiology (ESC), LDL cholesterol has become the main focus in the management of lipid profiles in patients with CAD or a CAD risk factor equivalent such as diabetes, which must have strict LDL-C control below 70 mg/dL.8 This illustrates that lipid profiles play a critical role in cardiovascular risk and the prognosis of diabetes.
The study conducted by Lin et al11 showed that patients with diabetes mellitus had higher levels of lipid profiles (LDL-C, total cholesterol (TC), TG) and lipid ratios (TG/HDL, LDL/HDL) compared to healthy people and a significant positive correlation between lipid profiles and HBA1c level. The existence of these findings illustrates there is a link between lipid profiles on the glycemic index and vice versa. This provides a possible association between glycemic control and dyslipidemias in patients with diabetes mellitus.12 This study aims to explore the association between lipid profile and lipid ratio, and uses these lipid parameters as predictive biochemical markers for glycemic index control in patients with type 2 diabetes mellitus.
Method
Study design and subject
This study is a retrospective analysis of T2DM patients who routinely perform glycemic control in the diabetic center of Sanglah General Hospital, and the internal medicine polyclinic of Puri Raharja General Hospital in the period 2018–2019. Patients who have conditions that affect glycemic control such as chronic liver disease and thyroid disorders were excluded from this study. The age range of diabetic persons in this study is 30–65 years. Patients were then recorded for sociodemographic characteristics (age, sex, duration of disease, and hypertension status), HBA1c level (latest three months data) as an indicator of glycemic control, lipid profile (LDL, HDL, TG, and TC) and lipid ratio (TG/HDL-C, LDL-C/HDL-C, TC/HDL, and non-HDL-C). The grouping of research subjects was based on HBA1c levels, the first group is HBA1c ≤7 (good glycemic control), and the second group is HBA1c >7 (poor glycemic control).
Biochemical laboratory evaluation
All lipid profile and HBA1c examinations were carried out following standard laboratory procedures, and the data obtained were the results of the latest blood biochemical examination in the last three months. Non-HDL cholesterol is a result of a subtraction of HDL-C from TC. LDL-C/HDL-C ratio is the result of the absolute value of LDL-C divided by HDL-C. TG/HDL ratio is the result of the absolute value of TG divided by HDL-C. TC/HDL is the ratio of the absolute value of TC divided by HDL-C. The cutoff points used for lipid profile parameters for TC are 200 mg/dL, TG are 150 mg/dL, LDL-C is 130 mg/dL, and HDL-C is 40 mg/dL.
Statistical analysis
Statistical analysis in this study uses SPSS version 25.0 for Windows (IBM Corporation, Armonk, NY, USA). Data that are normally distributed will be displayed in the form of mean and standard deviation, while data that do not have a normal distribution will be shown in the median and IQR. A partial correlation test was used to evaluate the correlation between lipid profile and lipid ratio to HBA1c level, and an independent t-test or Mann–Whitney U-test was used to assess differences in numerical lipid profile and lipid ratio between patients with good and poor glycemic control. Analysis of receiver operator characteristics (ROC) curves and risk analysis models using logistic regression was used to make risk predictions of lipid profile parameters and lipid ratios against glycemic control in patients with T2DM. All tests were considered significant if the value of p<0.05.
Result
Subject characteristics
This study involved 140 people with T2DM. From the demographic characteristics of the subjects there were no significant differences in the age, gender, duration of disease, body mass index (BMI), and hypertensive status between groups with poor and good glycemic control (p>0.05). Lipid profile findings such as TC and LDL-C were significantly higher in the group with poor glycemic control (p<0.05) and HDL-C was significantly lower in patients with poor glycemic control (p=0.001). However, there was no significant difference in triglyceride between patients with good and poor glycemic control (p>0.05). Lipid ratio parameter findings such as TC-TG-LDL/HDL-C ratio were significantly higher in the group with poor glycemic control (p<0.05). However, there was no significant difference in the Non-HDL-C parameter (p=0.059) (Table 1).
 | Table 1 Baseline demographic characteristics, hypertensive status, lipid profile, and lipid ratios between good and poor glycemic control |
Correlation of lipid profile and lipid ratio with HBA1c level
Partial correlation was used to determine the correlation of lipid profile and lipid ratio to HBA1c levels in patients with T2DM by controlling age, gender, disease duration, BMI, and hypertension status. There is a significant positive correlation between LDL (r=0.679), TC (r=0.472), LDL-C/HDL-C ratio (r=0.543), and TG/HDL-C ratio (r=0.5), TG (r=0.276), TC/HDL-C ratio (r=0.266) with HBA1c level. These findings illustrate that the increase in the value of the lipid profile will tend to experience an increase in HBA1c level. On the other hand, there is a negative correlation between HDL-C (r=−0.568; p<0.001) on the HBA1c level, which means that there is an inverse correlation between HDL-C and HBA1c. However, there is no significant correlation observed in non-HDL-C parameters (Table 2).
 | Table 2 Partial correlation between lipid profile and lipid ratio with HBA1c level after adjustment for age, BMI, gender, disease duration, and hypertensive status |
Predictive model of lipid ratio as predictive biochemical markers for glycemic control in type 2 diabetes
Prediction models were performed by receiver operator characteristics curve (ROC) analysis on lipid ratio parameters to glycemic control as the outcome of this study (Figure 1). Only TC/HDL-C ratio and LDL-C/HDL-C ratio parameters may be used as predictive models because they have area under the curve (AUC) >0.7, which is higher than other lipid ratio parameters (TG/HDL-C and non-HDL-C). TC/HDL-C ratio parameters have a sensitivity value of 77% and specificity of 52% with a cutoff value of 4.68, while the LDL-C/HDL-C parameter has a sensitivity of 98% and specificity of 56% with a cutoff value of 3.06 (Table 3).
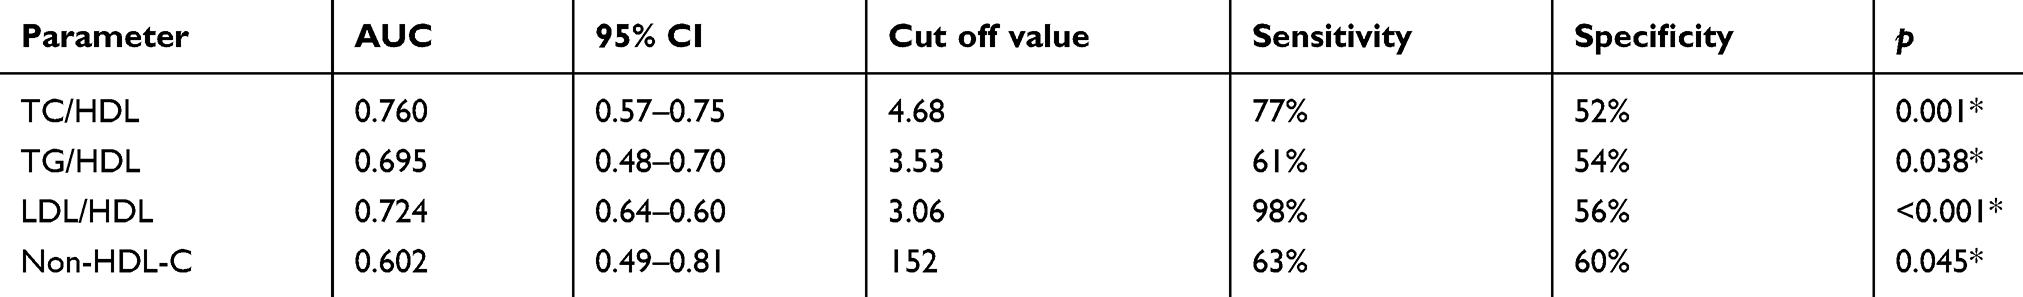 | Table 3 Area under the curve (AUC), cutoff value, sensitivity, specificity of lipid ratio and lipid profile for glycemic control |
 | Figure 1 ROC analysis of lipid profile and lipid ratio as a predictive marker for glycemic control in type 2 diabetes mellitus. |
Risk analysis model of lipid profile and lipid ratio as predictive biochemical markers for glycemic control in T2DM
The risk analysis model is based on the cutoff point on the ROC curve; the lipid ratio value that exceeds the cutoff point will be classified as a high-level ratio, and the value below or equal to the cutoff point will be concluded as a normal level ratio. As for the lipid profile parameters, the value used came from the normal values of laboratory parameters. In the univariable analysis model, only the LDL-C and lipid ratio parameters (TC/HDL-C, LDL-C/HDL-C, non-HDL-C) have a significant association as risk factors for the occurrence of poor glycemic control (OR>1; p<0.05). However, through multivariable analysis found TC/HDL-C parameters (adjusted OR: 3.24; 95% CI: 1.58–18.14; p=0.018), LDL-C (adjusted OR: 3.14; 95% CI: 1.04–8.50; p=0.003) is a risk factor for the occurrence of poor glycemic control and the LDL-C/HDL-C parameter is the most influential risk factor in the occurrence of poor glycemic control (adjusted OR =38.76; 95% CI: 27.32–56.64; p<0.001). People with high LDL-C/HDL-C ratio have a risk of having poor glycemic control 38 times higher than patients who have a normal LDL-C/HDL-C ratio (Table 4).
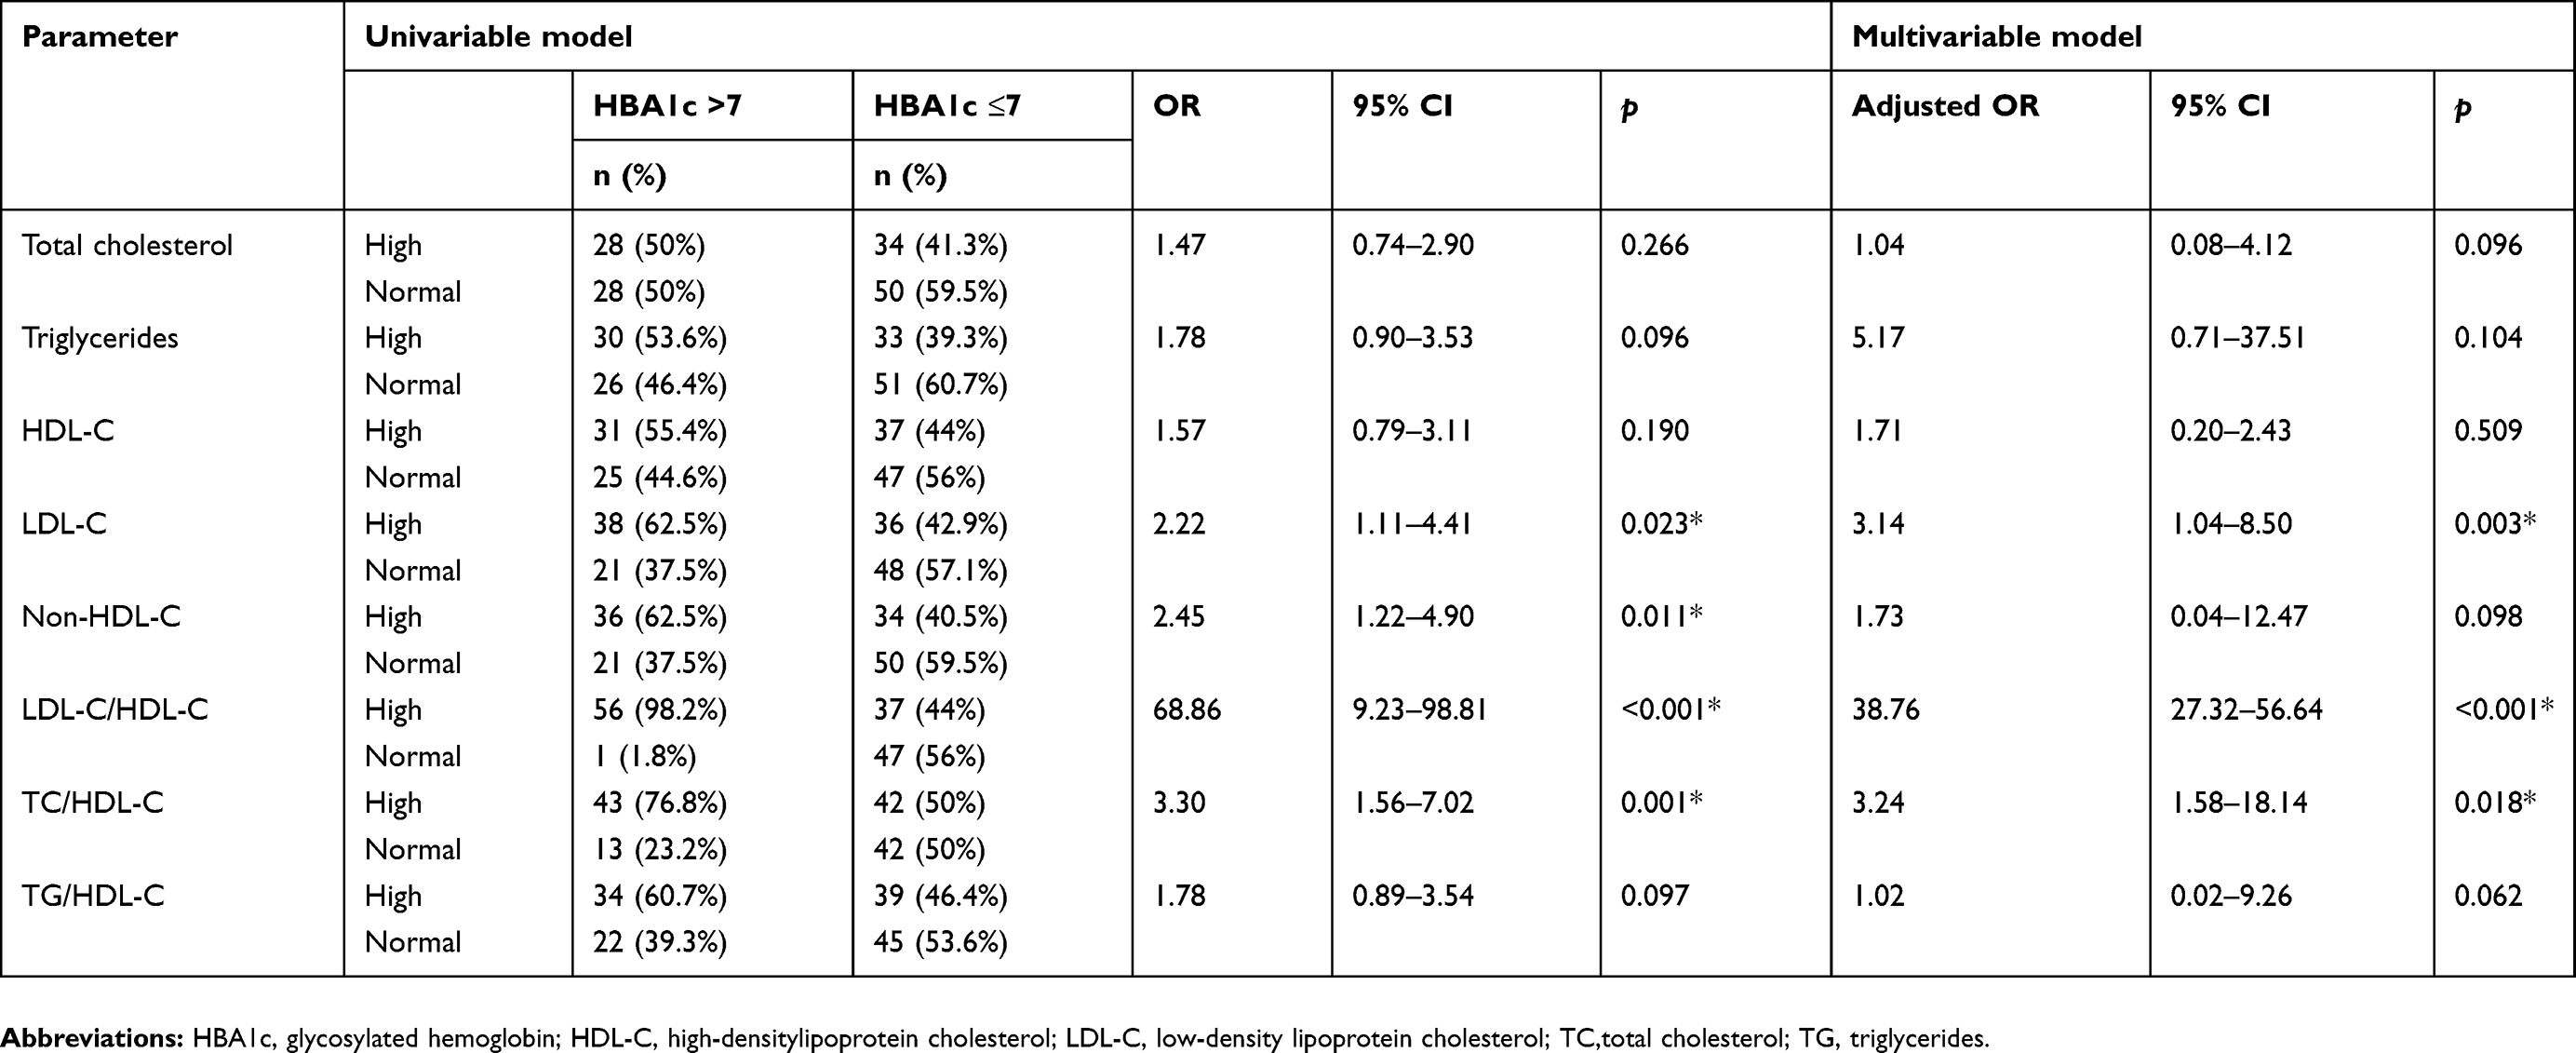 | Table 4 Risk analysis model of lipid profile and lipid ratio in for glycemic control in T2DM |
Discussion
Diabetes tends to be accompanied by unknown dyslipidemia. The condition of dyslipidemia is characterized by abnormalities of two or more parameters of the lipid profile.10 Based on recommendations from the American Diabetes Association, periodic serum lipids should be carried out in patients with diabetes as a screening method to determine the condition of dyslipidemia.13
In this study, a significantly higher lipid and lipid ratio profile and lower HDL-C in the group with poor glycemic control were found. Another study conducted by Khan et al14 investigating differences in lipid profile in 2,220 T2DM patients showed lipid profile parameters for TC (5.49±0.04 vs 5.16±0.03 mmol/L), TG (2.13±0.04 vs 1.88±0.02 mmol/L), HDL-C (1.1±0.01 vs 1.21±0.08 mmol/L), and LDL-C (3.34±0.02 vs 3.09±0.03 mmol/L), which is higher in patients with poor glycemic control compared to good glycemic control.
The existence of the dyslipidemia phenomenon in diabetes can be explained by changes in plasma lipoprotein that occur in patients with diabetes in fasting and post-prandial conditions modulated by defects from insulin action and hyperglycemia.15,16 In postprandial conditions fatty acids and cholesterol obtained from food products that are absorbed in intestines become one in the form of TG and cholesteryl esters which are then converted to chylomicrons.17,18 In adipocyte cells and muscle cells chylomicrons it is a substrate of lipoprotein which triggers lipolysis of TG and fatty acids. Insulin regulates lipoprotein activity at certain levels such as protein synthesis and gene expression. Lipoprotein is reduced when insulin resistance occurs in a diabetic condition which results in consequence of an increase in TG and a decrease in HDL-C.17–20
On the other hand, insulin resistance can independently cause abnormal lipid profiles because of the condition of hyperglycemia. A person with insulin resistance tends to have excessive production of very low-density lipoproteins (VLDL) and ApoC-III by the liver, and an increase in absorption of chylomicrons in the gastrointestinal tract.17,21,22 This will lead to prolonged postprandial lipemia which is a very common finding in persons with insulin resistance. Because VLDL and chylomicrons compete in the same place on the pathway mediated by lipoprotein to excrete TG from the circulation, the condition of postprandial hyperlipidemia causes a disruption of the VLDL and TG clearance.17,22 The presence of small and dense LDLs in insulin-resistant conditions is widely modulated by the action of cholesteryl-ester-transfer-protein (CETP), which mediates the exchange of VLDL or chylomicrons for LDL cholesteryl esters which will later produce small dense LDL.22–24
Another form of insulin resistance is a decrease in HDL and apA-I cholesterol, an increase in hydrolysis from TG, an increase in liver lipase, and an increase in the production of smaller HDL. The presence of smaller and denser HDL particles will tend to be cleaned more quickly in the liver compared to medium and large HDL, this will further contribute to the decrease of HDL cholesterol and apoA-1 as a component that reuptake of lipids in the endothelium.17,22
The research conducted by Mahato et al5 involving 294 T2DM patients in Kathmandu, Nepal, showed a significant positive correlation between TC (p=0.017), LDL-C (p=0.011), and LDL-C/HDL-C ratio (p=0.005) to the HBA1c level. Another study by Khan et al25 involving 1,011 T2DM patients showed a significant positive correlation between TC (r=0.127; p<0.001), TG (r=0.153; p<0.001), HDL (r=−0.128; p=0.002), and LDL (r=0.142; p=0.001). There were similar findings in this study, where lipid profiles and lipid ratios have a positive correlation and HDL-C has a negative correlation with the HBA1c level.
The study conducted by Suresh et al1 showed a higher prevalence of CAD in patients with poor glycemic control (HBA1c>9). These findings illustrate the association between diabetes and atherosclerotic plaque formation which illustrates good glycemic control, which can reduce the risk of diabetes-related cardiovascular complication.22 In conditions of hyperglycemia, there can be an increase in glycosylation and oxidation of LDL, endothelial dysfunction, increased coagulation pathways, and increased expression of adhesion molecules that trigger the formation of atherosclerotic plaques as cardiovascular complications of diabetes.6 This shows the importance of controlling the lipid and glycemic index as a method of preventing cardiovascular complications related to diabetes. Future health challenges will always be faced by health practitioners to always provide optimal services in glycemic control in patients with T2DM to prevent complications and reduce diabetes-related morbidity and mortality.10
The present study provides a different view of the role of lipid profiles and lipid ratios as a predictive marker for glycemic control, not only defining the correlation of lipid parameters, but also providing a cutoff value of lipid ratio that might be a new valuable ratio in lipid management in person with T2DM.
The limitations of this study are the absence of data regarding dietary consumption, physical activity, and complications associated with diabetes that cannot be fully studied, so there is likely to be a bias that could affect glycemic control in T2DM. Moreover, the current study is only a retrospective study that has a less causal relationship than a cohort study.
Conclusion
Lipid profiles (LDL-C) and lipid ratios (LDL-C/HDL-C & TC/HDL-C ratio) show potential markers that can be used in predicting glycemic control in patients with T2DM. Higher lipid profile parameters (TC, LDL-C) and higher lipid ratios (TC/HDL-C, TG/HDL-C, LDL-C/HDL-C ratio), and lower HDL-C in were found mostly in the group with poor glycemic control. Further research on a large scale is needed before using these parameters for predicting glycemic control in clinical settings.
Ethical aspect
The current study has been approved by the Ethical Committee Faculty of Medicine, Udayana University/Sanglah General Hospital with reference number 2357/UN14.2.2.VII.14/LP/2019. We carried out this study according to the Declaration of Helsinki. All patients signed written informed consent regarding access to their medical record data prior to data collection.
Acknowledgments
The current study did not receive any specific grants from government or private sectors. During the time of the study Agha Bhargah was the assistant researcher at the Department of Cardiology and Vascular Medicine, Faculty of Medicine, Udayana University, Sanglah General Hospital, Denpasar, Bali, Indonesia
Disclosure
The authors declare there are no conflicts of interest regarding all elements in this study.
References
1. Suresh K, Sandhya AM. A study on glycemic, lipid and blood pressure control among type 2 diabetes patients of north Kerala, India. Indian Heart J. 2018;70:482–485. doi:10.1016/j.ihj.2017.10.007
2. Maratni NPT, Sindhughosa DA, Mardewi IGA, Manuaba IBAP, Saraswati MR. Individual lipids and lipid ratio in type-2 diabetic patients: association with glycemic control status. Recent Adv Biol Med. 2017;3:42–47. doi:10.18639/RABM.2017.03.455029
3. Ginsberg HN, Elam MB, Lovato LC, et al. ACCORD study group. Effects of combination lipid therapy in type 2 diabetes mellitus. N Engl J Med. 2010;362(17):1563–1574. doi:10.1056/NEJMoa1001282
4. Rosediani M, Azidah AK, Mafauzy M. Correlation between fasting plasma glucose, post prandial glucoseand glycated haemoglobin and fructosamine. Med J Malaysia. 2006;61:67–71.
5. Mahato RV, Gyawali P, Raut PP, Regmi P, Singh KP, Gyawali P. Association between glycemic control and serum lipid profile in type 2 diabetes patients: glycated haemoglobin as a dual biomarkers. Biomed Res. 2011;22(3):375–380.
6. Jaiswal M, Schinske A, Busui RP. Lipids and lipid management in diabetes. Best Pract Res Clin Endocrinol Metab. 2014;28(3):325–328. doi:10.1016/j.beem.2013.12.001
7. Awadalla H, Noor SK, Elmadhoun WM, et al. Comparison of serum lipid profile in type 2 diabetes with and without adequate diabetes control in Sudanese population in north Sudah. Diabetes Metab Syndr. 2018;12(6):961–964. doi:10.1016/j.dsx.2018.06.004
8. Catapano AL, Graham L, Backer GD, et al. ESC/EAS guidelines for the management of dyslipidaemias. Eur Heart J. 2016;2016(37):2999–3058. doi:10.1093/eurheartj/ehw272
9. Katz LEL, Bacha F, Gidding SS, et al. Lipid profiles, inflammatory markers, and insulin therapy in youth with type 2 diabetes. J Pediatr. 2018;196:208–216. doi:10.1016/j.jpeds.2017.12.052
10. Noor SK, Elmadhoun WM, Bushara SO, Almobarak AO, Salim RS, Forawi SA. Glycemic control in Sudanese individuals with type 2 diabetes: population based study. Diabetes Metab Syndr. 2017;11:S147–S151. doi:10.1016/j.dsx.2016.12.024
11. Lin D, Qi Y, Huang C, et al. Association of lipid parameters with insulin resistance and diabetes: a population-based study. Clin Nutr. 2018;37:1423–1429. doi:10.1016/j.clnu.2017.06.018
12. Longo-Mbenza B, Mvindu HN, Jbk O, et al. The deleterious effects of physical inactivity on elements of insulin resistance and metabolic syndrome in Central Africans at high cardiovascular risk. Diabetes Metab Syndr. 2011;5:1–6. doi:10.1016/j.dsx.2010.05.001
13.
14. Khan AH. Clinical significance of HBA1c as marker of circulating lipids in male and female type 2 diabetic patients. Acta Diabetol. 2007;44:193–200. doi:10.1007/s00592-007-0003-x
15. Turner RC, Millns H, Neil HAW;
16. Dixon JL, Stoops JD, Parker JL, et al. Dyslipidemia and vascular dysfunction in diabetic pigs fed an atherogenic diet. Arterioscler Thromb Vasc Biol. 1999;19(12):298192. doi:10.1161/01.ATV.19.12.2981
17. Reaven P, Merat S, Casanada F, et al. Effect of streptozotocin-induced hyperglycemia on lipid profiles, formation of advanced glycation endproducts in lesions, and extent of atherosclerosis in LDL receptor-deficient mice. Arterioscler Thromb Vasc Biol. 1997;17(10):2250–2256. doi:10.1161/01.ATV.17.10.2250
18. Fox CS, Coady S, Sorlie PD, et al. Increasing cardiovascular disease burden due to diabetes mellitus: the framingham heart study. Circulation. 2007;115:1544–1550. doi:10.1161/CIRCULATIONAHA.106.658948
19. Deedwania P, Barter P, Carmena R, et al. Treating to new targets investigators. Reduction of low-density lipoprotein cholesterol in patients with coronary heart disease and metabolic syndrome: analysis of the treating to new targets study. Lancet. 2006;368:919–928. doi:10.1016/S0140-6736(06)69292-1
20. Aguilar D, Fisher MR, O’Connor CM, et al. Investigators in the weekly intervention with zithromax for atherosclerosis and its related disorder study. Metabolic syndrome, C-reactive protein, and prognosis in patients with established coronary artery disease. Am Heart J. 2006;152(2):298–304. doi:10.1016/j.ahj.2005.11.011
21. Unnikrishnan R, Anjana RM, Deepa M, et al. Glycemic control among individuals with self reported diabetes in India-The ICMR-INDIAB study. Diabetes Technol Ther. 2014;16:596–603. doi:10.1089/dia.2014.0018
22. Kisa K, Tojo T, Hatakeyama Y, Kameda R, Hashikata T, Yamaoka-Tojo M. Postprandial hyperglycemia and endothelial function in type 2 diabetes: focus on mitiglinide. Cardiovasc Diabetol. 2012;11(1):79. doi:10.1186/1475-2840-11-79
23. Gregg EW, Li Y, Wang J, et al. Changes in diabetes-related complications in the United States. N Engl J Med. 2014;370:1514–1523. doi:10.1056/NEJMoa1310799
24. Regmi P, Gyawali P, Shrestha R, Sigdel M, Mehta KD, Majhi S. Pattern of dyslipidemia in type 2 diabetic subjects in Eastern Nepal. Jnamls. 2009;10:11–13.
25. Khan AH, Sobki SH, Khan SA. Association between glycemic control and serum lipids profile in type 2 diabetic patients: HBA1c predict dyslipidaemia. Clin Exp Med. 2007;7:24–29. doi:10.1007/s10238-007-0121-3
 © 2019 The Author(s). This work is published and licensed by Dove Medical Press Limited. The
full terms of this license are available at https://www.dovepress.com/terms
and incorporate the Creative Commons Attribution
- Non Commercial (unported, 3.0) License.
By accessing the work you hereby accept the Terms. Non-commercial uses of the work are permitted
without any further permission from Dove Medical Press Limited, provided the work is properly
attributed. For permission for commercial use of this work, please see paragraphs 4.2 and 5 of our Terms.
© 2019 The Author(s). This work is published and licensed by Dove Medical Press Limited. The
full terms of this license are available at https://www.dovepress.com/terms
and incorporate the Creative Commons Attribution
- Non Commercial (unported, 3.0) License.
By accessing the work you hereby accept the Terms. Non-commercial uses of the work are permitted
without any further permission from Dove Medical Press Limited, provided the work is properly
attributed. For permission for commercial use of this work, please see paragraphs 4.2 and 5 of our Terms.