Back to Journals » Clinical Pharmacology: Advances and Applications » Volume 7
Heparin requirements for full anticoagulation are higher for patients on dabigatran than for those on warfarin – a model-based study
Authors Edrich T, Frendl G, Michaud G, Paschalidis I
Received 3 August 2014
Accepted for publication 11 October 2014
Published 5 February 2015 Volume 2015:7 Pages 19—27
DOI https://doi.org/10.2147/CPAA.S72185
Checked for plagiarism Yes
Review by Single anonymous peer review
Peer reviewer comments 3
Editor who approved publication: Professor Arthur E. Frankel
Thomas Edrich,1,2 Gyorgy Frendl,2 Gregory Michaud,3 Ioannis Ch Paschalidis4
1Department of Anesthesiology, Perioperative Medicine and General Intensive Care Medicine, Salzburg General Hospital and Paracelsus Private Medical University, Salzburg, Austria, 2Department of Anesthesiology, Perioperative and Pain Medicine, 3Department of Medicine, Division of Cardiology, Brigham and Women's Hospital, Harvard Medical School, 4Department of Electrical and Computer Engineering, Division of Systems Engineering, Boston University, Boston, MA, USA
Purpose: Dabigatran (D) is increasingly used for chronic anticoagulation in place of warfarin (W). These patients may present for catheter-based procedures requiring full anticoagulation with heparin. This study compares the heparin sensitivity of patients previously on dabigatran, on warfarin, or on no chronic anticoagulant during ablation of atrial fibrillation.
Patients and methods: In a retrospective study of patients treated with D, W, or neither drug (N) undergoing atrial ablation, the timing of heparin doses and resulting activated clotting times were collected. First, the initial activated clotting time response to the first heparin bolus was compared. Then, a non-linear mixed effects modelling (NONMEM) analysis was performed, fitting a pharmacokinetic and -dynamic model to the entire anticoagulation course of each patient. Resulting model coefficients were used to compare the different patient groups.
Results: Data for 66 patients on dabigatran, 95 patients on warfarin, and 27 patients on no anticoagulation were retrieved. The last dose of dabigatran or warfarin had occurred 27 hours and 15 hours before the procedure. Groups D and N both responded significantly less (P<0.05) to the initial heparin bolus than Group W (approximately 50%). Likewise, the model coefficients resulting from the fit to each group reflected a significantly lower heparin sensitivity in groups D and N compared to W. Clearances of the heparin effect in the model did not differ significantly among groups.
Conclusion: Patients on warfarin with an average INR of 1.5 or higher are more sensitive to heparin than patients not previously anticoagulated or patients who discontinued dabigatran 27 hours earlier (approximately two half-lives) warfarin.
Keywords: atrial fibrillation, electrophysiology, NONMEM, PKPD model
Introduction
Dabigatran is a new oral direct thrombin inhibitor that is increasingly used for chronic anticoagulation in place of warfarin which inhibits the hepatic production of vitamin K-dependent factors. In patients with normal renal function, dose adjustment and routine monitoring of anticoagulation effect is not recommended.1 Patients on dabigatran now present for invasive catheter-based procedures requiring full anticoagulation with heparin. Heparin augments the action of antithrombin on thrombin. However, the interaction between the heparin effect and the effect of residual dabigatran is not well established. The appropriate timing for the last pre-procedural dose of dabigatran while balancing the risk of bleeding vs thrombosis have been debated recently with recommendations ranging from 12 hours to 36 hours.2,3 During catheter-based ablation of atrial fibrillation, anesthesiologists and cardiologists collaborate to estimate and administrate heparin to achieve an appropriate level of anticoagulation. Monitoring of the heparin effect is frequently performed using the activated clotting time (ACT) due to its ease of use and bedside availability. Dosing and the monitoring intervals to ensure adequate anticoagulation are often guided by clinical experience. However, little data and experience exist to guide heparin dosing for patients who have been taking dabigatran. The objective of this investigation is to quantify and compare the heparin sensitivity of patients who have been on dabigatran, warfarin, or no anticoagulant prior to catheter-based ablation of atrial fibrillation.
Material and methods
This retrospective, chart-review study, was approved by the institutional review board (IRB) of Brigham and Women’s Hospital. The requirement for written informed consent was waived. All patients who presented to Brigham and Women’s Hospital with atrial fibrillation for catheter-based atrial ablation from January 2011 to June 2012 and who had been on dabigatran (Group D) were identified. A random sample of patients having the same procedure who were on warfarin (Group W) or no anticoagulant (Group N) and who were evenly distributed throughout the same time period were identified. Group W was further subdivided into patients who presented within the last 3 days with an INR ≥2.0 (Whigh) or with an unintentionally low INR <2 (Wlow). Data pertaining to heparin dosing and ACT were collected along with bleeding or thrombotic complications using the electronic medical records. All ACT values had been determined with the Hemochron Signature Elite® whole blood microcoagulation system with the Hemochron Jr® Cartridge (International Technidyne Corporation, Edison, NJ) which has a measurement range of 0–400 seconds. Two methods were employed to analyze the response of the patients to heparin.
Firstly, the ACT response due to the first heparin bolus was assessed, obtaining a ratio of weight-based heparin to ACT increase for all patients. When no pre-heparin ACT was available, the median for that patient group was substituted. The response to heparin was compared among the groups Wlow, Whigh, D, and N using the Kruskal–Wallis test with multiple comparisons (using Bonferroni adjustment) as implemented using MATLAB® (The MathWorks, Natick, MA). For all comparisons, a significance level of P<0.05 was used.
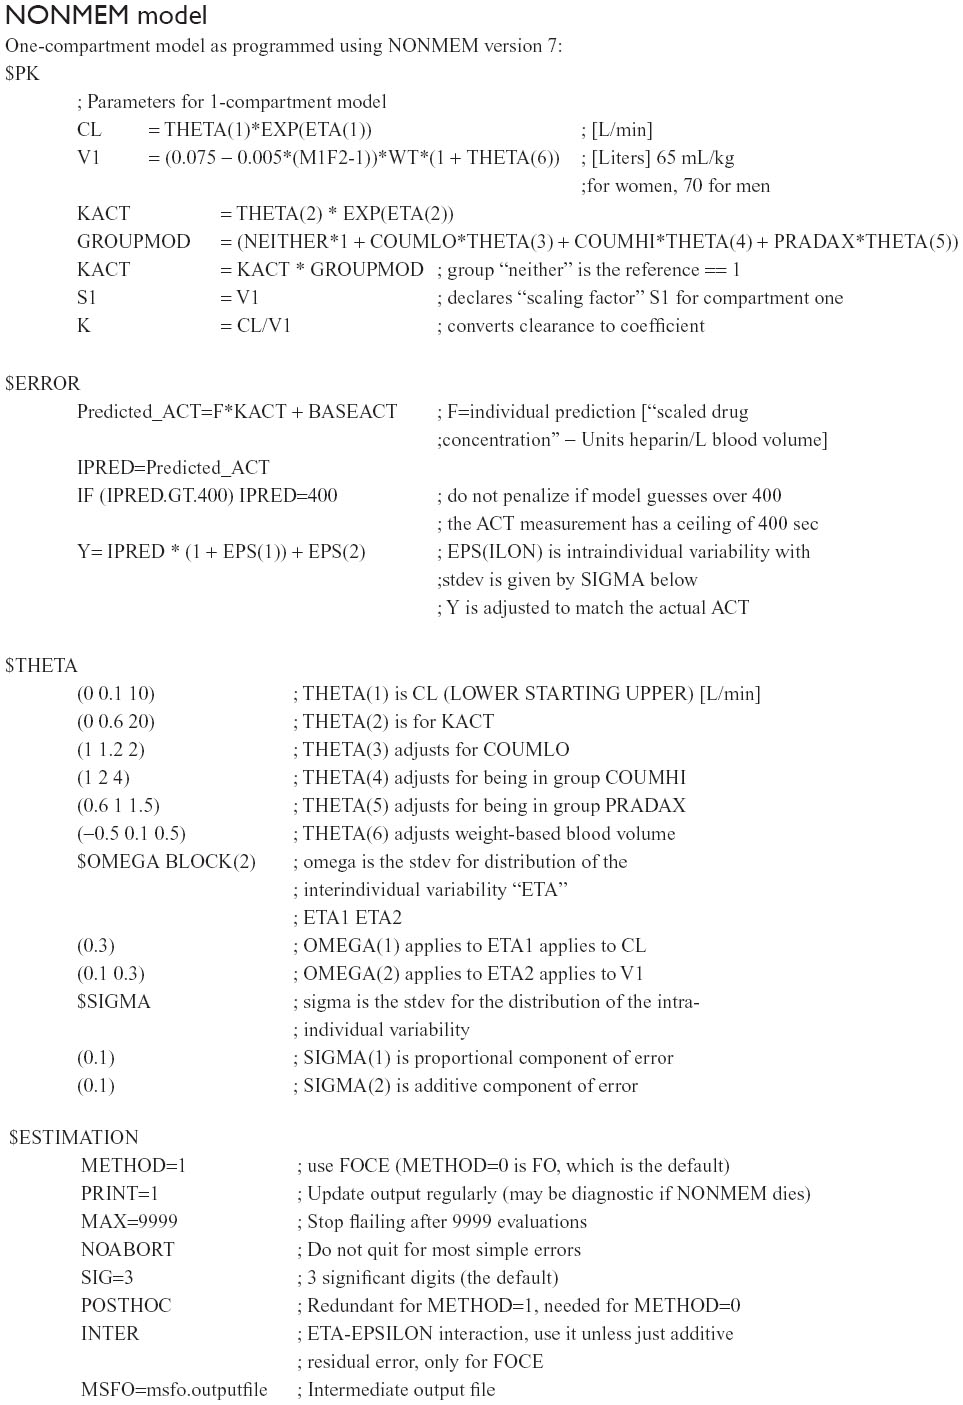
Secondly, one- and two-compartment pharmacokinetic and -dynamic (PKPD) models were fitted to the patient data using NONMEM7® (ICON Development Solutions, Ellicott City, MD) in conjunction with PLTTools (PLTsoft, San Francisco, CA). All patient data from the time point of the first heparin dose or ACT measurement to the end of the case with administration of protamine was used. The pharmacokinetic fit was realized using the solvers, ADVAN1 and ADVAN3, which are dedicated to linear one- and two-compartment modeling. The pharmacodynamic component of these models consisted of a simple multiplicative factor, kACT, which instantaneously translates the modeled serum concentration of heparin to the corresponding ACT (see Figure 1 for a schematic of the one-compartment model and a sample fit). Since only input heparin doses and the resulting ACTs were known without measurement of true heparin serum levels, the PKPD portions of the model cannot be separated; the model simply estimates ACTs resulting from heparin doses. Knowledge of the actual heparin level in the serum is not required for this model. For the one-compartment model, the volume of distribution was assumed to be the estimated blood volume (70 mL/kg for males, 65 mL/kg for females). For the two-compartment model, the volumes of the compartments have no anatomic correlates and were allowed to vary freely. The overall goodness of fit was assessed by the “objective function” provided by NONMEM (this is –2 times the log of the sum of squares of the error). The influence of the group variable (ie, belonging to groups Wlow, Whigh, D, or N) on the coefficients kACT and the clearance from the first (or only) compartment, CL, were investigated for significant differences using analysis of variance (ANOVA) analysis. The improvement in model performance after integrating the group variable as a multiplicative factor of kACT was compared using the objective function and root-mean squared error between the actual and predicted ACT values. When actual individual ACT measurements were above the measurable range (400 seconds), the model was only penalized if it predicted an ACT <400 as shown in Supplementary material. When both the actual and predicted ACTs were >400, an error of zero was assumed. This enabled optimal fit to the values <400 without truncating the values >400.
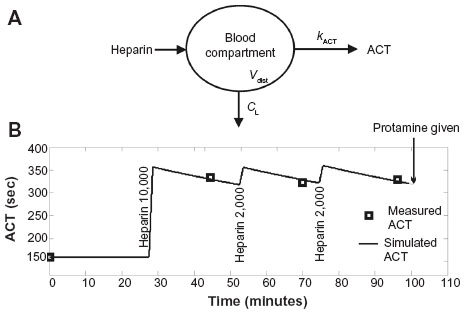 | Figure 1 Schematic of the one-compartment PKPD model in panel (A). |
Results
Data for 66 patients on dabigatran, 95 patients on warfarin (53 of these presenting with an INR >2.0), and 27 patients on no anticoagulant were retrieved electronically for the time period from January 2011 to June 2012. Baseline demographic data including age, sex, weight, and significant comorbidities are listed in Table 1.
 | Table 1 Baseline demographics and clinical parameters |
The average last pre-procedural INR of groups D, Wlow, Whigh, and N were 1.2, 1.8, 2.3, and 1.0, respectively, with Wlow and Whigh, significantly higher than D and N.
Pre-heparin ACT values were available for 79%, 79%, 78%, and 67% in groups D, Wlow, Whigh, and N, respectively, with medians and interquartile ranges (IQR) of 155 (145–163) seconds, 169 (162–185) seconds, 182 (172–195) seconds, and 144 (136–155) seconds. Groups Wlow and Whigh had significantly higher pre-heparin ACT values than both D and N as assessed by ANOVA analysis.
The last dose of dabigatran or warfarin occurred 27 (24–31) hours, 15 (14–17.4) hours, and 15 (14–19) hours before the procedure, respectively, in groups D, Wlow, and Whigh (median and IQR).
After the first heparin bolus, the subsequent ACT was drawn at a median of 31 minutes later (23–42 minutes IQR). There was no significant difference in timing of this ACT among patient groups when analyzed together or separately by group or sex. The ratio of the ACT response to the first heparin bolus was calculated for all patients together and also compared separately by sex and is shown in Table 2 and Figure 2. Kruskal–Wallis testing revealed that groups Wlow and Whigh were significantly more sensitive than groups D and N to the first heparin bolus. This effect persisted when comparing separately by sex. Only one response differed significantly according to sex: the 47 males receiving dabigatran were more sensitive to heparin than the corresponding 19 females (P<0.05).
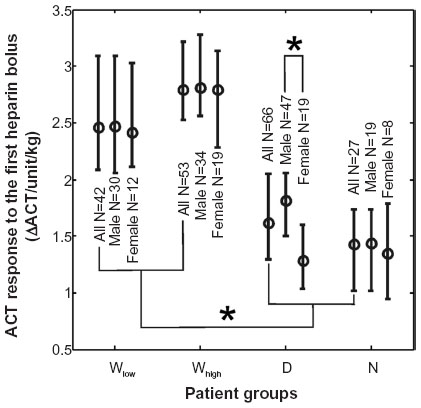 | Figure 2 Response of the activated clotting time (ΔACT) to the initial heparin bolus analyzed for patients on warfarin (Wlow and Whigh), on dabigatran (D), or no anticoagulant (N) shown as medians with interquartile ranges. |
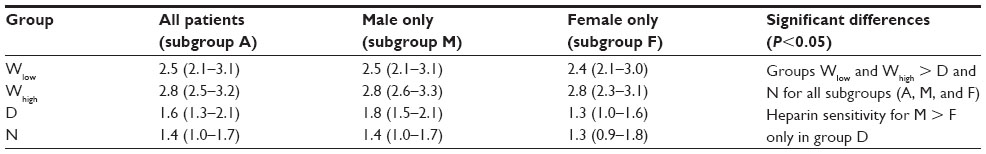 | Table 2 The sensitivity of ACT to the first heparin bolus given as ACT change per unit of heparin per body weight (ΔACT/units/kg) |
Frequently, the first post-heparin ACT was >400 seconds (beyond the measurement limit of the instrument). This was the case in 69%, 77%, 24%, and 7% in groups Wlow, Whigh, D, and N, respectively. This was similar for the subgroups of male or female patients. However, when repeating the above analysis for only those patients whose post-heparin ACT remained in the measurable range, the heparin sensitivity of both groups Whigh and Wlow was still significantly greater than for groups D and N.
Next, the one- and two-compartment PKPD models were fitted to the data from each patient including the group variable as a multiplicative factor modifying kACT. Each patient had a median of three heparin boluses and six ACT values per case. There were no heparin infusions. See Supplementary material for details pertaining to the one-compartment NONMEM model. A wide range of initial values for all parameters was searched to account for the known high inter-individual variability of response to heparin.4 Since the goodness of fit was found to be better with the one-compartment model than with the two-compartment model (objective function was 10,372 vs 10,424) further analysis was performed only with the one-compartment model.
Comparison of groups by Kruskal–Wallis ANOVA demonstrated that group Whigh had a significantly greater kACT than group Wlow which was significantly greater than both D and N as shown in Table 3 and Figure 3. Groups D and N did not differ significantly. The only significant sex-based differences were in group D: the 47 males on dabigatran had a higher median kACT than the 19 females on dabigatran (0.14 vs 0.12 s × L/units). There was no significant difference in any parameter based on race. The clearances for groups Wlow, Whigh, D, and N were 22.4 (19.1–23.5) mL/min, 22.1 (21.3–27) mL/min, 26.5 (19.2–33.9) mL/min, and 23.4 (15.8–29.1) mL/min, respectively (median and IQR). They did not differ significantly among groups. Given the individual patients’ weights and volumes of distribution, the corresponding half-lives of the effect of heparin on the ACT ranged from 154 minutes to 180 minutes.
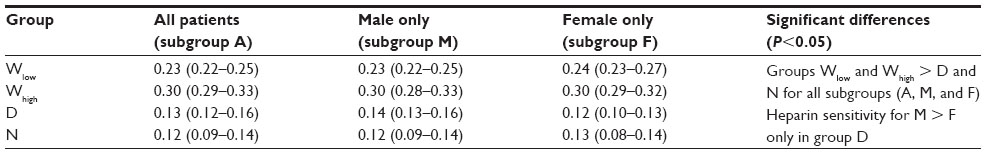 | Table 3 The change in the pharmacodynamic model parameter kACT (reflecting heparin sensitivity) for groups Wlow, Whigh, D, and N given as medians with interquartile ranges |
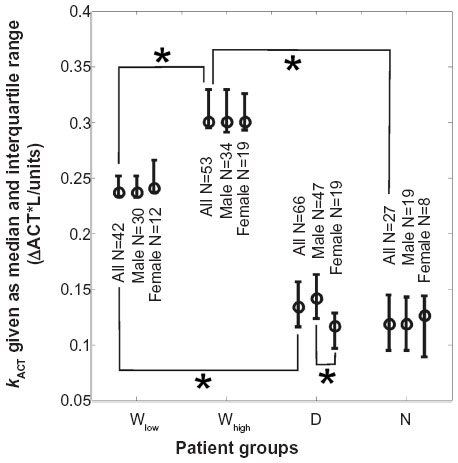 | Figure 3 The PKPD model coefficient indicating sensitivity to heparin, kACT, for groups Wlow, Whigh, D, and N shown as medians with interquartile ranges. |
In the post-hoc analysis of the deviation between the individual and the global model, there were significant differences among groups in the variable kACT only, not the clearance CL. However, after adjusting kACT using a multiplicative group variable (see Supplementary material), the resulting inter-individual variability between global and the individual kACT (“EXP(ETA(2))” in the $PK block) became similar in all groups with no significant differences. Including the group variable to modify kACT improved the objective function from 10,574 to 10,372. The root-mean square (RMS) error improved from 68.6 to 51.1 ACT-seconds which is from 20.5% to 15.3% of the average ACT, respectively.
There were no major complications in the studied patients. There were no significant differences in minor complications such as bleeding at the puncture site and local hematoma as shown in Table 4.
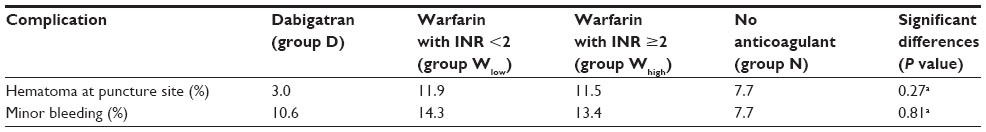 | Table 4 Complications after catheter-based ablation of atrial fibrillation |
Discussion
In this study, patients undergoing atrial ablation were found to have significantly differing responses to heparin boluses depending on whether they had previously been on warfarin (groups Wlow and Whigh), dabigatran (D), or no chronic anticoagulation (N). This differing heparin sensitivity was demonstrated using two methods.
Firstly, in a direct comparison of the response to the initial large heparin bolus administered at the beginning of the procedure, groups Wlow and Whigh were found to be significantly more sensitive to heparin than groups D and N. Several limitations must be taken into account: since the heparin dosing had not been standardized, a ratio of ACT response to weight-based heparin dose was used for this comparison with the assumption that there is a linear relationship between heparin dose and ACT change for the range of heparin doses that were administered. In addition, the point-of-care instrument for measurement of ACTs had a technical measurement ceiling of 400 seconds. Given the significantly higher baseline ACTs for the warfarin patients and the greater sensitivity to heparin, a significantly higher portion of the patients on warfarin had a post-heparin ACT in the unmeasurable range >400 seconds. Thus, it is likely that the true ACT responses were underestimated in the patients on warfarin. However, as demonstrated in Figure 2 and Table 2, even this presumably underestimated ACT response for groups Wlow or Whigh was still significantly greater than the responses of groups D and N, thus strongly supporting the thesis that the patients on warfarin were more sensitive to heparin (regarding ACT elevation). In further support of this thesis we found that when repeating the above analysis with the subgroup of patients who did not have a post-heparin ACT over 400 seconds, similar results were obtained.
The second method of fitting a PKPD model to the entire anticoagulation course of each patient and comparing the resulting model coefficients was prompted by the clinical observation that patients on dabigatran and no anticoagulant require more substantial redosing of heparin than patients who had been on warfarin even after the initial dose of heparin. However, a direct comparison using these subsequent heparin doses was not possible because the heparin dosing intervals were not uniform in all patients in this retrospective data and the level of anticoagulation achieved also varied. As an alternative, a sufficiently well-fitted PKPD model would allow for comparisons between groups by analyzing the resulting model coefficients.
Several complex PKPD models have been reported incorporating linear and non-linear elimination and pharmacodynamic structures.5–7 However, such models require enough data to identify multiple internal parameters and can introduce redundancy with multiple optimal parameter values. Given the limited number of data values per patient, the choice was made to fit only a one- or two-compartment model with parameters that could be fitted reliably to the data. A more complex model would have required more data for each patient and would have eliminated patients with fewer data points. Given the good visual fit to the data and the low RMS errors between the actual and the model-simulated ACTs (15% in relation to the average ACT) the one-compartment model was chosen for analysis.
In this model, the coefficient, kACT, which describes the heparin sensitivity, was found to be significantly increased (approximately doubled) in groups Wlow and Whigh compared to D and N with no significant difference between D and N as shown in Figure 3. This finding is consistent with the earlier analysis using only the initial heparin bolus.
At the same time, the average clearance of the heparin effect on the ACT in the model was found to lie in the narrow range of 22.4–26.5 mL/min for each group and was not significantly different among the patient groups. The corresponding half-lives of the heparin effect (154–180 minutes) is high but may reflect the predominance of a slower non-saturable elimination mechanism when administering high heparin doses or a slow clearance of heparin-bound binding sites as suggested in previous studies.5,8
Both methods indicated that males on dabigatran were more sensitive to heparin than females (by a factor of 1.4 in Table 2 and 1.2 in Table 3). This was the only sex-based difference found. However, due to the disproportionately small number of females in this study, any sex-based comparisons of heparin sensitivity are limited.
In this study, the last dose of dabigatran was approximately 27 hours before the procedure (approximately two half-lives), while patients on warfarin took their evening dose (15 hours prior). This timing for the last dose of dabigatran has been adopted by many institutions because of concerns for bleeding when stopping the medication later,2,9 thus limiting the generalization of our results to other settings with other timing. Another potential limitation of this study lies in the relatively lower number of patients without prior anticoagulation (Group N) compared to groups D, Wlow, and Whigh. However, the variability of the heparin response within Group N was still small enough to allow for the detection of significant differences compared to the heparin responses of groups D, Wlow, and Whigh.
Only one other study also comparing heparin requirements for patients on chronic warfarin or dabigatran is know to the authors. This study found a similar increase in heparin requirement in the patients on dabigatran compared to warfarin (58%). However, there was no control group (patients on no chronic anticoagulants) and the authors discussed a possible “negative” effect of dabigatran, ie, a dabigatran-induced mechanism causing a diminished effect of heparin.10 Our study demonstrated no significant difference between the control arm and the dabigatran patients, thus finding no evidence of a “re-bound hypercoagulopathy” after stopping dabigatran.
Conclusion
Using techniques including population PKPD modeling, we found that patients recently on dabigatran require more heparin for full anticoagulation than patients on warfarin. In addition, there was no significant difference between the heparin requirements for patients on dabigatran compared to patients on no chronic anticoagulant. Thus, withholding dabigatran for approximately two half-lives leads to similar heparin sensitivity as in patients without antecedent anticoagulation. Care must be taken to administer enough heparin to these patients to assure adequate anticoagulation before instrumentation for atrial ablation. Given the limited number of available patients on dabigatran due to its recent introduction into clinical practice, the results of this study should be verified by a larger and preferably controlled prospective observational trial.
Acknowledgments
This work was supported by the STAR (Surgical ICU TrAnslational Research) Center at Brigham and Women’s Hospital. We wish to thank Ian Shempp, BS, and Michael Kapottos, BA, for their management of the study process.
Author contributions
Thomas Edrich has collected the original study data, performed the analysis of the data, written and approved the final manuscript, and is the author responsible for archiving the study files. Gyorgy Frendl has seen the original study data, reviewed the analysis of the data, and approved the final manuscript. Gregory Michaud has seen the original study data, reviewed the analysis of the data, and approved the final manuscript. Ioannis Paschalidis has seen the original study data, reviewed the analysis of the data, and approved the final manuscript. All authors agree to be accountable for all aspects of the work in ensuring that questions relating to the accuracy or integrity of any part of the work are appropriately investigated and resolved.
Disclosure
The authors have no financial interest or other conflicts of interest in this work.
References
Boehringer Ingelheim Pharmaceuticals, Inc. Dabigatran [package insert]. Ridgefield, CT: Boehringer Ingelheim Pharmaceuticals, Inc.; 2012. | |
Lakkireddy D, Reddy YM, Di Biase L, et al. Feasibility and safety of dabigatran versus warfarin for periprocedural anticoagulation in patients undergoing radiofrequency ablation for atrial fibrillation: results from a multicenter prospective registry. J Am Coll Cardiol. 2012;59(13):1168–1174. | |
Winkle RA, Mead RH, Engel G, Kong MH, Patrawala RA. The use of dabigatran immediately after atrial fibrillation ablation. J Cardiovasc Electrophysiol. 2012;23(3):264–268. | |
McAvoy TJ. The biologic half-life of heparin. Clin Pharmacol Ther. 1979;25(3):372–379. | |
Wachsman M, Mielke CH Jr, Hayes JA, Baker D. The use of time step simulations and difference equations (TSSADEQ) in modeling heparin pharmacokinetics. J Clin Pharmacol. 2000;40(10):1121–1128. | |
Brunet P, Simon N, Opris A, et al. Pharmacodynamics of unfractionated heparin during and after a hemodialysis session. Am J Kidney Dis. 2008;51(5):789–795. | |
Cannon CP, Dingemanse J, Kleinbloesem CH, Jannett T, Curry KM, Valcke CP. Automated heparin-delivery system to control activated partial thromboplastin time: evaluation in normal volunteers. Circulation. 1999;99(6):751–756. | |
Boneu B, Caranobe C, Sie P. Pharmacokinetics of heparin and low molecular weight heparin. Baillieres Clin Haematol. 1990;3(3):531–544. | |
Kim JS, She F, Jongnarangsin K, et al. Dabigatran vs warfarin for radiofrequency catheter ablation of atrial fibrillation. Heart Rhythm. 2013;10(4):483–489. | |
Konduru SV, Cheema AA, Jones P, Li Y, Ramza B, Wimmer AP. Differences in intraprocedural ACTs with standardized heparin dosing during catheter ablation for atrial fibrillation in patients treated with dabigatran vs patients on uninterrupted warfarin. J Interv Card Electrophysiol. 2012;35(3):277–284; [discussion 284]. |
Supplementary material
 © 2015 The Author(s). This work is published and licensed by Dove Medical Press Limited. The
full terms of this license are available at https://www.dovepress.com/terms
and incorporate the Creative Commons Attribution
- Non Commercial (unported, 3.0) License.
By accessing the work you hereby accept the Terms. Non-commercial uses of the work are permitted
without any further permission from Dove Medical Press Limited, provided the work is properly
attributed. For permission for commercial use of this work, please see paragraphs 4.2 and 5 of our Terms.
© 2015 The Author(s). This work is published and licensed by Dove Medical Press Limited. The
full terms of this license are available at https://www.dovepress.com/terms
and incorporate the Creative Commons Attribution
- Non Commercial (unported, 3.0) License.
By accessing the work you hereby accept the Terms. Non-commercial uses of the work are permitted
without any further permission from Dove Medical Press Limited, provided the work is properly
attributed. For permission for commercial use of this work, please see paragraphs 4.2 and 5 of our Terms.