Back to Journals » Clinical Ophthalmology » Volume 8
Fundus autofluorescence features in the inflammatory maculopathies
Authors Lee CS ![]() , Lee A, Forooghian F, Bergstrom C, Yan J, Yeh S
, Lee A, Forooghian F, Bergstrom C, Yan J, Yeh S
Received 27 May 2014
Accepted for publication 19 June 2014
Published 29 September 2014 Volume 2014:8 Pages 2001—2012
DOI https://doi.org/10.2147/OPTH.S68446
Checked for plagiarism Yes
Review by Single anonymous peer review
Peer reviewer comments 4
Cecilia S Lee,1 Aaron Y Lee,2 Farzin Forooghian,3 Chris S Bergstrom,1 Jiong Yan,1 Steven Yeh1
1Section of Vitreoretinal Disease and Surgery, Department of Ophthalmology, Emory Eye Center, Emory University, Atlanta, GA, USA; 2Department of Ophthalmology and Visual Sciences, Washington University in St Louis, St Louis, MO, USA; 3Department of Ophthalmology and Visual Sciences, University of British Columbia, Vancouver, BC, Canada
Purpose: To describe the fundus autofluorescence (FAF) features of the inflammatory maculopathies and develop a quantification method for FAF analysis.
Methods: This is a retrospective, consecutive case series of patients with inflammatory maculopathies from two tertiary centers. The clinical findings, demographics, and FAF imaging characteristics were reviewed. Foveal autofluorescence (AF) was analyzed. Median and standard deviation (SD) of foveal AF intensity were measured.
Results: Thirty eyes of 15 patients were evaluated with both qualitative and quantitative FAF analysis. In acute macular neuroretinopathy, the active phase showed foveal hypoautofluorescence, which became hypoautofluorescent with resolution. In acute posterior multifocal placoid pigment epitheliopathy, multiple lesions with hypoautofluorescent centers with hyperautofluorescent borders were observed in active disease and became hypoautofluorescent with disease convalescence. In multifocal choroiditis and punctate inner choroiditis, the active hyperautofluorescent lesions progressed to inactive, hypoautofluorescent scars. Active serpiginous choroiditis showed hyperautofluorescent borders adjacent to a helicoid-shaped, hypoautofluorescent scar. Active unilateral acute idiopathic maculopathy (UAIM) showed a complex pattern of hypo- and hyperautoflourescence in the macula. The median foveal AF was the greatest in acute macular neuroretinopathy and UAIM among the maculopathies, while the greatest SD of foveal AF intensity was observed in UAIM.
Conclusion: The active phase of the majority of inflammatory maculopathies was characterized by hyperautofluorescent lesions. Increased SD of foveal AF correlated with a mixture of hypo- and hyperautoflourescence. Median and SD may be useful metrics in foveal AF and quantifiable values that may be assessed over time as a disease process evolves. Improvements in quantification methods of FAF imaging may allow us to objectively evaluate posterior uveitis.
Keywords: posterior uveitis, foveal autofluorescence, quantification, fundus autofluorescence imaging
Introduction
The inflammatory maculopathies are a heterogeneous group of posterior uveitis syndromes that affect the macula with primary involvement of the inner and outer retina, retinal pigment epithelium (RPE), and the choroid.1 These conditions include acute macular neuroretinopathy (AMNR), acute posterior multifocal placoid pigment epitheliopathy (APMPPE), multifocal choroiditis (MFC), punctate inner choroidopathy (PIC), serpiginous choroiditis, and unilateral acute idiopathic maculopathy (UAIM). “Ampiginous” choroiditis, an entity bearing clinical features of APMPPE with more widespread and sometimes recurrent involvement, similar to the pattern observed in serpiginous choroiditis, is often included in this group of syndromes.
Most patients with an inflammatory maculopathy present with painless loss of vision with or without a viral prodrome, but differ in their clinical presentation, need for treatment, and visual prognosis. The rarity of these maculopathies and diverse spectrum of disease presentation can make the diagnosis and management challenging. Fluorescein angiography and indocyanine green angiography have traditionally helped to differentiate these maculopathies and allow precise imaging of physiologic changes within the retina and choroid, while spectral-domain optical coherence tomography (SD-OCT) has allowed us to visualize anatomic changes in posterior segment tissues. Advances in our understanding of these architectural changes have refined our abilities to diagnose and understand inflammatory pathologies involving the macula.2–4
Fundus autofluorescence (FAF) imaging provides additional information regarding naturally occurring fluorophores including lipofuscin, which may accumulate during tissue injury and herald future RPE and overlying photoreceptor damage.1,5,6 Acute inflammation may alter the quantity and the quality of autofluorescence signal during the acute stage of macular disease.1,2 The structural changes in the RPE that occur after the tissue injury during the acute stage of inflammation may also lead to permanent changes in autofluorescence, which are visible on imaging as a decreased, or hypoautofluorescent, signal.3–6 In some cases of posterior uveitis, such as serpiginous choroiditis, hyperautofluorescence at the border of a chorioretinal scar may herald the active phase of illness, while hypoautofluorescence is seen during disease convalescence.1,2,5,7,8
FAF thus provides valuable insight regarding the specific diagnosis, severity, and location of inflammation in posterior uveitis in a noninvasive manner.3,5,6,9 However, FAF imaging characteristics that distinguish the inflammatory maculopathies, as well as the quantitative and qualitative changes that occur during active and inactive disease, which are reflective of the intricate relationship between the retina, RPE, and choroid, are incompletely understood.1,2 We describe the FAF characteristics in a cohort of patients with rare inflammatory maculopathies and describe quantifiable changes in FAF features within these rare disease syndromes during active and inactive disease.
Methods
This was an Institutional Review Board-approved review of consecutive patients diagnosed with an inflammatory maculopathy who underwent FAF imaging from the Emory Eye Center, Emory University School of Medicine (Atlanta, GA, USA) and the University of British Columbia (Vancouver, BC, Canada) between October 2010 and October 2011. The research followed the tenets of the Declaration of Helsinki. Diseases included AMNR, APMPPE, MFC, PIC, serpiginous choroiditis, and UAIM. Demographic data collected included patient age, sex, disease laterality, visual acuity, funduscopic findings, fundus photography (Topcon Medical Systems, Inc., Oakland, NJ, USA); Ophthalmic Imaging Systems, Merge Healthcare, Chicago, IL, USA), fluorescein angiography, and SD-OCT (Carl Zeiss Meditec AG, Jena, Germany), when available. FAF images were obtained on the Heidelberg Spectralis HRA (Heidelberg Engineering, Carlsbad, CA, USA) with an excitation filter at 488 nm and a barrier filter at 500 nm. Clinical data and FAF imaging for patients with serial follow-up were also reviewed when available. A subset of patients were seen only once on a consultative basis given the tertiary referral nature of the practice settings.
To evaluate the non-normalized FAF signal in the fovea, a circular area that corresponded to the size of the optic disc was placed on the center of the foveola using ImageJ software (http://rsbweb.nih.gov/ij/index.html). The location of the foveola, 1500 mm area, was determined by two independent ophthalmologists (CSL, AYL). An independent grader (SY) adjudicated differences between the initial location of the foveola using fundus photography landmarks when there was a discrepancy. The intensity of the FAF signal in a 1,500 μm area was analyzed using ImageJ software. FAF images, which were deemed unsuitable for analysis due to media opacity, were excluded from quantitative FAF analysis. The median and standard deviation (SD) of foveal autofluorescence were measured using ImageJ, and all statistics were performed with the R statistical language (http://www.r-project.org/). An example of foveal autofluorescence analysis with a three-dimensional heat map is shown in Figure 1.
 | Figure 1 Fundus autofluorescence (FAF) imaging and three-dimensional (3D) heat maps demonstrating range of foveal autofluorescence. |
In patients in whom serial FAF imaging was obtained, quantitative autofluorescent values were compared between early (active) and late (resolving or convalescent) phases of the disease. A student’s paired t-test was used to compare mean foveal autofluorescence intensities during active and inactive phases of disease. A P-value <0.05 was considered statistically significant for all analyses.
Results
A total of six different inflammatory maculopathies were included in the study and included AMNR, APMPPE, MFC, PIC, serpiginous choroiditis, and UAIM. A total of 40 eyes of 20 patients were investigated in this study and their clinical features and qualitative autofluorescence findings are summarized in Table 1. Eighteen patients underwent qualitative FAF image analysis, and 15 patients with FAF imaging of sufficient quality for quantitative FAF evaluation were included in the final analysis of mean and SD calculations (Figures 2 and 3). There were eight males and 12 females with mean age of 38.2 years (range 20–75 years). Twelve patients (60%) had bilateral disease involvement at presentation. The mean follow-up time was 16 weeks (range 2–40 weeks) in patients for whom follow-up data were available.
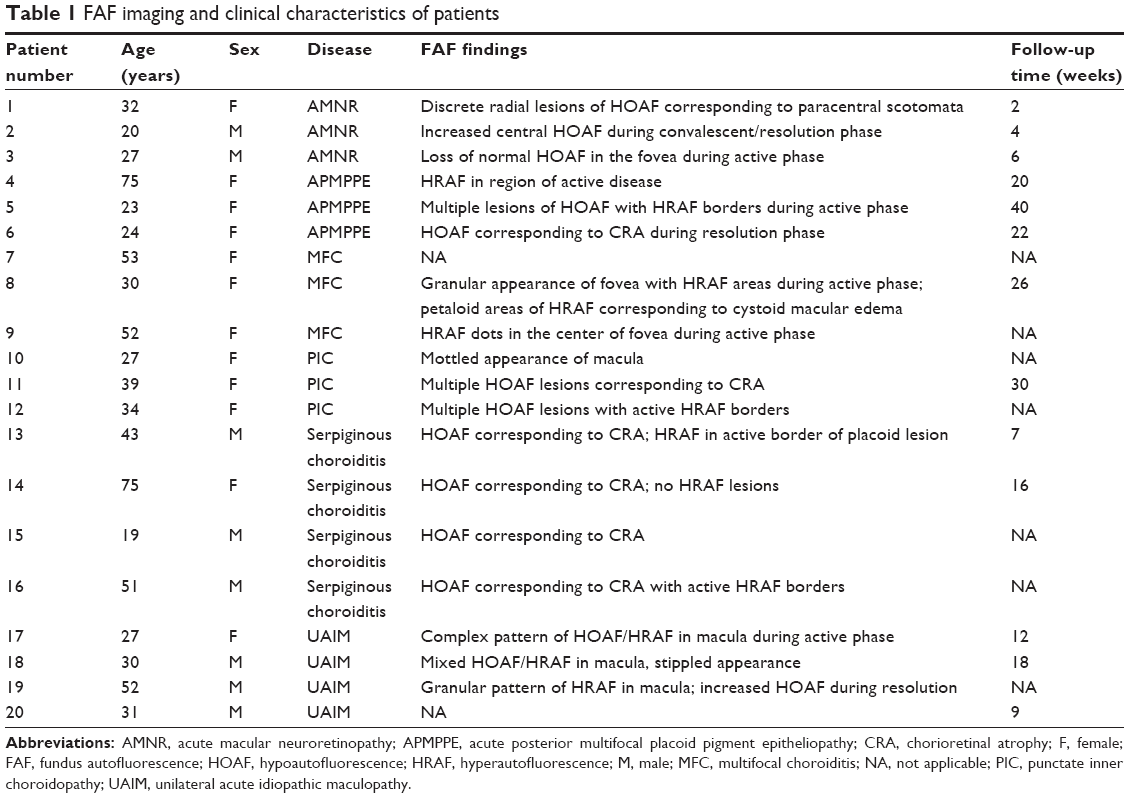 | Table 1 FAF imaging and clinical characteristics of patients |
 | Figure 2 Median and SD of foveal autofluorescence. |
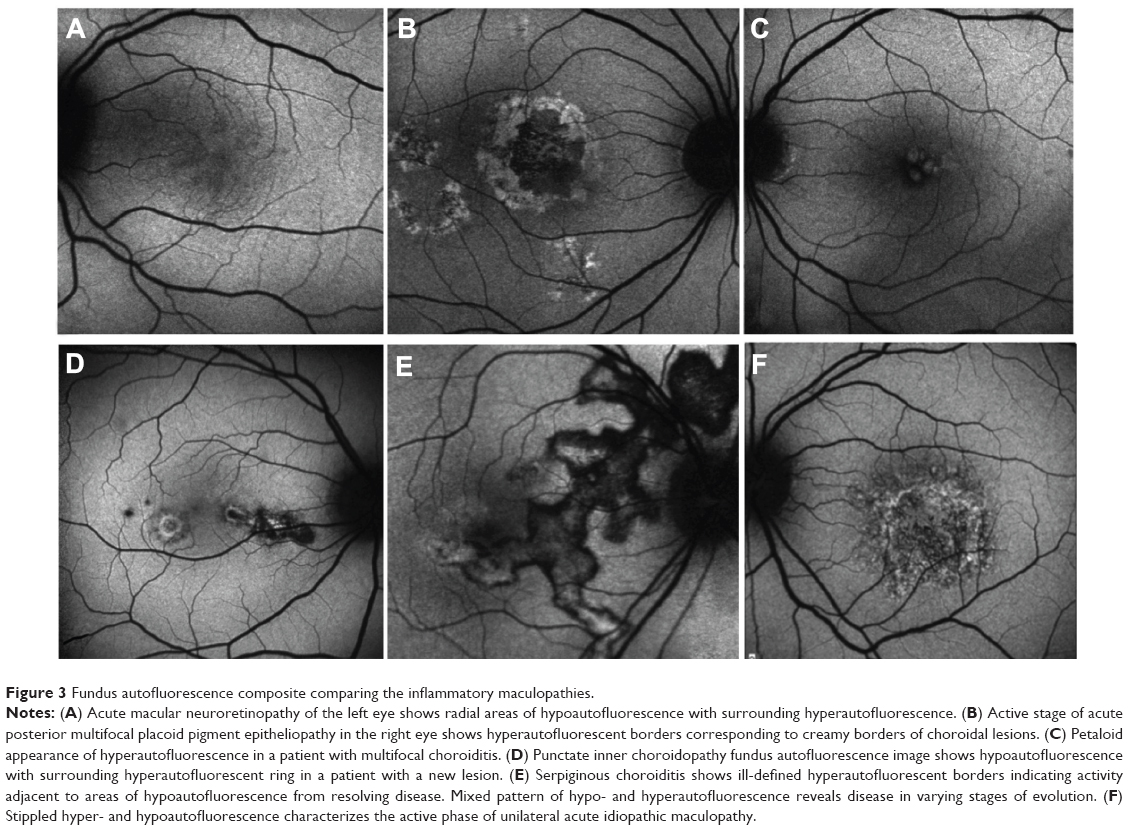 | Figure 3 Fundus autofluorescence composite comparing the inflammatory maculopathies. |
During the active phase of inflammation, AMNR and UAIM demonstrated the highest median values of foveal autofluorescence (Figure 2A, Table 2) among the maculopathies. The SD of foveal autofluorescence in AMNR was the lowest, while UAIM showed the highest SD, followed by serpiginous choroiditis (Figure 2B, Table 2).
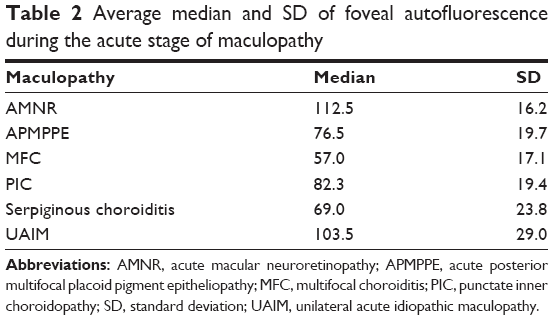 | Table 2 Average median and SD of foveal autofluorescence during the acute stage of maculopathy |
AMNR
All three patients with AMNR presented with acute, paracentral vision loss. Interestingly, one presented with pain and pressure sensation while the other two patients presented with an episode of painless vision loss. All three patients showed hypoautofluorescent lesions, which were discrete and corresponded to their areas of paracentral scotomata, both in the active and convalescent phases.
One of the patients was a 32-year-old female at 33 weeks gravida status who described paracentral scotomata and Amsler grid abnormality, which corresponded with the macular finding. She described several oval scotomata, which corresponded to radially oriented hypoautofluorescent lesions observed by FAF imaging and the near-infrared reflectance image. A corresponding SD-OCT image showed disruption of the ellipsoid portion of the inner segments (Figure 4). During the convalescent phase, the macular lesion became largely hypoautofluorescent. One other male patient was able to identify a paracentral scotoma on Amsler grid that also corresponded directly to a macular lesion observed by FAF imaging, which showed loss of normal foveal hypoautofluorescence, making the area relatively hyperautofluorescent overall.
 | Figure 4 Diagnostic imaging in a 32-year-old patient with acute macular neuroretinopathy. |
APMPPE
All three female patients developed a painless, sudden-onset scotoma, either in a central or paracentral location. Funduscopic examination was significant for cream-colored macular lesions characteristic of APMPPE during the active phase. The active lesions demonstrated hyperautofluorescent borders on FAF with central areas of hypoautofluorescence. During the convalescent phase of APMPPE, the macular lesions faded with variable degrees of RPE hyperplasia and atrophy. On FAF imaging, hypoautofluorescence overlying the lesions with a decrease in the surrounding zones of hyperautofluorescence was observed.
One of the patients was a healthy, 23-year-old Caucasian female who presented with a 2-week history of central blurry vision in the right eye. She had undergone a 7-day course of oral prednisone (60 mg/day) with some subjective improvement. However, 4 days after cessation of the oral corticosteroids, the patient developed a paracentral scotoma in the left eye and was referred to our institution. Her presenting visual acuity was 20/100 in the right eye with eccentric fixation and 20/20-1 in the left eye. There were trace cells in the anterior vitreous in both eyes. On dilated fundus exam, there were multiple cream-colored choroidal lesions in the right eye, which were greater in number than in the left eye (Figure 5). Fluorescein angiography showed early blockage with mild diffuse staining and late leakage overlying these regions. FAF showed hyperautofluorescent borders surrounding hypoautofluorescent lesions that corresponded to choroidal lesions (Figure 5). Intravenous methylprednisolone (1 g daily for 3 days) followed by an oral prednisone taper led to improvement in her scotomata and an improvement to a visual acuity of 20/20 by 2 months’ follow-up. The hyperautofluorescent borders of the lesions on FAF became more hypoautofluorescent with interspersed zones of stippled hyperautofluorescence as the disease resolved at 10 months’ follow-up (Figure 5).
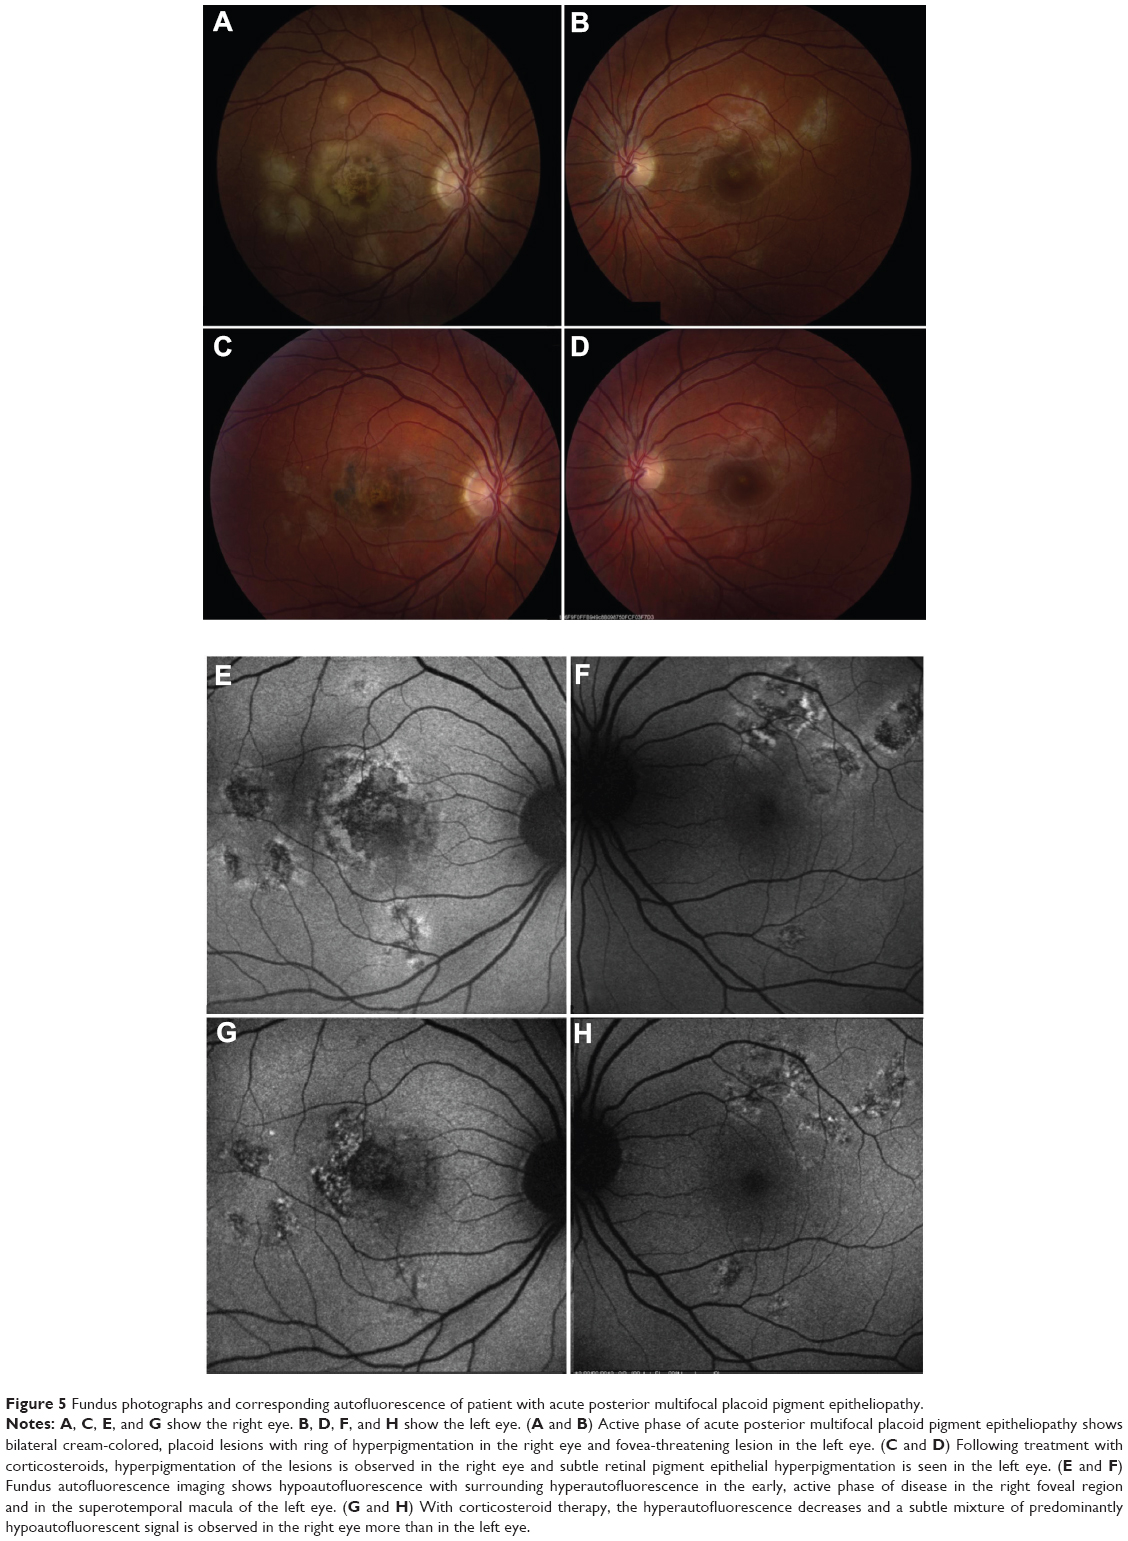 | Figure 5 Fundus photographs and corresponding autofluorescence of patient with acute posterior multifocal placoid pigment epitheliopathy. |
PIC
Three patients with PIC were evaluated with FAF imaging. The location of the lesions throughout the macula varied and included foveal, perifoveal, and peripapillary locations. The active lesions showed hyperautofluorescent borders surrounding hypoautofluorescent centers. The hyperautofluorescent areas also coincided with the location of prior choroidal neovascularization. The active lesions became hypoautofluorescent during the convalescent phase of disease illness (Figure 6).
 | Figure 6 Fundus photographs and fundus autofluorescence in punctate inner choroidopathy. |
MFC
Three female patients were included and presented with bilateral involvement with multiple lesions throughout the macula and mid-periphery. All patients were on immunosuppressive therapy at the time of recurrence. The active lesions appeared white or cream-colored and predominated in the retinal periphery. Because of the peripheral location of some of the lesions, visualized clinically and by fundus photography, the autofluorescence of these lesions was not quantifiable. FAF also demonstrated hyperautofluorescence in a petaloid configuration in one patient with bilateral cystoid macular edema (Figure 7). Patients with active lesions showed hyperautofluorescence of the lesions, whereas inactive lesions were found to be hypoautofluorescent.
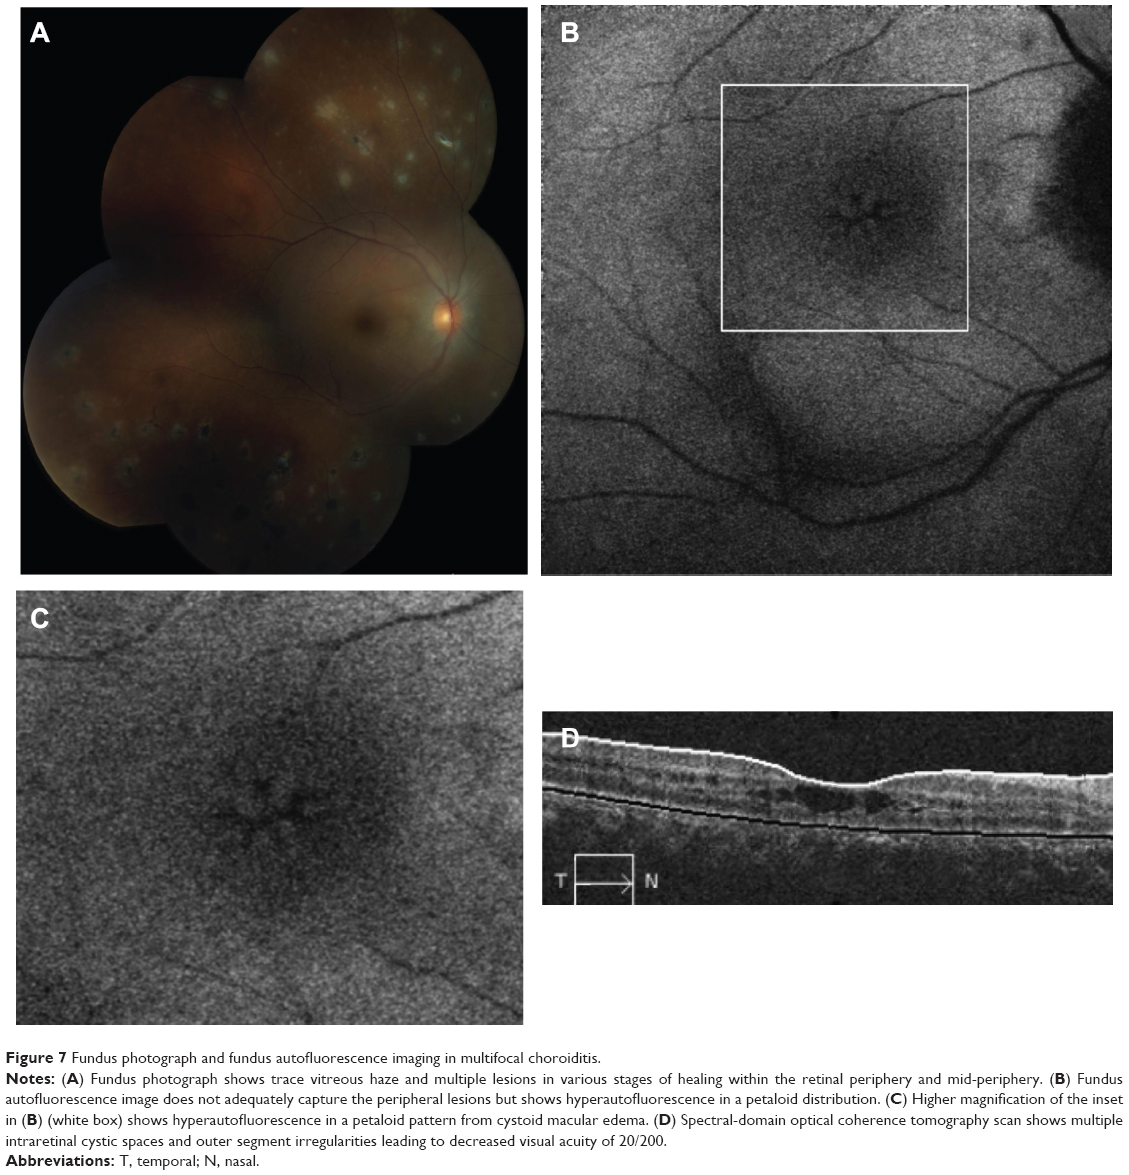 | Figure 7 Fundus photograph and fundus autofluorescence imaging in multifocal choroiditis. |
Serpiginous choroiditis
Four patients with serpiginous choroiditis were assessed with FAF imaging in this series and all patients were treated with immunosuppressive therapy (ie, corticosteroids, corticosteroid-sparing immunosuppression, or both). All eyes demonstrated typical geographic lesions emanating from the peripapillary region. Disease activity was confirmed by the presence of new lesions by fluorescein angiography. Active borders of the serpiginous lesions coincided with hyperautofluorescence on FAF imaging (Figure 8). As immunosuppression was escalated and the disease progressed to convalescence, the previously observed hyperautofluorescence progressed through stages of intermixed hypo- and hyperautofluorescence to a homogeneous hypoautofluorescent appearance tightly corresponding to the zone of chorioretinal atrophy observed clinically and by fundus photography.
 | Figure 8 Fundus photographs and fundus autofluorescence in serpiginous choroiditis. |
UAIM
Three patients with UAIM were imaged using FAF imaging. During the acute phase of UAIM, patients showed a stippled pattern of grayish-white coloration within the fovea, observed by clinical examination and fundus photography, which correlated with a complex mixture of hypo- and hyperautofluorescence on FAF imaging (Figure 9). The macular lesion was heterogeneous in terms of autofluorescence intensity. SD-OCT revealed neurosensory detachment and interrupted the ellipsoid portion of the inner segments and outer retinal layers during early stages of active disease. As the disease progressed to convalescence, the characteristic lesion became a well-circumscribed zone of RPE hyperplasia and atrophy. This corresponded to a homogeneously hypoautofluorescent lesion on FAF.
 | Figure 9 Fundus photograph and fundus autofluorescence in unilateral acute idiopathic maculopathy. |
Discussion
The inflammatory maculopathies comprise a heterogeneous group of inflammatory syndromes involving the choroid, RPE, and inner and outer retina. Although these diseases have been characterized clinically, the precise pathogenesis of these conditions is incompletely understood. The noninvasive method of FAF provides a medium by which outer retina and RPE changes can be evaluated, compared, and assessed across disease syndromes and provides valuable insight into the pathogenic changes occurring in each of these entities.
Each imaging modality, including fluorescein angiography, SD-OCT, and indocyanine green angiography, provides unique information not provided by other modalities, but each has its inherent weaknesses (eg, media opacity limitation with FAF). FAF provides valuable information regarding outer retinal architecture and may highlight subtle inflammation during the active state and/or the overall lipofuscin accumulation and thereby act as an indicator of the health of the RPE cells.2,9 This information is particularly valuable in our understanding of the pathophysiology of various maculopathies.8,9
In our study, both AMNR and UAIM demonstrated the highest median autofluorescence values, suggesting global hyperautofluorescence during the active phase. Interestingly, AMNR showed the lowest SD, while UAIM had the highest SD. This difference correlated clinically, as AMNR’s FAF signal was characterized by overall loss of normal foveal hypoautofluorescence, therefore making this homogeneously hyperautofluorescent despite the discrete, well-circumscribed areas of hypoautofluorescence observed in several patients. By contrast, UAIM showed a stippled and mixed pattern of hypo- and hyperautofluorescence, resulting in a high SD. Although the classical description of these conditions (ie, wedge-shaped, reddish-brown lesions in AMNR and serous retinal detachment with RPE mottling in UAIM) may help to distinguish these conditions clinically, FAF imaging may be helpful in distinguishing these disease syndromes in patients in whom findings may be more subtle or in patients who present later in their disease course.
In patients with MFC and PIC, median autofluorescence was similar. Whether MFC and PIC may represent a continuum has been debated, and the similar FAF patterns and quantitative FAF values suggest that similar processes may lead to parallel FAF findings (ie, choroidal inflammation with overlying photoreceptor–RPE complex injury and subsequent increased risk of choroidal neovascularization). Another possibility and limitation of our study is that, since our quantitative autofluorescence algorithm focused on the foveal center, it is possible that lesions outside of a one-disc-area zone may not have been detected and measured with our current algorithm, as observed in one patient with MFC who demonstrated numerous lesions within the retinal periphery but no evidence of pathology within the foveal lesion; however, in this patient, FAF imaging was helpful in the identification of cystoid macular edema, which was confirmed by SD-OCT.
Our study is the first investigation specifically quantifying autofluorescence in this rare group of inflammatory maculopathies. Our study used medians and SDs of FAF images to quantitate foveal autofluorescence more objectively. Mean values were specifically not chosen for analysis because the foveal autofluorescence intensities in the diseases in our cohort were not necessarily normally distributed. However, the median autofluorescence value gives insight regarding the general hyper- or hypoautofluorescence of an image. We observed that the majority of inflammatory maculopathies showed hyperautofluorescence during the active phase of disease. This may have been due to change in the amount of autofluorescent fluorophores2 within the RPE,10 (an indication of the RPE cells being in a hypermetabolic state), or retinal edema.
While a median FAF value predicts an overall autofluorescence profile of the region of interest, it does not accurately describe the distribution of autofluorescence intensity signal. The SD measures the diversity of the intensity distribution in a given region of interest. For instance, in our study, a high SD indicates a highly variable intensity within the foveal center, while a low SD suggests a more homogeneous autofluorescence signal. Moreover, the SD is less subject to linear normalization shifts due to the common reasons for variability in autofluorescence exposure and is thus a more robust objective measurement in a defined area.
While these findings may provide insight into the pathogenesis of the inflammatory maculopathies, the limitations to this project are important considerations. Particularly in patients with PIC or MFC in whom lesions may occur within and outside of the outlined area, FAF signal could not be specifically measured for all lesions. Future directions, including enlargement of the area of measurement to the entire macula, could be considered. The study was also limited by the small sample size of rare inflammatory maculopathies and lack of a control group. Normative data on the median and SD of FAF intensity would be helpful for future comparisons. The tertiary, referral-based nature of our practice also limited patient follow-ups, so that active and convalescent phases could not be described for every disease entity. Finally, the inherent variability of FAF images was also a limiting factor. Specifically, FAF intensity may vary depending on exposure, media opacity, and the refractive error of the patient. While the exposure variations may affect the median measurement of the autofluorescence signal, SD, our other major outcome variable, was likely less prone to change by exposure variation.
Despite these limitations, the use of quantitative FAF imaging in our study allowed us to better characterize patterns of FAF imaging in these rare inflammatory maculopathies. The use of the metrics of median and SD of foveal autofluorescence may be a useful aid for distinguishing disease entities (eg, AMNR versus UAIM), as well as in follow-up for active and convalescent disease states.
Conclusion
Despite some limitations, future studies should include correlation of visual acuity with median and SD of foveal autofluorescence, with further follow-up and serial imaging, as well as the development of quantitative methods for examination of larger regions of interest for characterization of the inflammatory maculopathies.
Acknowledgments
This study was supported in part by an unrestricted grant to the Emory Eye Center from the Research to Prevent Blindness (RPB). This work was also supported in part by an NEI Core Grant for Vision Research (P30 EY 006360). The Emory University School of Medicine and the University of British Columbia Institutional Review Board approved this study, and all work pertaining to this project maintained HIPAA compliance. This research was presented in part at the Association of Research in Vision and Ophthalmology; May 7th, 2012; Fort Lauderdale, FL, USA.
Disclosure
The authors report no conflicts of interest in this work.
References
Yeh S, Forooghian F, Wong WT, et al. Fundus autofluorescence imaging of the white dot syndromes. Arch Ophthalmol. 2010;128:46–56. | ||
Holz FG, Schmitz-Valckenberg S, Spaide RF, Bird AC, editors. Atlas of Fundus Autofluorescence Imaging. Berlin: Springer; 2007. | ||
Roesel M, Henschel A, Heinz C, Dietzel M, Spital G, Heiligenhaus A. Fundus autofluorescence and spectral domain optical coherence tomography in uveitic macular edema. Graefes Arch Clin Exp Ophthalmol. 2009;247:1685–1689. | ||
von Rückmann von A, Fitzke FW, Bird AC. Distribution of pigment epithelium autofluorescence in retinal disease state recorded in vivo and its change over time. Graefes Arch Clin Exp Ophthalmol. 1999;237:1–9. | ||
Gupta A, Bansal R, Gupta V, Sharma A. Fundus autofluorescence in serpiginouslike choroiditis. Retina. 2012;32:814–825. | ||
Haen SP, Spaide RF. Fundus autofluorescence in multifocal choroiditis and panuveitis. Am J Ophthalmol. 2008;145:847–853. | ||
Giuliari G, Hinkle DM, Foster CS. The spectrum of fundus autofluorescence findings in birdshot chorioretinopathy. J Ophthalmol. 2009;2009:567693. | ||
Cardillo Piccolino F, Grosso A, Savini E. Fundus autofluorescence in serpiginous choroiditis. Graefes Arch Clin Exp Ophthalmol. 2009;247:179–185. | ||
Schmitz-Valckenberg S, Holz FG, Bird AC, Spaide RF. Fundus autofluorescence imaging: review and perspectives. Retina. 2008;28:385–409. | ||
Carreño E, Portero A, Herreras JM, López MI. Assesment of fundus autofluorescence in serpiginous and serpiginous-like choroidopathy. Eye (Lond). 2012;26:1232–1236. |
 © 2014 The Author(s). This work is published and licensed by Dove Medical Press Limited. The
full terms of this license are available at https://www.dovepress.com/terms
and incorporate the Creative Commons Attribution
- Non Commercial (unported, 3.0) License.
By accessing the work you hereby accept the Terms. Non-commercial uses of the work are permitted
without any further permission from Dove Medical Press Limited, provided the work is properly
attributed. For permission for commercial use of this work, please see paragraphs 4.2 and 5 of our Terms.
© 2014 The Author(s). This work is published and licensed by Dove Medical Press Limited. The
full terms of this license are available at https://www.dovepress.com/terms
and incorporate the Creative Commons Attribution
- Non Commercial (unported, 3.0) License.
By accessing the work you hereby accept the Terms. Non-commercial uses of the work are permitted
without any further permission from Dove Medical Press Limited, provided the work is properly
attributed. For permission for commercial use of this work, please see paragraphs 4.2 and 5 of our Terms.