")
Back to Journals » ClinicoEconomics and Outcomes Research » Volume 15
Treatment Patterns and Healthcare Resource Use in Medicare Beneficiaries with Parkinson’s Disease
Authors Song Y , E JY, Guo T, Sasane R, Arcona S , Keshava N, Wu E
Received 19 May 2023
Accepted for publication 25 July 2023
Published 2 August 2023 Volume 2023:15 Pages 631—643
DOI https://doi.org/10.2147/CEOR.S422023
Checked for plagiarism Yes
Review by Single anonymous peer review
Peer reviewer comments 2
Editor who approved publication: Prof. Dr. Dean Smith
Yan Song,1 Jian-Yu E,1 Tracy Guo,1 Rahul Sasane,2 Steve Arcona,2 Nirmal Keshava,2 Eric Wu1
1Analysis Group, Inc, Boston, MA, USA; 2Cerevel Therapeutics, Cambridge, MA, USA
Correspondence: Yan Song, Analysis Group, Inc, 111 Huntington Ave, 14th Floor, Boston, MA, 02199, USA, Tel +1 617-425-8272, Email [email protected]
Background: Studies on real-world treatment patterns and long-term economic burden of Parkinson’s disease (PD) have been limited.
Objective: To assess treatment patterns, healthcare resource utilization (HRU), and costs associated with PD symptoms and treatment-related adverse events (AEs) among Medicare beneficiaries in the United States.
Methods: A 100% Medicare Fee-For-Service data (2006– 2020) of patients with PD were analyzed. PD treatment patterns were described for the subset of patients who had no previously observed PD treatments or diagnoses (ie, the incident cohort). HRU and healthcare costs associated with PD symptoms were assessed for all patients with PD (ie, the overall cohort) and that associated with treatment-related AEs were assessed for the subset of patients who received PD treatments after PD diagnosis (ie, the active treatment cohort), using longitudinal models with repeated measures.
Results: Overall, 318,582 patients were included (mean age at PD diagnosis: 77.4 years; 53.3% female). Among patients in the incident cohort (N=214,829), 51.1% initiated levodopa monotherapy and 5.9% initiated dopamine agonists (DAs) monotherapy as first-line treatment. The proportion of incident patients treated with DAs and other PD therapies generally increased from post-diagnosis years 1 to 10. The median time from diagnosis to PD treatment initiation was 2.0 months; the median time to treatment discontinuation was the longest with levodopa (18.7 months), followed by DAs (9.5 months). In the overall cohort, PD symptoms, especially motor symptoms and severe motor symptoms, were associated with significantly higher rates of HRU and costs. In the active treatment cohort (N=234,298), treatment-related AEs were associated with significantly higher rates of HRU and medical costs.
Conclusion: While levodopa is still the mainstay of PD management, considerable heterogeneity exists in real-world treatment patterns. Overall, PD symptoms and AEs were associated with significantly higher HRU and healthcare costs, suggesting unmet medical needs for PD treatments with better tolerability profiles.
Keywords: Parkinson’s disease, treatment patterns, adverse events, healthcare resource utilization, healthcare costs
Introduction
Parkinson’s disease (PD) is a progressive neurological disorder associated with motor and cognitive disability, reduced quality of life, and increased mortality.1–5 Although PD is incurable, several therapeutic options may be used for managing its symptoms, with the choice of therapy depending on patient age, symptoms, and disease severity.6,7
Levodopa is the mainstay of symptomatic treatment for PD;2 however, the use of levodopa has been associated with adverse events (AEs) such as dyskinesia.8 Other PD treatment options include monoamine oxidase type B (MAO-B) inhibitors, amantadine, catechol-O-methyltransferase (COMT) inhibitors, and dopamine agonists (DAs).2 MAO-B inhibitors and amantadine may be used as monotherapy or adjunct therapy, but they are not considered to be as effective as levodopa.2,9 COMT inhibitors may be used as an adjunct therapy to prolong the bioavailability of levodopa-based regimens but may also exacerbate the AEs of levodopa.2,10 Meanwhile, DAs have been associated with higher risks of AEs such as impulse control disorder, somnolence and hallucinations, and they may not be well tolerated in older adults.2,11,12
While PD has been shown to be a costly disease associated with an estimated $25.4 billion (2017 United States [US] dollars) of excess healthcare costs,13 most existing studies were limited to specific interventions or had short follow-up times, small sample sizes, or unrepresentative cohorts of the US beneficiaries.14–18 More importantly, there is a paucity of data on the excess burden imposed by specific PD symptoms or treatment-related AEs. Therefore, this study aimed to better understand the current real-world treatment patterns among Medicare beneficiaries and to estimate the healthcare resource utilization (HRU) and healthcare costs associated with PD symptoms and AEs related to PD treatments while controlling for relevant demographic and clinical characteristics using longitudinal data from a large real-world PD cohort in the US.
Methods
Data Source
The Centers for Medicare & Medicaid Services (CMS) 100% Medicare Fee-For-Service (FFS) data, including Parts A, B, and D, covering the period from 2006 to 2020 were used. The data contained information on beneficiary demographics, diagnostic and procedure codes, medications dispensed, dates of service, place of service, type of provider, and costs paid by Medicare. The data were de-identified and complied with the Health Insurance Portability and Accountability Act and the Declaration of Helsinki; therefore, an institutional review board exemption was obtained per Title 45 of CFR, Part 46.101(b)(4).19
Study Design
A retrospective cohort study was conducted to describe PD treatment patterns as well as HRU and costs associated with PD symptoms and AEs of PD treatments. For all patients, the index date was the first PD diagnosis in the data, the baseline period was the 6-month period prior to the index date, and the follow-up period spanned from the index date to the earliest of end of continuous enrollment, end of data availability, or death.
Study Populations and Cohorts
The sample selection flowchart is presented in Figure 1. All eligible patients with PD were included in the overall cohort if they met the following criteria: 1) had at least 2 diagnoses of PD (International Classification of Diseases, 9th Revision, Clinical Modification [ICD-9-CM] code: 332.0; International Classification of Diseases, 10th Revision, Clinical Modification [ICD-10-CM] code: G20) on distinct days occurring at least 1 month apart; 2) had continuous Medicare Part A, B, and D enrollment for at least 6 months prior to the first observed PD diagnosis; 3) had at least 3 years of continuous Medicare Part A, B, and D enrollment after the first observed PD diagnosis; and 4) were aged 65 or older on the first observed diagnosis of PD.
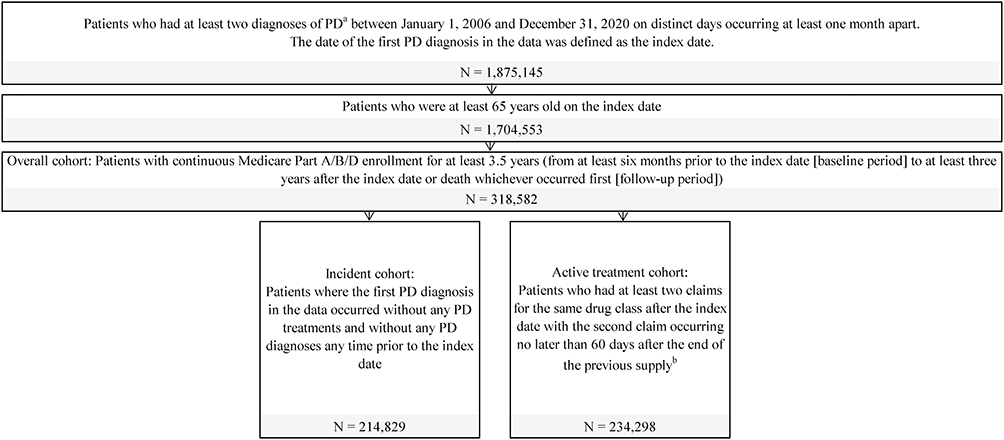 |
Figure 1 Sample selection diagram. Abbreviation: PD, Parkinson’s disease. Notes: aDiagnosis of PD was identified using International Classification of Diseases-9-Clinical Modification (ICD-9-CM) diagnosis code (332.0) or ICD-10-CM diagnosis code (G20). bDrug classes of interest included levodopa, dopamine agonists, monoamine oxidase type B inhibitors, and others (ie, amantadine, anticholinergics, catechol-O-methyltransferase inhibitors, and combination therapies). |
Among the overall cohort, patients were classified into 2 non–mutually exclusive sub-cohorts—the incident cohort and the active treatment cohort—for different analyses. To be included in the incident cohort, patients with PD were additionally required to have no observed PD treatments or PD diagnoses any time prior to the first PD diagnosis in the data. To be included in the active treatment cohort, patients with PD were additionally required to have at least 2 claims for the same drug class after the PD diagnosis, with the second claim occurring no later than 60 days after the end of the previous supply.
Study Variables
Patient Characteristics
Baseline demographic and clinical characteristics (eg, age, sex, race, Charlson Comorbidity Index [CCI], other comorbidities, motor and non-motor PD symptoms) were collected for all patient cohorts during the 6 months pre-index.
Treatment Patterns
Treatment patterns during the follow-up period were assessed among patients in the incident cohort. The proportion of incident patients receiving different classes of PD treatments (ie, levodopa, MAO-B inhibitors, DAs, and other PD therapies, including amantadine, anticholinergics, COMT inhibitor, levodopa inhaler, istradefylline, and Stalevo [carbidopa, levodopa and entacapone]) during the first 3 years of follow-up and treatment duration of each drug class were reported by line of therapy up to the third treatment regimen. Patients were considered to have started a new line of therapy if they switched to a new drug class, re-initiated the initial drug class after treatment discontinuation (defined by no claims for the current drug class for at least 60 days of the last day of supply), or added on another drug class to the current drug class (ie, augmentation). The distribution of PD treatments used by patients at post-index years 1, 3, 5, and 10 were assessed among those with continuous enrollment for the entire assessment period. Levodopa doses used by incident patients at the end of post-index years 1, 2, and 3 as well as the proportion of incident patients who had used high-dose levodopa (ie, ≥600 mg/day) at any time within the first 3 years of follow-up were measured.
The time to treatment initiation (defined as the time from first PD diagnosis to initiation of first PD treatment, including levodopa, DA monotherapies, and DA combination therapies) as well as the time to discontinuation (defined as the time from initiation to discontinuation of the following first-line [1L] treatments: levodopa, DAs, MAO-B inhibitors, and other therapies) were assessed. Patients who did not initiate or discontinue treatment were censored at the end of the study follow-up period. Adherence to each drug class was measured using proportion of days covered (PDC), defined as the total number of non-overlapping days covered by the medication divided by number of days from 1L treatment initiation to discontinuation.
All-Cause HRU and Healthcare Costs
All-cause HRU and healthcare costs during the follow-up period were assessed among patients in the overall cohort. HRU was reported by category, including inpatient visits, outpatient physician or specialty visits, skilled nursing facility or long-term care (SNF/LTC) visits, and emergency room (ER) visits. Healthcare costs comprised medical costs and pharmacy costs. Costs were assessed from the payers’ perspective and reported in 2020 US dollars.
The association of HRU and healthcare costs with PD symptoms occurring in the follow-up period was assessed for the overall cohort. PD symptoms were grouped into the following 5 categories: 1) motor symptoms (included dystonia, speech disturbance, dysphagia, gait impairment, and tremor); 2) severe motor symptoms (included falls and use of wheelchair or other enabling machines and devices); 3) sleep disorders (ie, sleep disturbance); 4) neuropsychiatric symptoms (included hallucination, impulse control disorder, cognitive/memory impairment, and depression); and 5) other non-motor symptoms (included orthostatic hypotension, urinary symptoms, and smell and taste disturbance).
The association of HRU and healthcare costs with treatment-related AEs occurring in the follow-up period was assessed for the active treatment cohort. Drug class-specific AEs considered included dyskinesia, somnolence, hallucinations, and impulse control disorder.
Statistical Analysis
Baseline characteristics and treatment pattern variables were summarized descriptively and reported using means and standard deviations (SD) for continuous variables and counts and proportions for categorical variables. Sankey plot was used to summarize the proportion of incident patients receiving each drug class by line of therapy. Kaplan–Meier (KM) curves were used to summarize the time to treatment initiation and time to treatment discontinuation among incident cohort, and the median time to each event was reported.
HRU and healthcare costs were compared between patients in the overall cohort with and without PD symptoms and between patients in the active treatment cohort with and without treatment-related to AEs using longitudinal models with repeated measures. Specifically, HRU and healthcare costs during the follow-up period were examined in 6-month cycles, and patients were grouped by PD symptoms or by AEs observed in the previous and current cycle (present vs absent). Negative binomial mixed effects models were used to estimate incidence rate ratios (IRRs) for HRU, and linear mixed effects models were used to estimate cost differences. The use of mixed models accounted for the correlation within patients between the different 6-month cycles and allowed for covariate adjustments. Multivariable models were adjusted for baseline characteristics, including age, sex, race, state, calendar year of the first PD diagnosis, CCI score, and the other PD symptoms or drug class-specific AEs. Adjusted IRRs for HRU and mean cost differences along with the corresponding 95% confidence intervals (CIs) and p-values were reported.
All statistical analyses were conducted using SAS Enterprise Guide version 7.1.
Results
Based on the sample selection criteria (Figure 1), 318,582 patients with PD were included in overall cohort, 214,829 were included in the incident cohort, and 234,298 were included in the active treatment cohort.
Baseline Characteristics
In the 3 cohorts (Table 1), the mean age at initial PD diagnosis was about 77 years; approximately half (51.1–53.3%) of the patients were female, and over 80% were of non-Hispanic White race. Patients were from all US census regions, with a slight preponderance of patients from the South (37.0–38.6%).
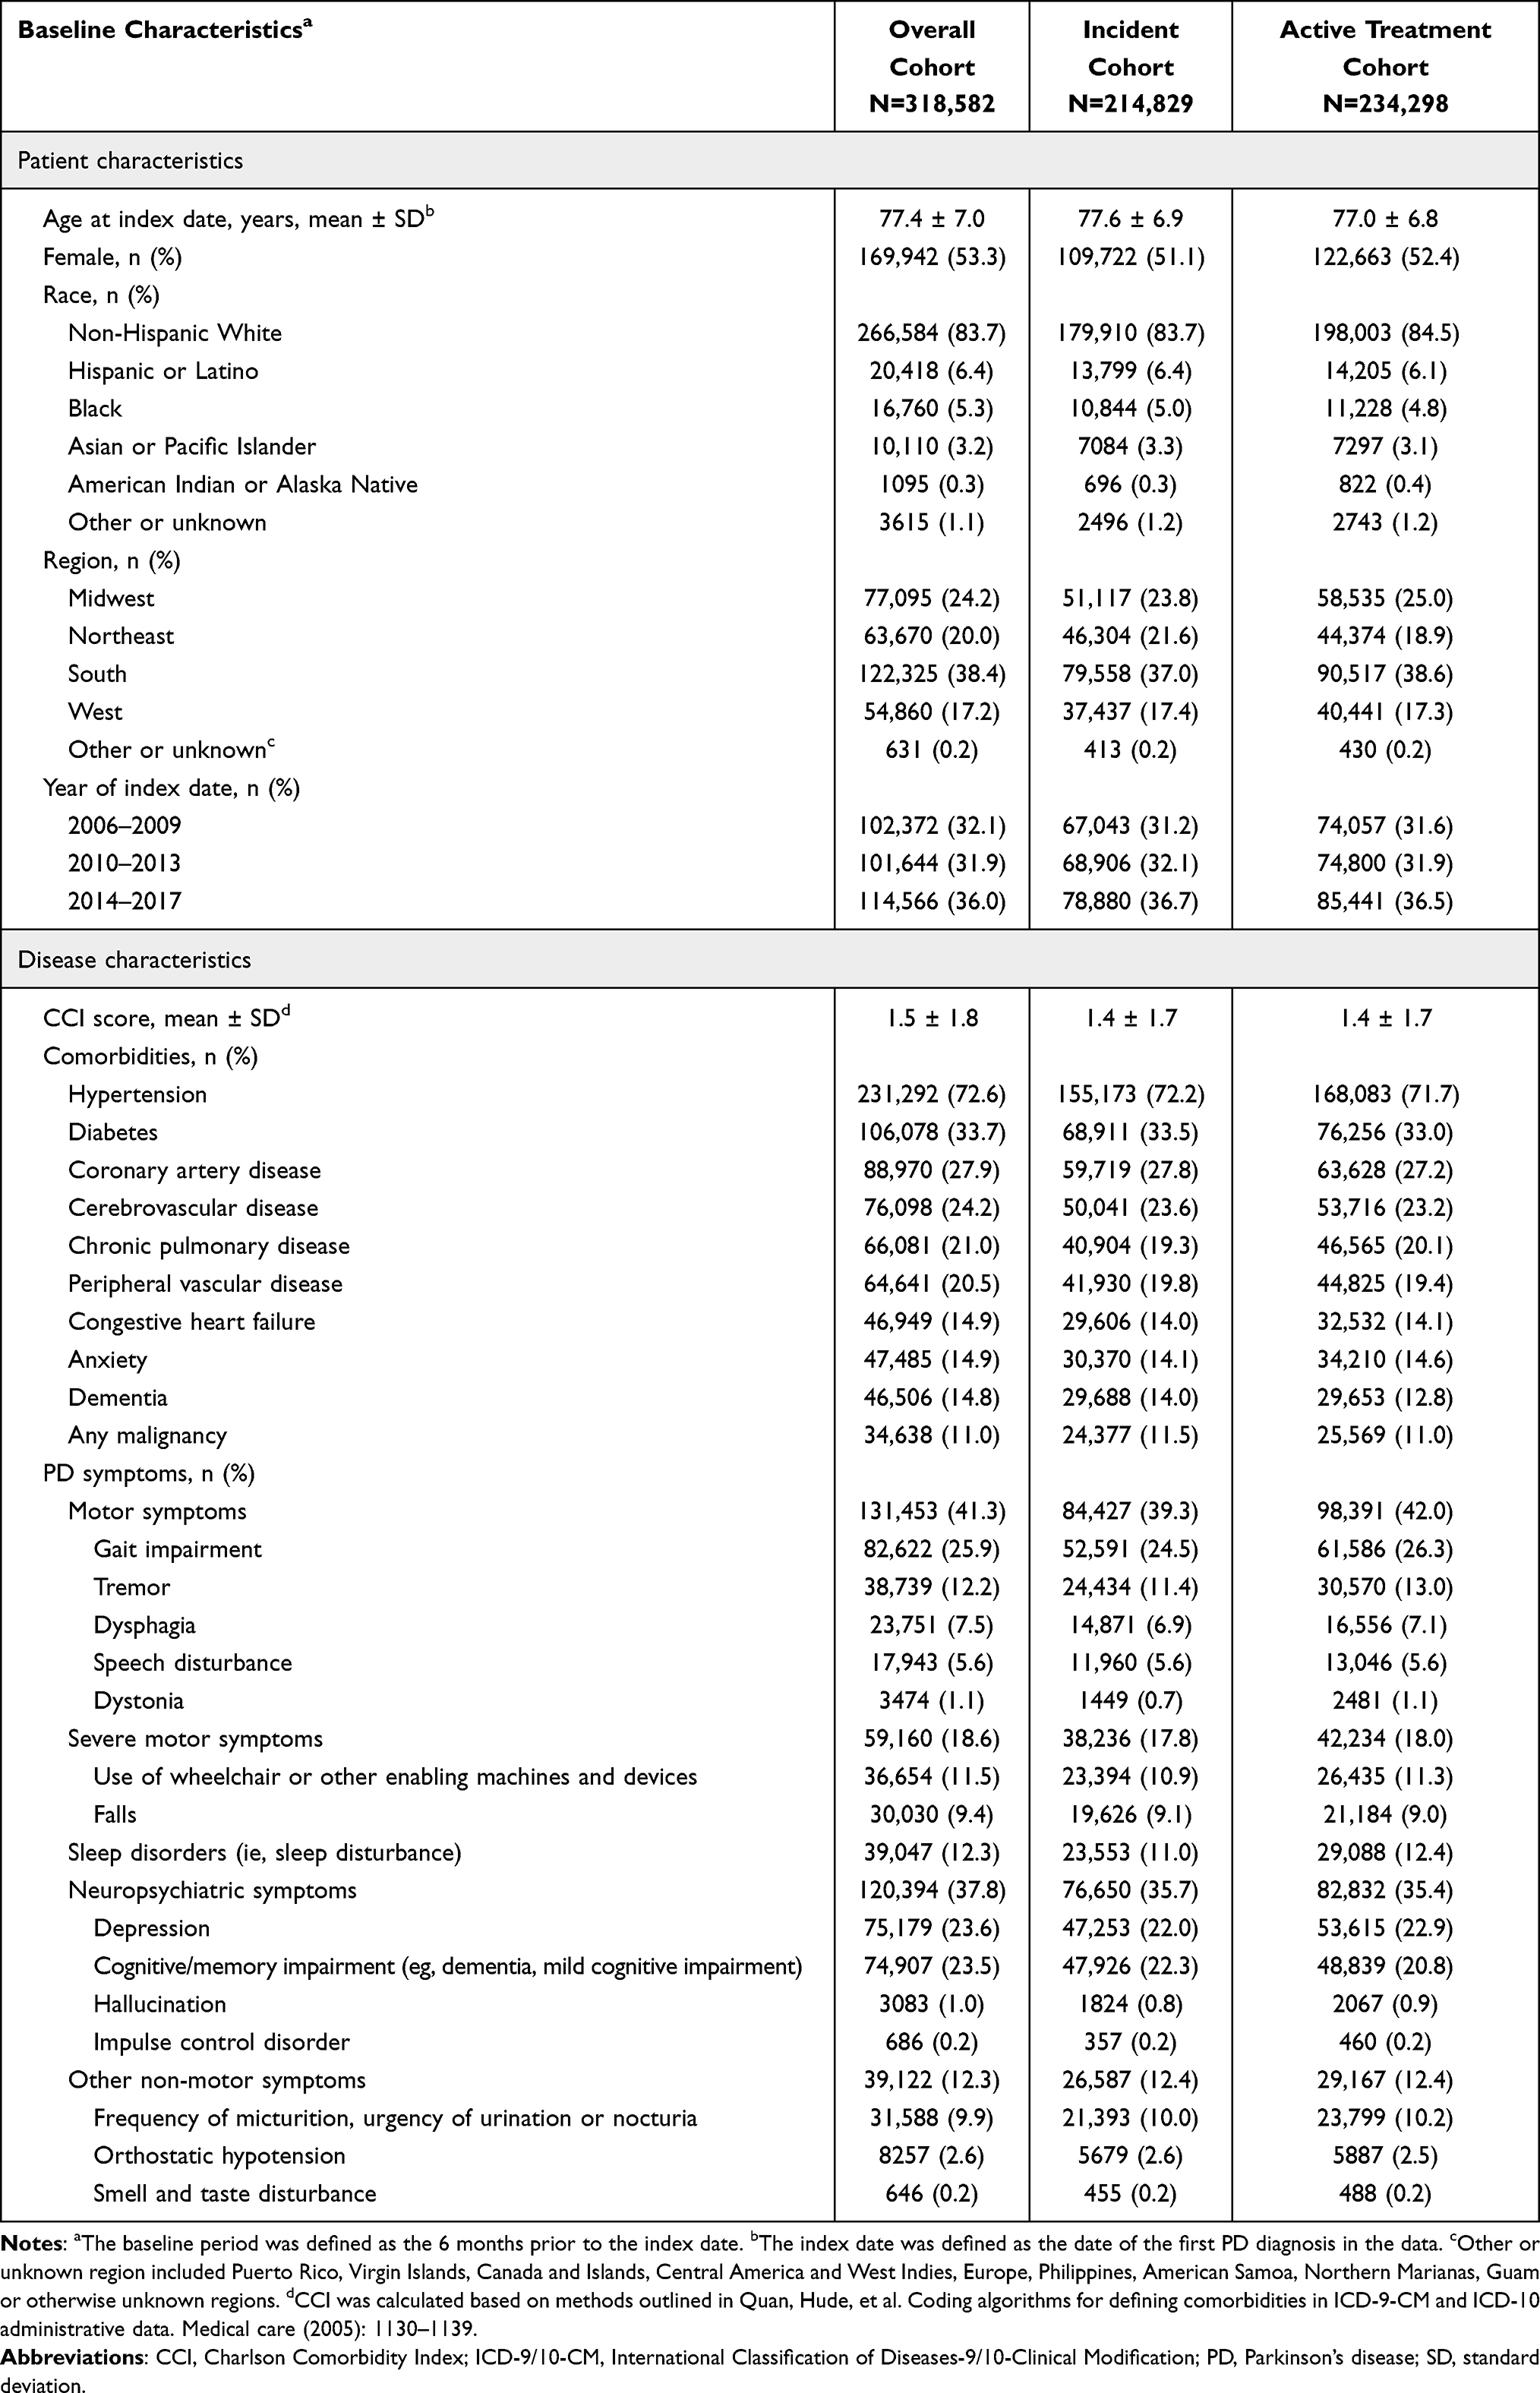 |
Table 1 Baseline Characteristics Stratified by Patient Cohort |
At baseline, the mean CCI of patients across cohorts was 1.4–1.5, and common comorbidities included hypertension (71.7–72.6%), diabetes with or without chronic complications (32.5–33.7%), coronary artery disease (27.2–27.9%), and cerebrovascular disease (23.2–24.2%). Regarding PD symptoms, 39.3–42.0% of patients experienced motor symptoms at baseline, driven by gait impairment and tremor, and 17.8–18.6% experienced severe motor symptoms. A substantial proportion of patients experienced non-motor symptoms, including 35.4–37.8% with neuropsychiatric symptoms (such as cognitive impairment and depression) and 11.0–12.4% with sleep disturbance.
Treatment Patterns in the Incident Cohort
PD Treatments Received by Drug Class and Line of Therapy
The median follow-up time for the incident cohort was 5.3 (IQR: 4.0, 7.3) years. Among incident patients, the most commonly observed 1L treatment was levodopa monotherapy, initiated by 109,673 (51.1%) patients, followed by DAs, initiated by 12,684 (5.9%) patients. A total of 70,224 (32.7%) and 41,174 (19.2%) incident patients were observed to have any second-line (2L) or third-line (3L) treatment. For 2L treatment, 33,303 (15.5%) patients received levodopa monotherapy and 9523 (4.4%) patients received DAs plus levodopa combination therapy. For 3L treatment, 20,059 (9.3%) patients received levodopa monotherapy and 5648 (2.6%) patients received DAs. A total of 71,115 (33.1%) incident patients did not receive any PD treatment after 3 years of PD diagnosis (Figure 2A).
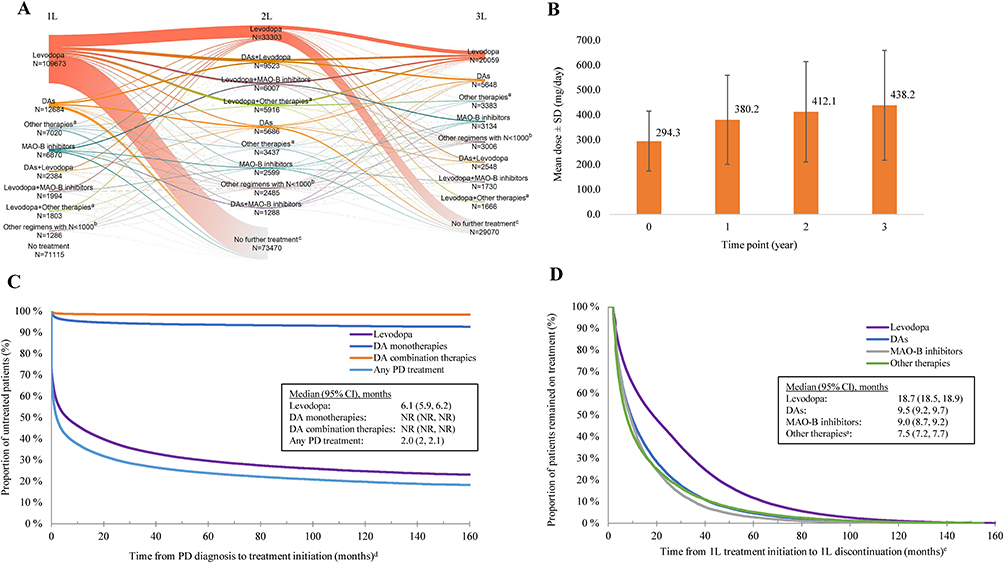 |
Figure 2 Treatment patterns of incident cohort. (A) Distribution of first, second, and third lines of therapy; (B) levodopa dosing; (C) time to treatment initiation; (D) time to treatment discontinuation. Abbreviations: 1L, first line; 2L, second line; 3L, third line; CI, confidence interval; DAs, dopamine agonists; MAO-B, monoamine oxidase B; NR, not reached; PD, Parkinson’s disease; SD, standard deviation. Notes: a“Other therapies” included amantadine, anticholinergics, catechol-O-methyltransferase inhibitor, levodopa inhaler, istradefylline, and Stalevo. b“Other regimens with N<1000” included regimens with a sample size of less than 1000 within each line of therapy. c“No further treatment” included patients who did not have treatment claims in the current line among those who have received treatment in the previous line. The counts included those who were censored at this line. dThe outcome event was defined as initiation of first PD treatment. Patients were censored at the end of study follow-up period. eThe outcome event was defined as 1L discontinuation. Patients were censored at the end of study follow-up period. |
Treatment duration generally decreased at later lines of therapy (Supplementary Table S1). The median treatment duration was the longest for levodopa monotherapy (17.5 months for 1L, 8.2 months for 2L, and 4.3 months for 3L), followed by levodopa plus MAO-B inhibitors combination therapy (10.4, 7.2, and 5.7 months for 1L to 3L, respectively) and levodopa plus DAs (9.8, 7.8, and 6.0 months for 1L to 3L, respectively).
The proportion of incident patients treated with DAs and other PD therapies generally increased over time (Supplementary Table S2). Specifically, DAs were received by 11.3% of patients in year 1 and 15.3% in year 10, and other PD therapies were received by 7.6% of patients in year 1 and 11.2% in year 10. Meanwhile, the proportion of patients treated with levodopa did not show an obvious increasing or decreasing trend and that treated with MAO-B inhibitors remained roughly the same over time.
Levodopa Dosing
Levodopa dosing among incident patients demonstrated an increasing trend over time (Figure 2B). Patients started levodopa at a mean dose of 294.3 ± 120.9 mg/day, and the dose gradually increased to 380.2 ± 178.7 mg/day at the end of year one, 412.1 ± 201.8 mg/day at the end of year 2, and 438.2 ± 221.0 mg/day at the end of year 3. Additionally, 46,995 (21.9%) incident patients had received high-dose levodopa (≥600 mg/day) within the first 3 years of follow-up.
Time to Initiation, Time to Discontinuation, and Adherence to PD Treatments
Based on KM estimates, the median time from PD diagnosis to initiation of first treatment was 2.0 (95% CI: 2.0, 2.1) months for any PD treatment and 6.1 (95% CI: 5.9, 6.2) months for levodopa; the median time to initiation was not reached for other DA therapies (Figure 2C). Among different PD treatments, the median time to treatment discontinuation was the longest with levodopa (18.7 [95% CI: 18.5, 18.9] months), followed by DAs (9.5 [95% CI: 9.2, 9.7] months), MAO-B inhibitors (9.0 [95% CI: 8.7, 9.2] months), and other PD therapies (7.5 [95% CI: 7.2, 7.7] months) (Figure 2D). Adherence to treatment was the highest with levodopa (median PDC of 92.7%), followed by MAO-B inhibitors (91.2%), DAs (88.5%), and other PD therapies (85.7%) (Supplementary Table S3).
Association of All-Cause HRU and Healthcare Costs with PD Symptoms and AEs in the Overall and Active Treatment Cohorts
In general, PD symptoms and AEs were associated with higher rates of HRU and higher healthcare costs, with the frequency of all observed all-cause HRU components and most all-cause healthcare cost components being significantly higher during the 6-month cycles in which patients experienced PD symptoms or AEs vs the cycles without the corresponding symptoms or AEs (Tables 2–5).
 |
Table 2 All-Cause HRU Over 6-Month Cycles Associated with PD Symptoms Among Overall Cohort |
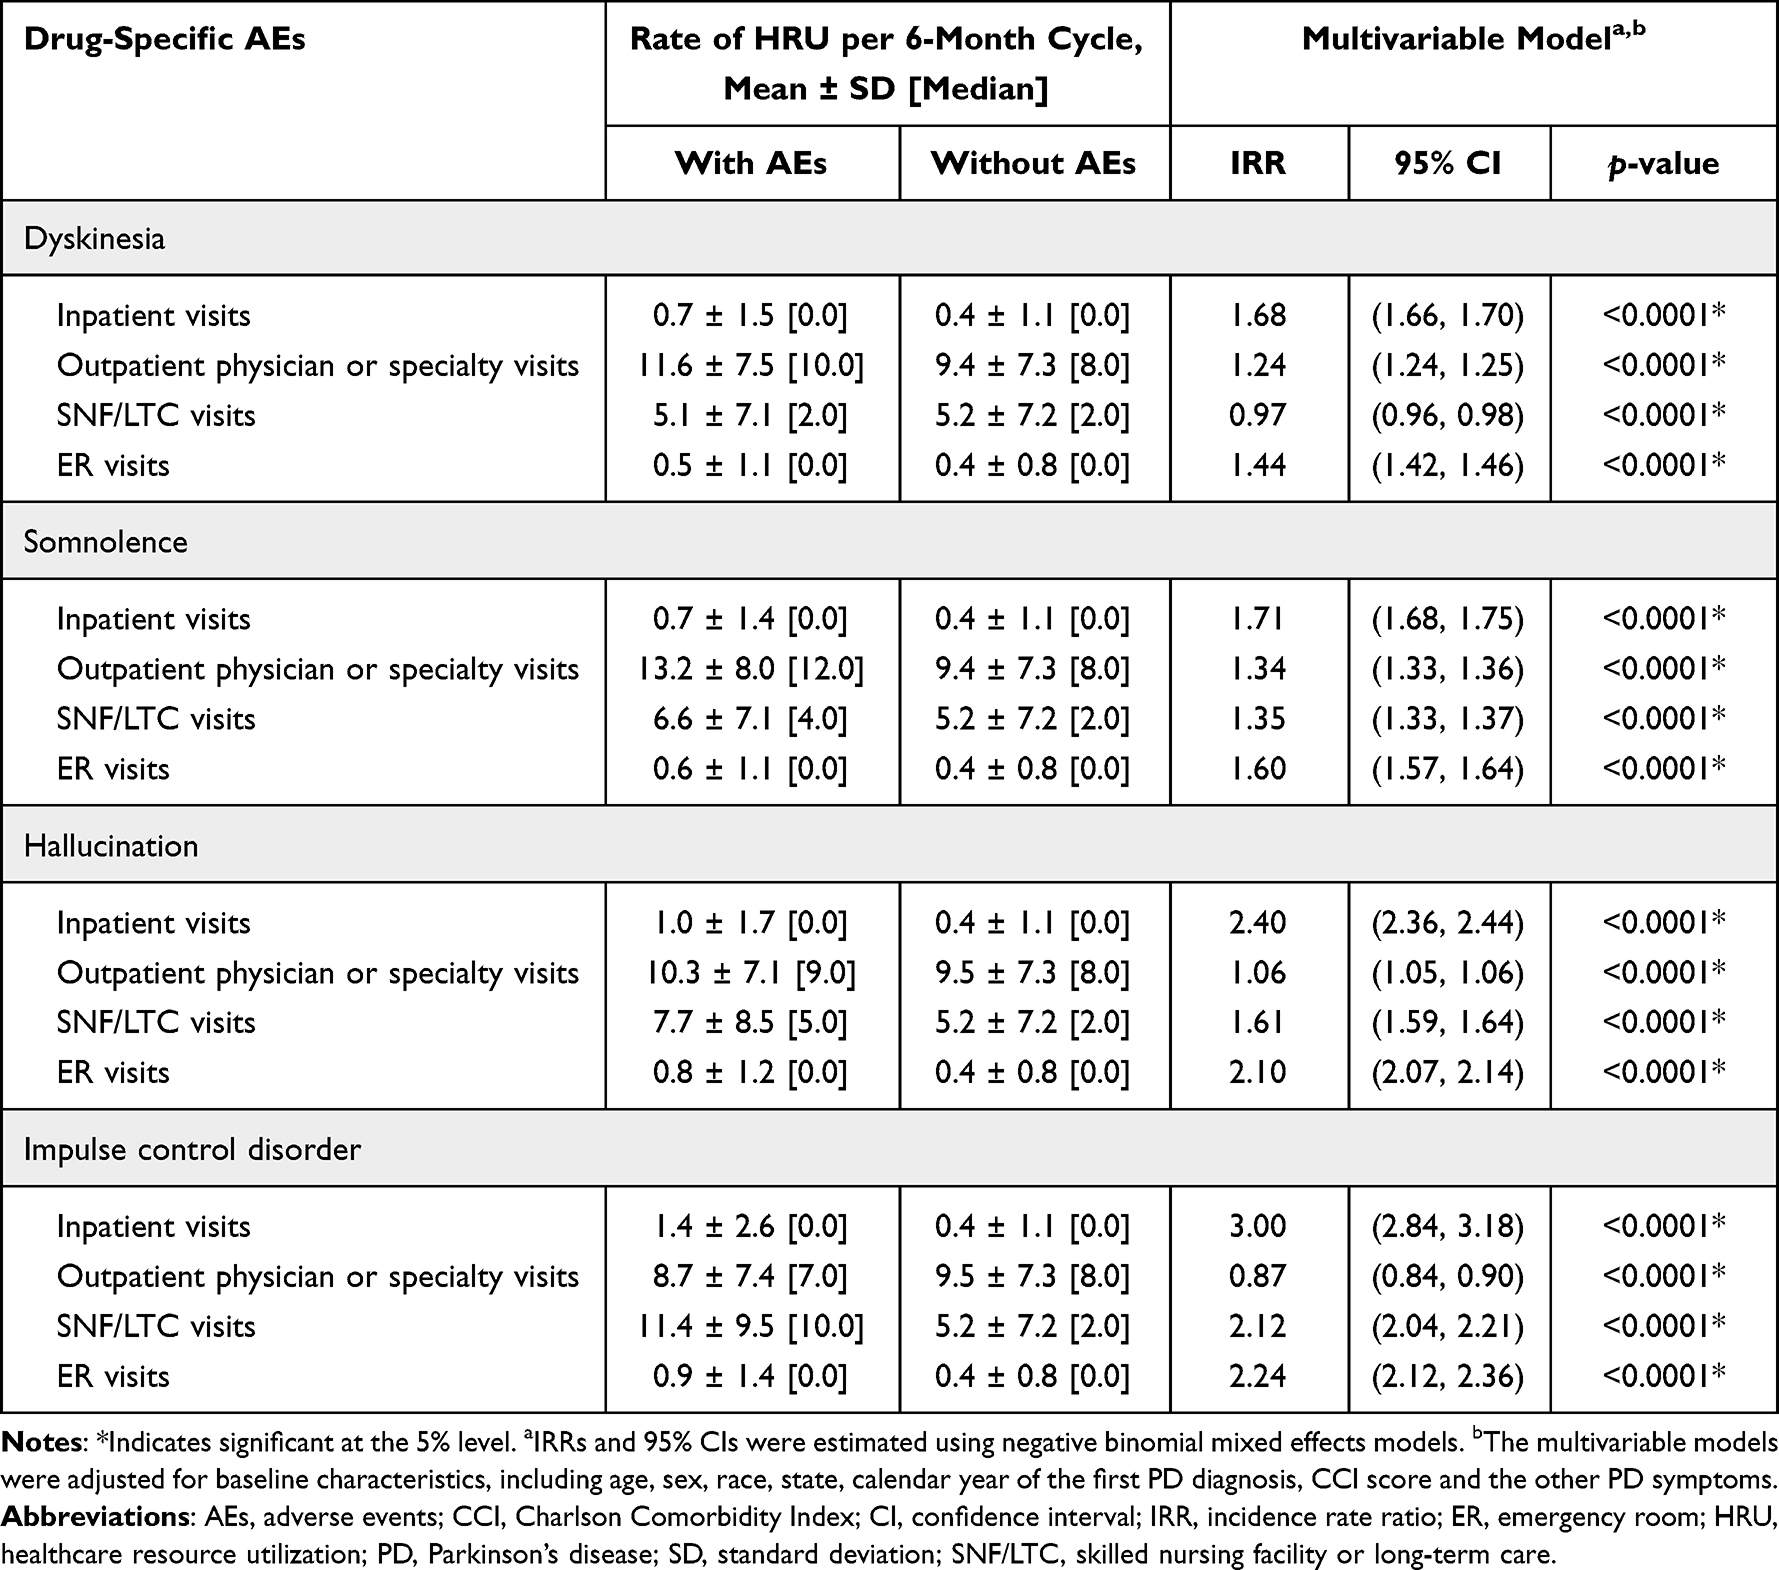 |
Table 3 All-Cause HRU Over 6-Month Cycles Associated with Drug-Specific AEs Among Active Treatment Cohort |
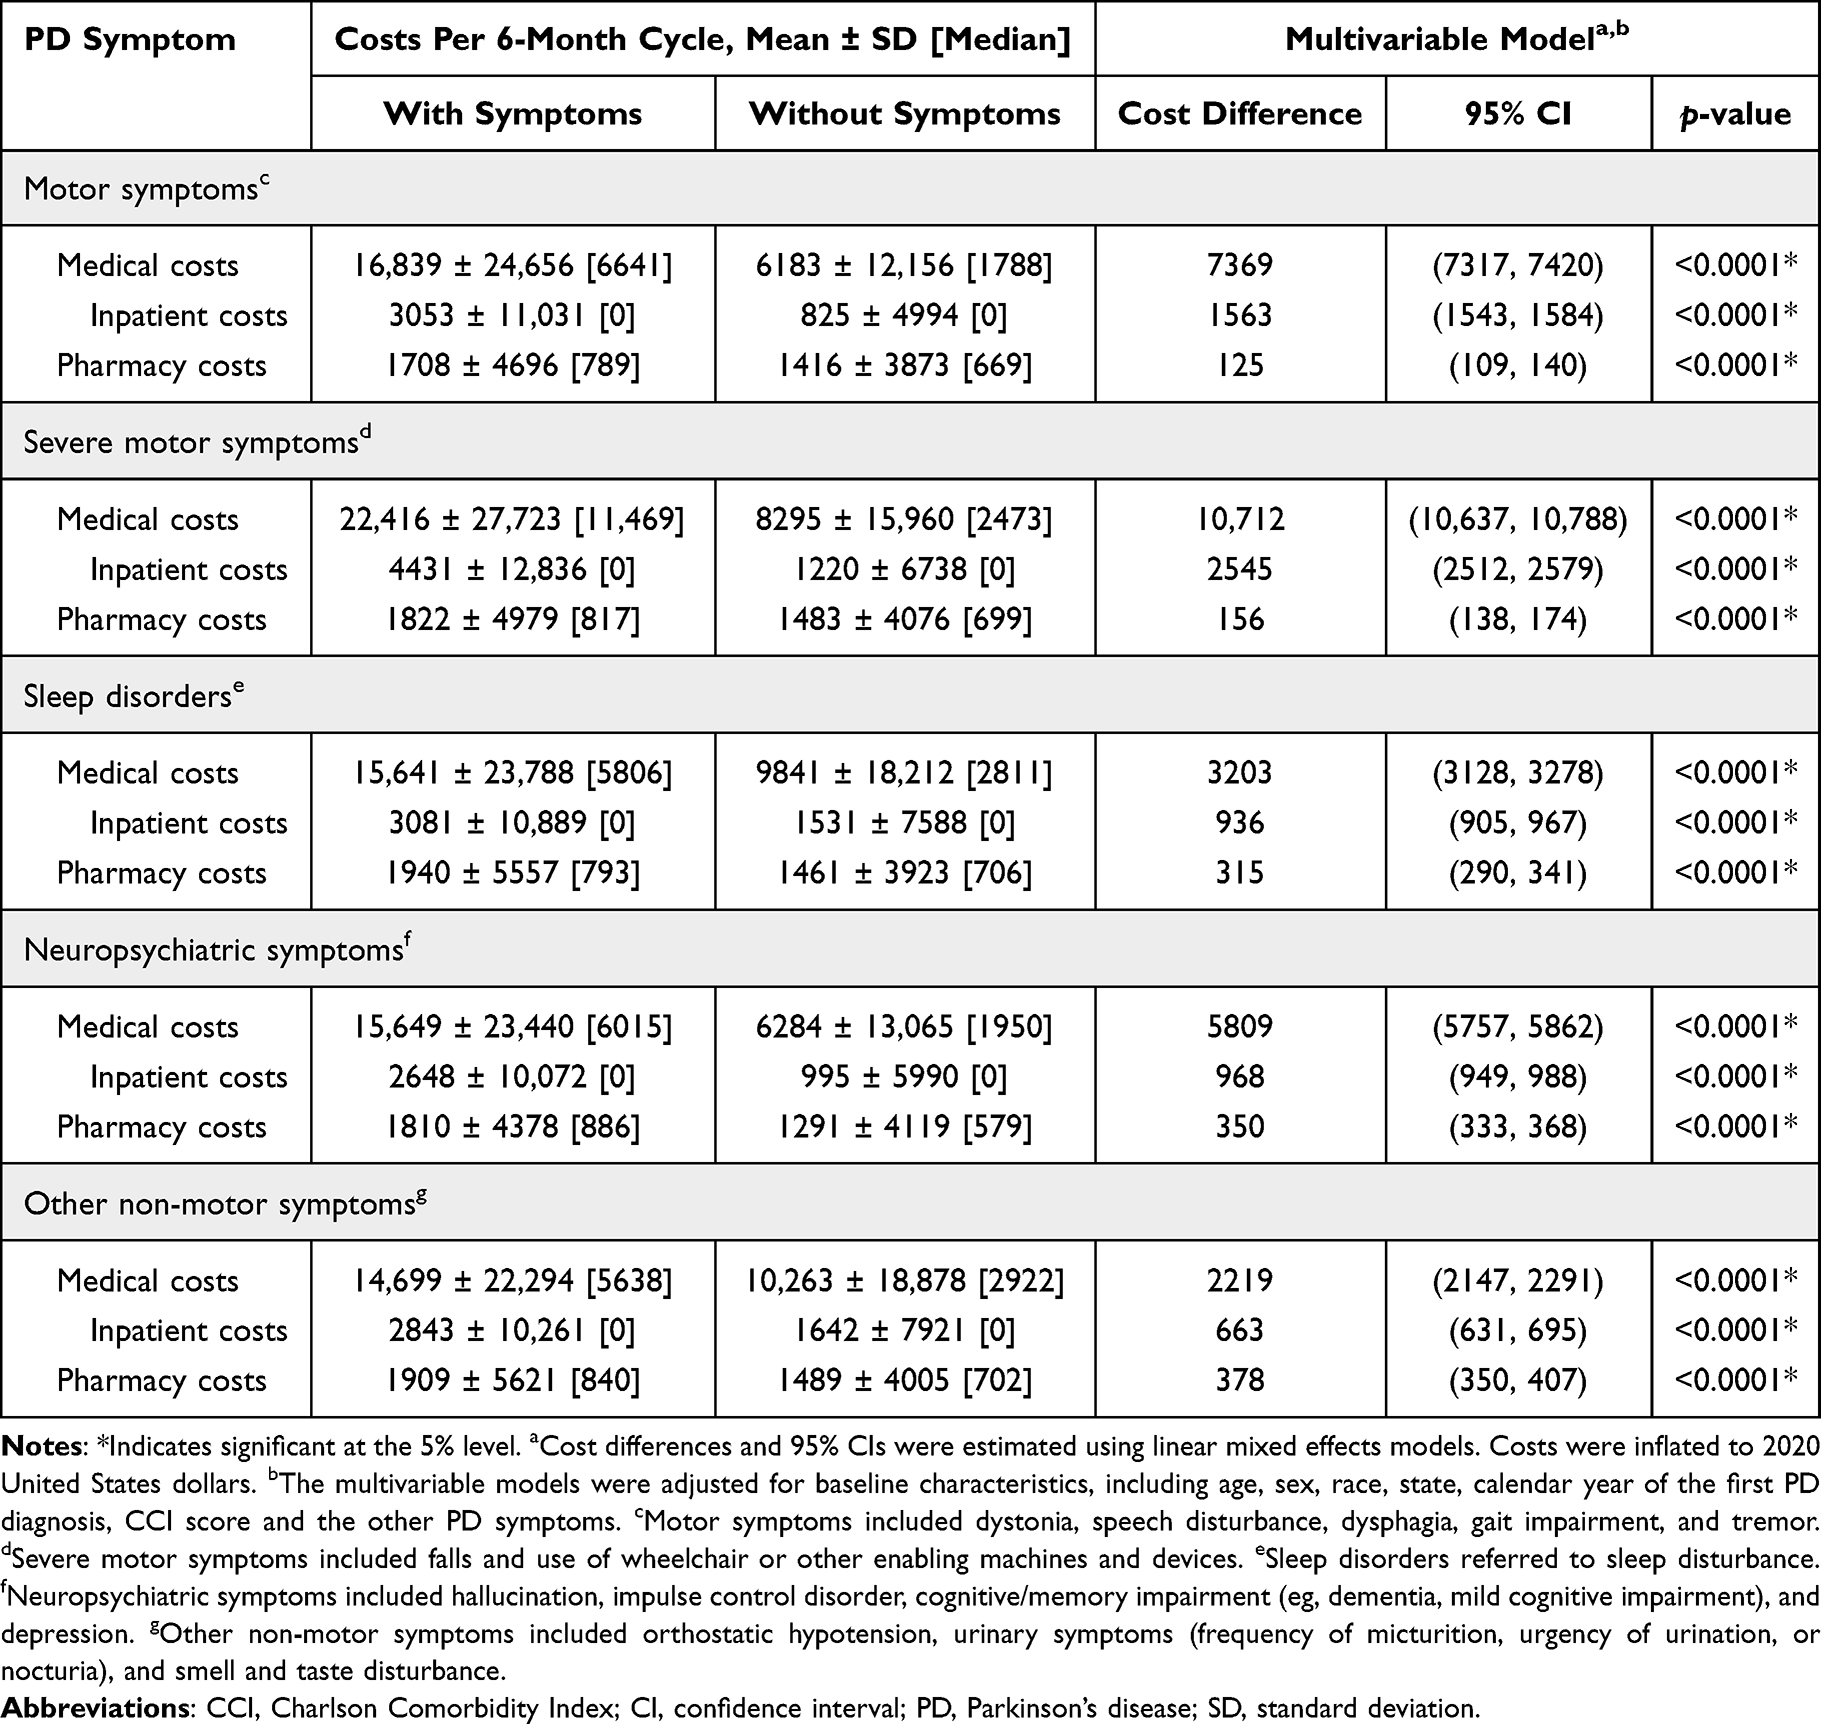 |
Table 4 All-Cause Healthcare Costs Over 6-Month Cycles Associated with PD Symptoms Among Overall Cohort |
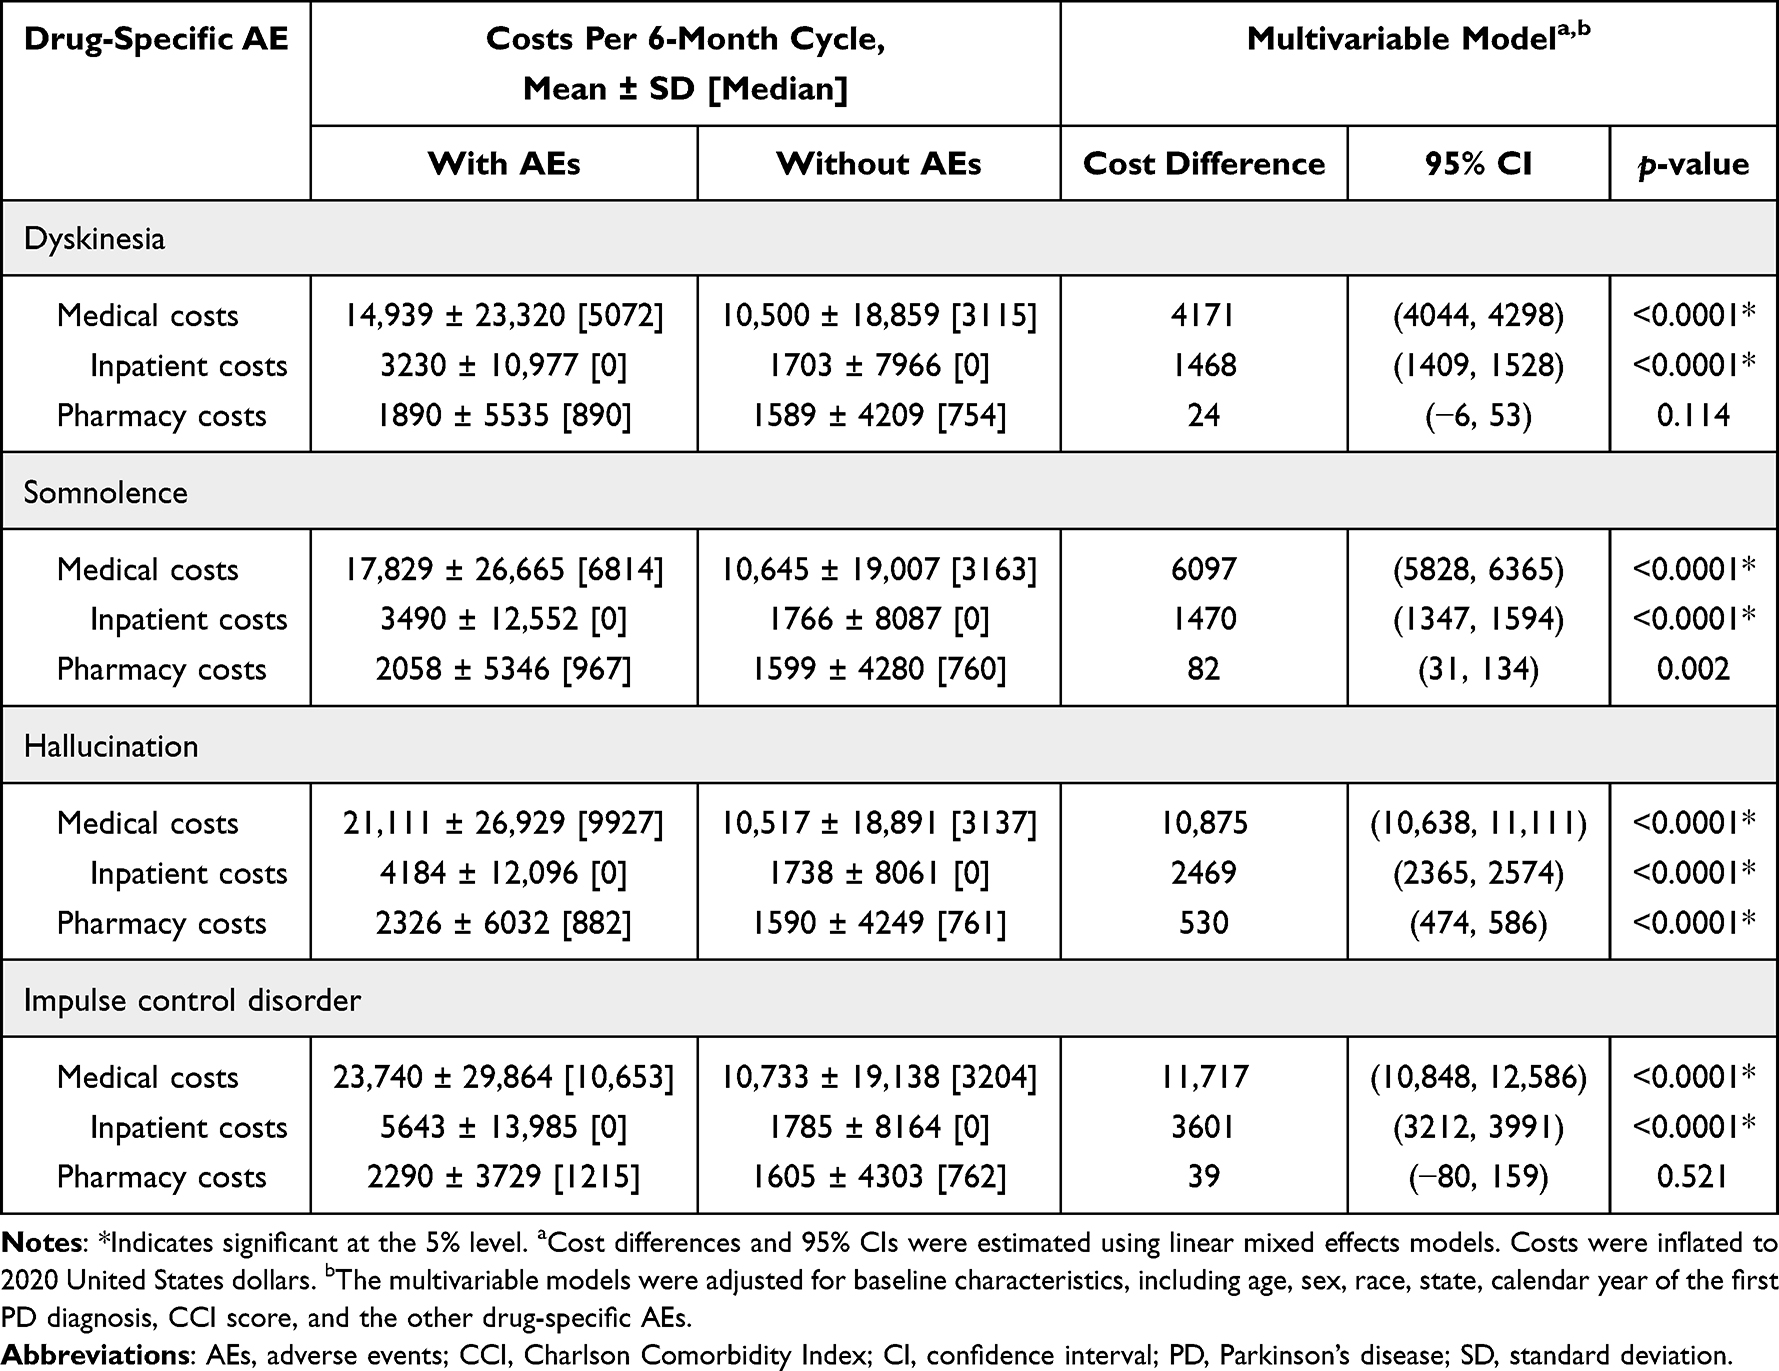 |
Table 5 All-Cause Healthcare Costs Over 6-Month Cycles Associated with Drug-Specific AEs Among Active Treatment Cohort |
All-Cause HRU Associated with PD Symptoms and AEs
In the overall cohort, motor symptoms, severe motor symptoms, and neuropsychiatric symptoms had greater impact on inpatient and SNF/LTC visits, with adjusted IRR ranging from 2.13 to 2.30 for inpatient visits and from 1.33 to 2.14 for SNF/LTC visits during the 6 months cycles with vs without these symptoms (all p<0.0001). Severe motor symptoms had the greatest impact on ER visits, with an adjusted IRR of 2.58 during the 6 months cycles with vs without the symptom (p<0.0001). Conversely, neuropsychiatric symptoms were associated with lower rate of outpatient visits (adjusted IRR: 0.89; p<0.0001), and other non-motor symptoms were associated with lower rate of SNF/LTC visits (adjusted IRR: 0.92; p<0.0001) (Table 2).
In the active treatment cohort, somnolence, hallucination, and impulse control disorder had greater impact on inpatient and SNF/LTC visits, with adjusted IRR ranging from 1.71 to 3.00 for inpatient visits and from 1.35 to 2.12 for SNF/LTC visits during the 6 months cycles with vs without these AEs (all p<0.0001). Impulse control disorder had the greatest impact on ER visits, with an adjusted IRR of 2.24 during the 6 months cycles with vs without the AE (p<0.0001). Conversely, impulse control disorder was associated with lower rate of outpatient visits (adjusted IRR: 0.87; p<0.0001), and dyskinesia was associated with lower rate of SNF/LTC visits (adjusted IRR: 0.97; p<0.0001) (Table 3).
All-Cause Healthcare Costs Associated with PD Symptoms and AEs
In the overall cohort, motor symptoms, severe motor symptoms, and neuropsychiatric symptoms had greater impact on medical and inpatient costs, with adjusted cost differences ranging from $5809 to $10,712 for medical costs and from $968 to $2545 for inpatient costs during the 6 months cycles with vs without the corresponding symptom (all p<0.0001). All PD symptoms were associated with a minor increase in pharmacy costs; the incremental pharmacy costs per 6 months attributable to the presence of PD symptoms ranged from $125 with motor symptoms to $378 with other non-motor symptoms (all p<0.0001) (Table 4).
In the active treatment cohort, somnolence, hallucination, and impulse control disorder had greater impact on medical and inpatient costs, with adjusted difference ranging from $6097 to $11,717 for medical costs and $1470 to $3601 for inpatient costs during the 6 months cycles with vs without the corresponding AE (all p<0.0001). All AEs were associated with a minor increase in pharmacy costs; the incremental pharmacy costs per 6 months attributable to the presence of AEs ranged from $24 (p=0.114) with dyskinesia to $530 with hallucination (p<0.0001) (Table 5).
Discussion
The current large-scale retrospective cohort study among Medicare beneficiaries with PD has found that, while levodopa remains the mainstay of PD management, considerable heterogeneity exists in real-world treatment patterns. Over time, levodopa dosing tends to increase, and treatment duration for all PD therapies generally decreases at later lines of therapy. Importantly, patients with experience of PD symptoms (particularly motor symptoms and severe motor symptoms) as well as AEs related to PD treatments (including dyskinesia, somnolence, hallucination, and impulse control disorder) had overall significantly higher HRU rates and healthcare costs relative to those without the corresponding symptoms or AEs. Notably, a few PD symptoms were associated with lower rates of HRU. One possible reason is that, for instance, patients with neuropsychiatric symptoms tended to have more hospitalizations and long-term care utilization (eg, inpatient and SNF/LTC visits), which may in turn explain the relatively fewer visits for outpatient care. Collectively, the findings of our study suggest that patients with PD require increasing levodopa doses and/or cycle through multiple treatments over time, highlighting the unmet medical needs in PD disease management. Our findings also show that PD treatments with better tolerability profiles are warranted to mitigate the excess HRU and cost burden imposed by AEs, such as impulse control disorder, somnolence, and hallucinations, as observed among patients receiving existing PD medications.
Houghton et al conducted a PD treatment pattern analysis among 68,532 incident patients with commercial insurance in the US between 2008 and 2016.20 Similar to our study, that study found that the most commonly prescribed first treatments were levodopa therapies (defined as levodopa monotherapy or levodopa combination therapies with carbidopa and/or entacapone; 51.0% vs 51.1% for levodopa monotherapy in this study), followed by DAs (11.3% vs 5.9% in this study). However, treatment distribution after the first observed treatment was not reported in that study. The median time to a first PD treatment in the Houghton et al study was slightly over a month (37 days), which was shorter than the currently observed 2.0 months. Notably, younger age was found to be associated with a shorter time to initiation of DAs in the Houghton et al study.20 As that study included a generally younger population that were more likely to receive DAs, the difference in study populations between the studies may partially explain the discrepancy in the time to PD treatment initiation observed.
Our study found that levodopa doses increased over time, which is echoed in a previous retrospective chart review study evaluating levodopa treatment patterns among 95 patients with PD across 18 US clinics.21 Although the specific levodopa doses were not reported in that study, dose escalation was the most commonly documented treatment change over the 5-year follow-up period, with most dose escalations occurring within the first 6 months of treatment. In line with that finding, the magnitudes of increases in levodopa doses in our study also appeared the largest during the first year of treatment relative to subsequent years.
PD has been shown to be a costly disease.13 Specifically, Medicare beneficiaries with PD have been reported to incur higher healthcare costs compared with those without PD.14,15 Furthermore, the incremental costs of PD have also been shown to increase over time and with more advanced disease.17,18 While the overarching observations of our study corroborate the literature evidence on the excess burden imposed by PD, our study is the first to quantify the economic burden associated with PD symptoms and AEs of PD treatments using a representative population in the 100% Medicare FFS data. Thus, this study expands the literature by delineating the incremental HRU and healthcare cost burden attributable to specific PD symptoms and treatment-related AEs, which provides insight on their relative importance in routine PD management. Our study results may also be used by healthcare payers to estimate the expected real-world HRU and costs that their enrollees with PD may incur over the course of their disease.
Our study used Medicare data to obtain comprehensive information on treatments, HRU, and costs for a large PD cohort in a real-world setting. Furthermore, the use of longitudinal data and mixed effect models allowed the illustration of long-term economic burden of patients with PD. Nonetheless, the findings of this study should be interpreted in the context of certain limitations. For example, the study population comprised Medicare beneficiaries aged 65 years and older; thus, the findings may not be generalizable to all US patients with PD. Similarly, a higher-than-expected ratio of female to male with PD was observed in the data (about 1:1 vs the established 2:3),7 which could be due to the generally higher utilization of healthcare resources among female than male patients22 or the higher proportion of female enrolled in the Medicare program;23 it is also noted that there could be gender differences in response to PD medications.24 Hence, caution should be exercised when considering the current findings outside of the Medicare population. Furthermore, despite requiring at least two PD diagnosis codes as inclusion criteria, some misdiagnosed patients could have been included. As claims data contained diagnostic and procedure codes recorded for reimbursement purposes, not all variables of interest (eg, reasons for treatment discontinuation and severity of PD) were available. Identification of PD treatments, symptoms, and AEs might be subject to coding errors or data omission; as such, the absence of information may not necessarily indicate an absence of the treatment or condition. While the proportion of patients with PD who had no observed treatment may be higher than expected, other claims-based studies have similarly reported a substantial portion of patients whose treatments were not observed.20,25 Meanwhile, patients might not have used the recorded medication as prescribed after filling a prescription. Due to the observational design, causal relationships between recorded symptoms/AEs and healthcare burden could not be established. Lastly, there could be residual confounding due to unmeasured confounders, as confounding adjustments could only account for factors that were observable and recorded in the Medicare database.
Conclusions
While levodopa remains the mainstay of PD management among Medicare beneficiaries in the US, considerable heterogeneity exists in real-world treatment patterns. PD symptoms, especially motor symptoms and severe motor symptoms, as well as AEs related to PD treatments, were associated with significantly higher HRU and healthcare costs among patients with PD, suggesting there remains unmet need for PD treatments with better tolerability profiles to improve disease management.
Abbreviations
AE, adverse events; CCI, Charlson Comorbidity Index; CI confidence intervals; DA, dopamine agonists; ER, emergency room; FFS, fee-for-service; HRU, healthcare resource utilization; IRR, incidence rate ratio; KM, Kaplan–Meier; PD, Parkinson’s disease, PDC, proportion of days covered; SD, standard deviation; US, United States.
Data Sharing Statement
The data that support the findings of this study are available from the Centers for Medicare & Medicaid Services (CMS). Restrictions apply to the availability of these data, which were used under license for this study. Data are available from the authors with the permission of CMS.
Ethics Approval and Informed Consent
The data were de-identified and complied with the Health Insurance Portability and Accountability Act and the Declaration of Helsinki; therefore, an institutional review board exemption was obtained per Title 45 of CFR, Part 46.101(b)(4).19
Acknowledgments
Medical writing assistance was provided by Flora Chik, PhD, MWC, an employee of Analysis Group, Inc., a consulting company that has provided paid consulting services to Cerevel Therapeutics, which funded the development and conduct of this study and manuscript. The authors thank Erin Cook, Louise Yu, Ali Greatsinger, Miriam Ellis, who are employees of Analysis Group, Inc., for the support in design and execution of the study.
Author Contributions
All authors made a significant contribution to the work reported, whether that is in the conception, study design, execution, acquisition of data, analysis and interpretation, or in all these areas; took part in drafting, revising or critically reviewing the article; gave final approval of the version to be published; have agreed on the journal to which the article has been submitted; and agree to be accountable for all aspects of the work.
Funding
This study was supported by Cerevel Therapeutics. The sponsor also funded the journal’s article processing charges.
Disclosure
Yan Song, Tracy Guo, and Eric Wu are employees of Analysis Group, Inc., and Jian-Yu E is a former employee of Analysis Group, Inc., a consulting company that has provided paid consulting services to Cerevel Therapeutics, which funded the development and conduct of this study and manuscript. Rahul Sasane, Steve Arcona, and Nirmal Keshava are employees of Cerevel Therapeutics and may own stock and/or stock options of the company. The authors report no other conflicts of interest in this work.
References
1. Collaborators GUND, Feigin VL, Vos T, et al. Burden of neurological disorders across the US from 1990–2017: a Global Burden of Disease study. JAMA Neurol. 2021;78(2):165–176. doi:10.1001/jamaneurol.2020.4152
2. Connolly BS, Lang AE. Pharmacological treatment of Parkinson disease: a review. JAMA. 2014;311(16):1670–1683. doi:10.1001/jama.2014.3654
3. de Lau LM, Breteler MM. Epidemiology of Parkinson’s disease. Lancet Neurol. 2006;5(6):525–535. doi:10.1016/s1474-4422(06)70471-9
4. de Lau LM, Giesbergen PC, de Rijk MC, Hofman A, Koudstaal PJ, Breteler MM. Incidence of parkinsonism and Parkinson disease in a general population: the Rotterdam Study. Neurology. 2004;63(7):1240–1244. doi:10.1212/01.wnl.0000140706.52798.be
5. Massano J, Bhatia KP. Clinical approach to Parkinson’s disease: features, diagnosis, and principles of management. Cold Spring Harb Perspect Med. 2012;2(6):a008870. doi:10.1101/cshperspect.a008870
6. Jankovic J, Tan EK. Parkinson’s disease: etiopathogenesis and treatment. J Neurol Neurosurg Psychiatry. 2020;91(8):795–808. doi:10.1136/jnnp-2019-322338
7. Kalia LV, Lang AE. Parkinson’s disease. Lancet. 2015;386(9996):896–912. doi:10.1016/S0140-6736(14)61393-3
8. Nonnekes J, Timmer MH, de Vries NM, Rascol O, Helmich RC, Bloem BR. Unmasking levodopa resistance in Parkinson’s disease. Mov Disord. 2016;31(11):1602–1609. doi:10.1002/mds.26712
9. Riederer P, Laux G. MAO-inhibitors in Parkinson’s Disease. Exp Neurobiol. 2011;20(1):1–17. doi:10.5607/en.2011.20.1.1
10. Song Z, Zhang J, Xue T, et al. Different catechol-o-methyl transferase inhibitors in Parkinson’s disease: a Bayesian network meta-analysis. Front Neurol. 2021;12:707723. doi:10.3389/fneur.2021.707723
11. Borovac JA. Side effects of a dopamine agonist therapy for Parkinson’s disease: a mini-review of clinical pharmacology. Yale J Biol Med. 2016;89(1):37–47.
12. Moore TJ, Glenmullen J, Mattison DR. Reports of pathological gambling, hypersexuality, and compulsive shopping associated with dopamine receptor agonist drugs. JAMA Intern Med. 2014;174(12):1930–1933. doi:10.1001/jamainternmed.2014.5262
13. Yang W, Hamilton JL, Kopil C, et al. Current and projected future economic burden of Parkinson’s disease in the U.S. NPJ Parkinsons Dis. 2020;6(1):15. doi:10.1038/s41531-020-0117-1
14. Kaltenboeck A, Johnson SJ, Davis MR, et al. Direct costs and survival of medicare beneficiaries with early and advanced Parkinson’s disease. Parkinsonism Relat Disord. 2012;18(4):321–326. doi:10.1016/j.parkreldis.2011.11.015
15. Noyes K, Liu H, Li Y, Holloway R, Dick AW. Economic burden associated with Parkinson’s disease on elderly Medicare beneficiaries. Mov Disord. 2006;21(3):362–372. doi:10.1002/mds.20727
16. Rubenstein LM, DeLeo A, Chrischilles EA. Economic and health-related quality of life considerations of new therapies in Parkinson’s disease. PharmacoEconomics. 2001;19(7):729–752. doi:10.2165/00019053-200119070-00003
17. Albarmawi H, Zhou S, Shulman LM, et al. The economic burden of Parkinson disease among Medicare beneficiaries. J Manag Care Spec Pharm. 2022;28(4):405–414. doi:10.18553/jmcp.2022.28.4.405
18. Dahodwala N, Li P, Jahnke J, et al. Burden of Parkinson’s disease by severity: health care costs in the U.S. Medicare population. Mov Disord. 2021;36(1):133–142. doi:10.1002/mds.28265
19. U.S. Department of Health and Human Services. 45 CFR 46: pre-2018 requirements. Available from: https://www.hhs.gov/ohrp/regulations-and-policy/regulations/45-cfr-46/index.html#46.101.
20. Houghton R, Boess F, Verselis L, et al. Treatment patterns in patients with incident Parkinson’s disease in the United States. J Parkinsons Dis. 2019;9(4):749–759. doi:10.3233/JPD-191636
21. Navaratnam P, Arcona S, Friedman HS, Leoni M, Sasane R. Levodopa treatment patterns in Parkinson’s disease: a retrospective chart review. Clin Park Relat Disord. 2022;6:100135. doi:10.1016/j.prdoa.2022.100135
22. Bertakis KD, Azari R, Helms LJ, Callahan EJ, Robbins JA. Gender differences in the utilization of health care services. J Fam Pract. 2000;49(2):147–152.
23. Tarazi W, Welch WP, Nguyen N, et al. Medicare beneficiary enrollment trends and demographic characteristics. The Assistant Secretary for Planning and Evaluation (ASPE), U.S. Department of Health and Human Services; 2022. Available from: https://aspe.hhs.gov/sites/default/files/documents/f81aafbba0b331c71c6e8bc66512e25d/medicare-beneficiary-enrollment-ib.pdf.
24. Cerri S, Mus L, Blandini F. Parkinson’s disease in women and men: what’s the difference? J Parkinsons Dis. 2019;9(3):501–515. doi:10.3233/JPD-191683
25. Kalilani L, Friesen D, Boudiaf N, Asgharnejad M. The characteristics and treatment patterns of patients with Parkinson’s disease in the United States and United Kingdom: a retrospective cohort study. PLoS One. 2019;14(11):e0225723. doi:10.1371/journal.pone.0225723
 © 2023 The Author(s). This work is published and licensed by Dove Medical Press Limited. The full terms of this license are available at https://www.dovepress.com/terms.php and incorporate the Creative Commons Attribution - Non Commercial (unported, v3.0) License.
By accessing the work you hereby accept the Terms. Non-commercial uses of the work are permitted without any further permission from Dove Medical Press Limited, provided the work is properly attributed. For permission for commercial use of this work, please see paragraphs 4.2 and 5 of our Terms.
© 2023 The Author(s). This work is published and licensed by Dove Medical Press Limited. The full terms of this license are available at https://www.dovepress.com/terms.php and incorporate the Creative Commons Attribution - Non Commercial (unported, v3.0) License.
By accessing the work you hereby accept the Terms. Non-commercial uses of the work are permitted without any further permission from Dove Medical Press Limited, provided the work is properly attributed. For permission for commercial use of this work, please see paragraphs 4.2 and 5 of our Terms.