")
Back to Journals » Journal of Inflammation Research » Volume 14
Platelet Mediated Inflammation in Coronary Artery Disease with Type 2 Diabetes Patients
Authors Johny E, Bhaskar P, Alam MJ, Kuladhipati I, Das R, Adela R
Received 29 June 2021
Accepted for publication 19 August 2021
Published 7 October 2021 Volume 2021:14 Pages 5131—5147
DOI https://doi.org/10.2147/JIR.S326716
Checked for plagiarism Yes
Review by Single anonymous peer review
Peer reviewer comments 3
Editor who approved publication: Professor Ning Quan
Ebin Johny,1 Pathoori Bhaskar,1 Md Jahangir Alam,2 Indra Kuladhipati,3 Rupam Das,3 Ramu Adela1
1Department of Pharmacy Practice, National Institute of Pharmaceutical Education and Research (NIPER)-Guwahati, Guwahati, Assam, 781101, India; 2Department of Biotechnology, National Institute of Pharmaceutical Education and Research (NIPER)-Guwahati, Guwahati, Assam, 781101, India; 3Down Town Hospital, Guwahati, Assam, 781006, India
Correspondence: Ramu Adela
Department of Pharmacy Practice, National Institute of Pharmaceutical Education and Research (NIPER)-Guwahati, Sila Katamur (Halugurisuk), Changsari, Kamrup, Guwahati, Assam, 781101, India
Tel +91 8860280242
Email [email protected]
Background: Type 2 diabetes mellitus (T2DM) is a well-established risk factor for the development of atherosclerotic coronary artery disease. Platelet hyperactivity and inflammation are associated with the development of coronary artery disease (CAD) in T2DM patients. We investigated the status of immune cells, platelet activation, and platelet-immune cell interactions in T2DM_CAD patients.
Methodology: The study population consisted of four groups of subjects, healthy control (CT, n = 20), T2DM (n = 44), CAD (n = 20) and T2DM_CAD (n = 38). Platelet activation, immunome profiling and platelet-immune cell interactions were analysed by flow cytometry. The circulatory levels of inflammatory cytokines/chemokines were assessed using multiplex assay.
Results: Increased platelet activation and increased platelet-immune cell aggregate formation were observed in T2DM and T2DM_CAD groups compared to the control and CAD groups (p < 0.05). Our immunome profile analysis revealed, altered monocyte subpopulations and dendritic cell populations in T2DM, CAD and T2DM_CAD groups compared to the control group (p < 0.05). Furthermore, significantly increased IL-1β, IL-2, IL-4, IL-6, IL-8, IL12p70, IL-13 IL-18, CCL2, and decreased CXCL1, CCL5 levels were observed in T2DM_CAD group compared to the control group. Our ex-vivo study increased platelet-monocyte aggregate formation was observed upon D-glucose exposure in a time and concentration dependent manner.
Conclusion: Our data suggests that T2DM, CAD and T2DM_CAD are associated with altered immune cell populations. Furthermore, it has been confirmed that hyperglycemia induces platelet activation and forms platelet-immune cell aggregation which may lead to the release of inflammatory cytokines and chemokines and contribute to the complexity of CAD and type 2 diabetes.
Keywords: platelet, inflammation, monocytes, hyperglycemia, type 2 diabetes, coronary artery disease
Introduction
Type 2 diabetes is a chronic metabolic disorder characterised by insulin resistance and is a leading cause of non-communicable related death worldwide.1 Diabetes remains a major health concern around the globe with an estimated diabetes prevalence of 463 million of the adult population and accounts for 10% of global health spending with a calculated value of USD 760 billion annually.2 The adult population with diabetes exhibits a two to four fold increased risk of developing cardiovascular diseases as compared to non-diabetes patients.3 In the diabetic condition, insulin resistance alters glucose metabolism, resulting in hyperglycemia, which triggers oxidative stress, inflammation, and endothelial dysfunction which together leads to the development of atherosclerotic coronary artery diseases (CAD).4 Studies proved that diabetes is clearly linked with the innate immune system, and the release of cytokines from the activated immune cells contribute to the development of coronary artery disease in these patients.5–7 Recently, our team has observed that type 2 diabetes patients with coronary artery disease have altered circulatory discharge of pro-inflammatory and anti-inflammatory markers. In addition, secreted inflammatory markers which have been known to be associated with systemic inflammation and insulin resistance.8
Platelets are tiny blood cells with diverse vascular functions and are involved in the pathogenesis of various vascular inflammatory diseases.9,10 Platelets are also gaining recognition as immune cells and are observed to play a crucial role in the initiation and progression of diabetes-induced cardiovascular complications.11 Platelet activation has been reported in T2DM patients together with other prothrombotic factors.12,13 In the diabetes condition, activated platelets mediate the initiation and progression of cardiovascular diseases by inducing thrombus formation as well as inflammation and microcapillary embolization.11,13 Various signalling molecules released from different platelet compartments as a result of downstream signalling pathways of platelet activation have direct involvement in inflammation.14 Further, activated platelets communicate with neighbouring platelets and other circulating immune cells through direct interaction with soluble molecules and cytokines.15 However, the link between platelet activation, and platelet-immune cell interaction during the inflammation process in type 2 diabetes associated coronary artery disease (T2DM_CAD) is not well established. Hence, we intend to study the possible link between platelets and inflammation in coronary artery diseases with T2DM.
In this study, we analysed platelet activation, immunome profiling, and the interaction of platelets with different immune cells in healthy controls, T2DM, CAD and T2DM_CAD subjects. Furthermore, we attempted to determine the relationship between hyperactivated platelets and inflammation markers which will provide insight into the pathophysiology, and strategies for the prevention and treatment of coronary artery diseases in type 2 diabetes.
Materials and Methods
Patient Selection and Informed Consent Process
The cross-sectional study was conducted from August 2019 to January 2021 and included a total of 122 subjects consisting of four groups aged between 35 and 65 years who were randomly recruited from Downtown Hospital, Guwahati, Assam. The study conformed to the principles outlined in the Declaration of Helsinki and was approved by the Institutional Ethics Committee of Downtown Hospital (Ethics committee approval No: EC/DTH/CT/2018/07). All subjects were given detailed information about the study and informed consent was obtained from each study participant. An overview of the workflow of the study is depicted in Figure 1.
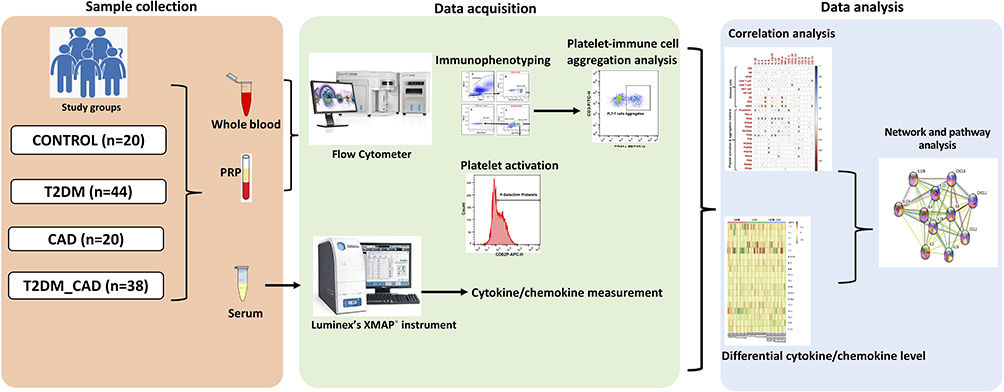 |
Figure 1 Overview of clinical study design, data acquisition and data analysis plan. |
Inclusion and Exclusion Criteria for Selection of Study Subjects
Group 1: Control (n = 20). Age and sex matched subjects with no prior history of T2DM, hypertension, CAD or other chronic diseases and were not taking any medication for the past 30 days of sample collection. Blood glucose, HbA1c and biochemical parameters were in normal ranges. Group 2: T2DM (n = 44). Subjects with glycated haemoglobin (HbA1c) levels ≥6.5% according to the American Diabetes Association (ADA) guidelines with a proven history of T2DM without any other complications were included from the Department of Diabetology, Downtown Hospital. Group 3: CAD (n = 20). Subjects with blockade or narrowing of one or more epicardial coronary arteries with more than 25% stenosis shown on coronary angiography and diagnosed CAD by a cardiologist according to European society of cardiology guideline. CAD subjects recruited from in patient and cardiac catheterization unit of Downtown Hospital. This group of patients did not have a history of T2DM. Group 4: T2DM_CAD (n = 38). Subjects were diagnosed with CAD as defined in Group 3 and had an additional prior history of type 2 diabetes with HbA1c levels ≥6.5%. The exclusion criteria for the present study were clinical or laboratory evidence of renal failure, liver failure, type 1 diabetes, pregnancy, thyroid disease, cancer or malignancy and other chronic complications.
Sample Collection Process
Clinical history and physical examinations were collected and conducted for all patients. Total 10 mL of blood was collected by venipuncture after overnight fasting using Becton Dickinson Vacutainer® tubes (ACD and serum). The samples were immediately processed for flow cytometry analysis. Further, serum was isolated and stored in −80oC deep freezer for future analysis.
Clinical and Biochemical Parameters Measurement
Height and weight, hip and waist circumference were measured using standardised techniques. Body mass index (BMI) was calculated by dividing weight in kilograms (kg) with square of height in meters (m2). Waist to hip ratio was calculated by dividing waist circumferences by hip circumference. The mean of repeated triplicate blood pressure measurements was taken using Omron HEM automated BP monitor. Fasting blood glucose (FBG) levels were measured using an Accu-chek active glucose monitor. HbA1c was measured using Xpress A1C analyser (Accurex Biomedical Pvt. Ltd). Complete blood count was performed using ADVIA 2120i Haematology system (Siemens Healthineers, Germany). Serum biochemical parameters such as creatinine, total cholesterol, high density lipoprotein, low density lipoprotein, triglycerides and uric acid levels were analysed using an Erba Chem 7 Biochemistry Analyser (Transasia Bio-Medicals, India).
Sample Preparation for Flow Cytometry Analysis
Flow cytometry was performed to detect platelet activation status, immunophenotyping or immunome profiling and platelet-immune cell interaction. A total of 8 mL of blood sample was collected in ACD tubes (BD Vacutainer® ACD tubes). All these studies were carried out within 2 h of blood collection and efforts were made to avoid platelet activation during sample handling.
Quantification of Platelet Activation Status
Platelet rich plasma (PRP) was isolated from whole blood by centrifugation at 500 rpm for 10 min. Further, 25 µL of PRP was incubated with platelet activation markers ie, PAC-1-FITC (BD, cat no: 340507), and P-selectin (CD62P)-APC (BD, Cat no: 550888) for 20 min at room temperature, washed with phosphate buffered saline, re-suspended and analysed using an Attune NxT flow cytometer (Thermo Fisher Scientific, Singapore). Platelets were identified based on forward scatter (FSC) and side scatter (SSC) characteristics (Figure 2A). Percentage of CD62P-positive (Figure 2B) and PAC-1 positive (Figure 2C) platelets were calculated with the use of unstained control.
 |
Figure 2 Measurement of platelets activation. (A) Identification of platelets according to their forward scatter and side scatter characteristic from platelet rich plasma. (B) CD62P (P-selectin) positive and (C) Pac-1 positive platelets were assessed from the platelet population. Comparison of percentage of (D) P-selectin positive platelets and (E) PAC-1 positive platelets in disease group also shown. One-way ANOVA used for comparisons between the study groups and p < 0.05 was considered significant. *p < 0.05, **p < 0.01, ***p < 0.001. |
Immunome Profiling and Platelet-Immune Cell Aggregate Formation Analysis
Immunome profiling and platelet-immune cell interaction studies are carried out with total 600 µL of whole blood and red blood cells (RBCs) were lysed before the experiment. Cells were suspended in PBS with 1% w/v bovine serum albumin. Further, incubated with antibodies for 20 minutes at room temperature, washed with PBS, re-suspended in PBS and analysed in an Attune NxT flow cytometer. For compensation purposes, unstained and single antibody stained cells were used. Work was divided into three panels as described in Table 1. Each panel consists of one stained and unstained sample. Leucocytes were identified based on the forward scatter (FSC) and side scatter (SCC) characteristics and the same was confirmed using specific cell surface markers. Monocytes were identified based on FSC vs SSC, were confirmed by CD14 APC Cy 7 and further subdivided based on their differential expression of CD14 and CD16 into classical (CD14++ CD16-), intermediate (CD14++ CD16+) and non-classical (CD14+ CD16++) monocytes. Similarly, T cells were confirmed by their surface expression of CD3 from lymphocytes populations. Further, gated to obtain CD4 T cells (T-helper cells, CD3+ CD4+), CD8 T cells (cytotoxic T cells, CD3+ CD8+) and natural killer T cells (CD3+ CD56+). From the CD3-ve cells natural killer cells (CD3- CD56+) were also identified. Dendritic cells (lineage– HLA DR+) were identified from WBC populations were further subdivided into myeloid (HLA DR+ CD11C+) and plasmacytoid (HLA DR+ CD123+) dendritic cells. The overall gating scheme for the characterisation and phenotyping of immune cells is shown in Figure 3. Platelet surface marker ie, CD41a–PECY5 (BD, cat no: 559768) was included in each of the panels to detect platelet-immune cell interaction. The percentage of immune cells showing aggregate formation with platelets was determined by the fluorescence minus one (FMO) method. (Figure 4 and Figure S1). All flow cytometry data analysis was performed using AttuneTM NxT software v3.1.2.
 |
Table 1 Summary of Antibodies/Fluorochromes Used in This Study |
 |
Figure 3 Immunome profiling of monocytes, T lymphocytes, natural killer cells and dendritic cells. (A) Granulocytes, monocytes and lymphocytes were gated based on the forward scatter and side scatter characteristic from RBC lysed blood. (B) Confirmed monocyte (CD14+) (C) were gated further to get its subpopulation based on relative expression of CD16, and CD14. (D) NK cells were identified from CD3-ve population. (E) Lymphocytes were gated into CD3+ve (T cells) and CD3-ve cells. (F) CD3+ cells were further gated into T helper (CD4+), cytotoxic T cell (CD8+) and (G) NKT cells (CD56+). (H) Lineage -ve cells were identified. Lineage negative cells were gated into (I) dendritic cells and further into (J) plasmacytoid and myeloid dendritic cells. Comparison of percentage (K) classical monocytes, (L) intermediate monocytes, (M) non-classical monocytes, (N) CD4 T cells, (O) CD8 T cells, (P) NKT cells, (Q) NK cells, (R) total dendritic cells, (S) plasmacytoid dendritic cells, (T) myeloid dendritic cells in control, T2DM, CAD and T2DM_CAD groups. One-way ANOVA used for comparisons between the groups and p < 0.05 considered significant. *p < 0.05, **p < 0.01, ***p < 0.001. |
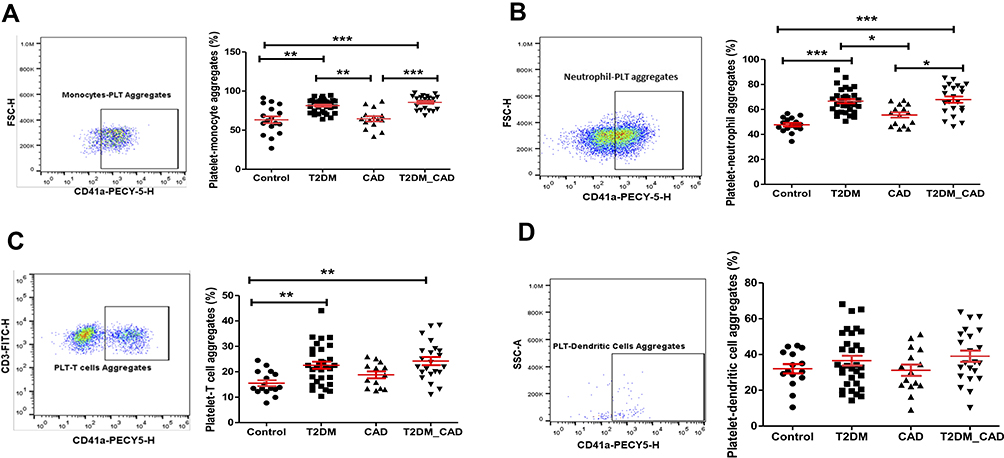 |
Figure 4 Measurement of platelet aggregation with immune cells. CD41a positive populations were identified as platelet and corresponding innate immune cell aggregate. Comparison of percentage of platelet aggregation with (A) monocytes (PMA), (B) neutrophils (PNA), (C) T cells (PTA), and (D) dendritic cells (PDA) in disease group. One-way ANOVA used for comparisons between the groups and p < 0.05 considered as significant. *p < 0.05, **p < 0.01, ***p < 0.001. |
Measurement of Circulatory Inflammatory Markers
Serum levels of 20 cytokines and chemokines ie, IL-1β, IL-2, IL-4, IL-5, IL-6, IL-8, IL-12p70, IL-13, IL-18, TNFα, IFN-γ, GM-CSF, CXCL-1, CXCL-10, CXCL-12, CCL-2, CCL-3, CCL-4, CCL-5, and CCL-11 were measured using Invitrogen ProcartaPlex multiplex immunoassays kit (Cat#EPX200-12173-901). On the day of experiment stored serum samples were further thawed, vortexed and centrifuged at 10,000 rpm to isolate debris. All the experiments were performed according to manufacturer's instructions using handheld magnetic separator bloc and analyzed using Magpix® Luminex’s XMAP® instrument. All cytokine/chemokine standards were provided by the manufacturers. Serum sample size used for the analysis was 25 µL and 100 events per bead were acquired. Mean fluorescence intensity (MFI) was measured using xPOTENT MAGPIX software version 4.2. Two of the 20 cytokines analyzed (IL-5 and GM-CSF) were excluded from further analysis since more than 95% of analyte concentration was below the lowest standard or its maximum fluorescence intensity value near to background. All the serum samples (control (n = 20), T2DM (n = 20), CAD (n = 20) and T2DM_CAD (n = 20) were measured in singlet whereas standards and blanks were measured in duplicate.
Protein-Protein Interaction Network Analysis
In order to understand protein-protein interactions among all the differentially expressed cytokines and chemokines (as well as significantly correlated with platelet activation and interaction with leukocytes) and proteins in T2DM_CAD group, network analysis was done using the interaction data from the STRING database (https://string-db.org) (v. 11) using a medium confidence level (<0.4). Significantly enriched, interesting GO Biological Processes and KEGG pathway terms were annotated according to the STRING (https://string-db.org/) and DAVID (https://david.ncifcrf.gov/) database for the GO Biological processes and KEGG pathways using a Homo sapiens genome as background.16,17 A p-value threshold of <0.05 was set and important processes were chosen for display in a bubble diagram plotted by Ggplot2 package of R language (v. 3.3.2).
Ex-vivo Platelet-Peripheral Blood Mononuclear Cells (PBMC) Interaction
To examine the influence of hyperglycemia on platelet aggregate formation with monocytes, PBMCs and platelets were collected from the healthy volunteers and further maintained at 37 °C in 5% CO2 atmosphere. Cells were incubated with different D-Glucose concentrations ie, 5 mmol/L, 15 mmol/L and 30 mmol/L for different time periods ie, 1 hr, 2 hr, 4 hr, 6 hr and 8 hr. Further cells were recovered by centrifugation and fixed with 4% paraformaldehyde. Cells were washed and used for flowcytometric analysis. For flowcytometric analysis, cells were incubated with CD14 APC CY7 (monocyte marker) and CD41a PECY 5 (platelet marker) in PBS with 1% BSA for 30 minutes. Cells were further washed with PBS, re-suspended and analysed using Attune NxT flow cytometer.
Confocal Florescence Microscopy Analysis
Monocytes isolated from PBMC by adherent method were incubated with platelets in different glucose concentrations (5 mmol/L, 15 mmol/L and 30 mmol/L.). Cells were fixed after 4 hrs of incubation, followed by washing with PBS and stained with rhodamine phalloidin (F-actin, red) and DAPI (nuclei, blue) in PBS with 1% BSA solution. Cells were washed with PBS and images were acquired using Leica DMi8 Confocal Laser Scanning Microscope.
Statistical Analysis, Classification and Visualization
Normally distributed variables were represented as mean ± standard deviation whereas non-normally distributed variables were summarised as median and interquartile range. One-way analysis of variance (ANOVA) was used to determine the significant differences between the means of four independent groups (control, T2DM, CAD, T2DM_CAD). One-way ANOVA with Bonferroni test was used for comparing normally distributed variables. Non-normally distributed variables were compared by the Kruskal–Wallis test with post-hoc Dunn’s multiple comparison test. Different heat map visualisations were made using the “pheatmap” v1.0.12 package of R programming interface. In order to calculate the fold change, the median values of each parameter obtained across all the healthy controls were used. The fold change of a given parameter for a given patient (T2DM, CAD, T2DM_CAD) was then obtained as the log-ratio of the value of the parameter of that patient divided by the control-median corresponding to the parameter. The Spearman rank correlation coefficients and the corresponding p-values between immune cells, platelet activation markers clinical parameters and serum inflammatory markers were calculated using the “rcorr” function from the “hmisc” package of R program. The correlation plots were generated with the “corrplot” v0.84 package. R value 0.3 was set as the threshold and values of p < 0.05 were considered statistically significant. Univariate and multivariable logistic regression analyses were performed to identify the association of platelet indices with disease groups on the basis of their significance (p < 0.05). ORs with 95% CIs were used to report the results.
Results
Clinical Characteristics of the Study Population
A total of 122 subjects consisting of four groups, ie, control (n = 20), T2DM (n = 44), CAD (n = 20), T2DM_CAD (n = 38). The anthropometric, clinical and biochemical characteristics of the study groups are presented in Table 2. Fasting blood sugar and glycated haemoglobin were significantly higher in T2DM and T2DM_CAD groups as compared with the control and CAD groups. Systolic BP was significantly higher in CAD and T2DM_CAD groups as compared with the control group (p < 0.05). Lipid parameters such as total cholesterol and triglycerides levels significantly increased in T2DM and T2DM_CAD, whereas increased low density lipoprotein (LDL) levels were observed only in T2DM_CAD as compared to control group. However, there were no significant difference in differential blood count among the study groups.
 |
Table 2 Clinical and Biochemical Variables in Study Groups |
Among the 44 T2DM patients, 16 patients had a history of hypertension. Among the 20 CAD patients, 13 subjects were diagnosed with myocardial infarction (MI) and seven with unstable angina. Whereas in 38 T2DM_CAD patients, 23 subjects were diagnosed with myocardial infarction (MI) and 15 with unstable angina.
Platelet Activation Status in Control, T2DM, CAD and T2DM_CAD Groups
Our results showed that percentage of platelets showing CD62P expression was significantly higher in T2DM and T2DM_CAD groups as compared to both healthy control and CAD groups (p < 0.05) (Figure 2D). PAC-1 expression followed the same pattern, but the differences were not statistically significant (Figure 2E).
Immunome Profiling in Control, T2DM, CAD and T2DM_CAD Groups
Immunome profile of monocytes, neutrophils, T cells, natural killer cells and dendritic cell populations in the study groups are shown in Figure 2 and Table 3. Percentage of classical monocytes were significantly decreased in patients with CAD and T2DM_CAD groups as compared with the control group (p < 0.05) (Figure 3K). Whereas, intermediate monocytes were significantly increased in T2DM, CAD and T2DM_CAD groups as compared to the control group (p < 0.05) (Figure 3L). Increased non-classical monocytes observed in the CAD group as compared to both control and T2DM group (p<0.05) (Figure 3M). No significant difference was observed in CD4 T cells (Figure 3N), CD8 T cells (Figure 3O), NKT cells (Figure 3P) and NK cells (Figure 3Q) between the study groups. Total dendritic cells, myeoloid and plasmacytoid dendritic cells populations were decreased in T2DM, CAD and T2DM_CAD disease conditions as compared to the control group, although significant reductions were observed only in T2DM cases (p < 0.05). Apart from this plasmacytoid dendritic cells were significantly decreased in the CAD group as compared to the control group (p < 0.05) (Figure 3R–T).
 |
Table 3 Percentage of All Cell Types and Platelet-Immune Cell Interaction or Aggregation in Study Groups |
Platelet Aggregate Formation with Different Innate Immune Cells and Their Subset in Control, T2DM, CAD and T2DM_CAD Groups
Percentage of platelet aggregate formation with different immune cells and subsets are shown in Table 3. Platelet aggregate formation with monocytes (PMA) (Figure 4A), classical monocytes (PCMA), neutrophils (PNA) (Figure 4B), T lymphocytes (PTA) (Figure 4C), T helper cells (PCD4A), cytotoxic T cells (PCD8A), and plasmacytoid dendritic cells (PPDA) in T2DM group was significantly higher as compared to the control group (p < 0.05). The differences in the platelet-dendritic cells aggregation (PDA) are represented in Figure 4D. Increased platelet aggregate formation with monocytes, classical monocytes, intermediate monocyte (PIMA), neutrophils and natural killer cells (PNKA) was observed in the T2DM_CAD group as compared with control and CAD groups (p < 0.05). Further, the platelet aggregate formation with CD4 cells and CD8 cells was significantly higher in the T2DM and T2DM_CAD groups as compared to the control group (p < 0.05). Platelet aggregate formation with different immune cell subsets are shown in Figure S1.
Serum Inflammatory Markers Levels in Control, T2DM, CAD and T2DM_CAD Groups
The fold change of different in inflammatory markers in T2DM, CAD and T2DM_CAD as compared to the control group are depicted in a heat map (Figure 5A) and the median fold change of each marker in each disease cohort compared to the control medians is shown (Figure 5B). Our data indicate that cytokines ie, IL-12p70, INF-γ, CCL-2 and CCL-11 were significantly increased and CCL-3 significantly decreased in the T2DM group as compared to the control group (p < 0.05). Inflammatory markers such as IL-1β, IL-2, IL-4, IL-6, IL-8, IL-13, CCL-2 levels are significantly increased in CAD and T2DM_CAD groups as compared to the control group (p < 0.05). TNF-α, IFN-γ, CXCL-10, were significantly increased in the CAD group as compared to the control group (p < 0.05). Furthermore, increased IL12p70, and IL-18 levels found in the T2DM_CAD group as compared to the control group (p < 0.05). All the significantly altered inflammatory markers were further represented in a Venn diagram in order to distinguish the common and individual markers in each disease group from other groups (Figure 5C).
 |
Figure 5 Measurement of circulating inflammatory markers. (A) Heat map showing the fold change of the circulating inflammatory markers across all the individuals belonging to the three different disease states. In order to derive the fold change, the median values of each inflammatory marker was obtained across all the healthy controls (control median). Further the fold change of a given inflammatory marker for a given patient was obtained as the log-ratio of the value of the marker in that patient divided by the control-median corresponding to that marker. (B) The median fold change of inflammatory markers in each disease cohort versus the control medians of each marker is also shown. X mark indicates statistically significant change as compared to control group (p < 0.05). (C) Venn diagram representing common and unique inflammatory markers in order to distinct T2DM, CAD, and T2DM_CAD as compared with control. |
Correlation Between Clinical Parameters with Flow Cytometry Derived Parameters
Correlation between clinical parameters with innate immune cells and platelet activation markers are shown in Figure 6A. P-selectin expression was positively correlated with fasting blood sugar (FBS) and glycated haemoglobin (HbA1c). Similarly, PMA and PCMA, PIMA, platelet non classical monocyte aggregate (PNCMA) and PNA are positively correlated with FBS and HbA1C. Apart from this PTA, PCD8A, and PNKA was positively correlated with HbA1c. Myeloid dendritic cell populations were negatively correlated with serum creatinine levels.
 |
Figure 6 Heat map showing (A) the mutual Spearman correlations between the circulating inflammatory markers on the horizontal axis and the innate immune cells, their aggregate with platelet and platelet activation markers on the vertical axes. Background colour indicates strength of association. R value 0.3 was set as threshold and significance was considered as p < 0.05. (B) Heat map showing mutual Spearman correlations between the clinical characteristics on the horizontal axis and the innate immune cells, their aggregate with platelet and platelet activation markers on the vertical axes. Background colour indicates strength of association. R value 0.3 was set as threshold and significance was considered as p < 0.05. X mark indicates correlations having R ≥ 0.3 and p < 0.05. |
Correlation Between Inflammatory Markers with Flow Cytometry Derived Parameters
The correlations between inflammatory markers with innate immune cells and platelet activation markers are shown in Figure 6B. CD4 T cell was positively correlated with Eotaxin-1 (CCL-11), while CD-8 T cells were negatively correlated with CXCL10. The percentage of natural killer cell population was positively correlated with pro-inflammatory cytokine IL-8 and MCP-1. Total dendritic cells and plasmacytoid dendritic cells population were negatively correlated with pro-inflammatory cytokines IL-6 and TNF-α. Similarly, myeloid dendritic cells were negatively correlated with anti-inflammatory cytokine IL-4, pro-inflammatory cytokines ie, IL-6, IL12p70, TNF-α, IFN-γ and eotaxin-1. The percentage of platelet activation (P-selectin positive platelets) was positively correlated with pro-inflammatory cytokines IL-1β and IL-18 while the same was negatively correlated with chemokine CXCL-1. Interestingly, PMA was positively correlated with many circulatory cytokines including IL-2, IL-4, IL-6, IL-12p70, IL-13, IL-18 and TNF-α. The percentage of PCMA was found to be positively correlated with IL12p70 and negatively correlated with CXCL-1. PIMA was observed to be positively correlated with MCP-1. PNCMA was found to be positively correlated with cytokines IL-6, IL-18 and CCL-2. Platelet-neutrophil aggregate positively correlated with pro-inflammatory cytokines ie, IL-1β, IL-2, IL12p70 and IL-13. PCD8A was positively correlated with IL-8 and CCL-2. Platelet-natural killer T cells aggregate (PNKTA) was positively correlated with IL-8 levels while PNKA was positively correlated with IL-18 and CCL-2.
Logistic Regression Analysis
We have performed logistic regression analysis to identify the true effect of T2DM and CAD on the platelet indices. Our univariate analysis revealed that intermediate monocytes, plasmacytoid dendritic cells, P-selectin, PMA, PIMA, NCMA, PNA, PTA, PCD4A, PCD8A were significantly associated with the presence of both T2DM and T2DM_CAD conditions. Further FBS, total cholesterol and triglycerides were associated with the T2DM and T2DM_CAD group. When we adjusted with age and gender, our multivariate analysis showed age, gender and platelet-neutrophil aggregates are significantly associated with the T2DM, CAD and T2DM_CAD conditions. Univariate and multivariate regression analysis is shown in Supplementary Tables S1 and S2.
Protein-Protein Interaction Network and Pathway Analysis
The protein-protein interaction network and pathway analysis identified several cytokine interaction networks that were highly enriched in signal transduction, inflammation and immune response. The majority of the proteins with changed expression in the serum of patients were related to different biological processes including lipopolysaccharide-mediated signalling pathway, cell chemotaxis, inflammatory response, MAPK cascade and immune response. The interaction network was also enriched in pathways including TLR signalling pathway, cytokine cytokine receptor interaction, Jak-STAT signalling pathway and NOD like receptor signalling pathways. (Figure 7 and Figure S2).
 |
Figure 7 Protein-protein interaction network. STRING database analysis of medium-confidence protein interactions (interaction score, >0.4) between identified cytokines in T2DM_CAD patients. The circles represent proteins, while the straight lines represent the interactions between different proteins. The line thickness indicates the strength of evidence, with thicker connections indicating higher confidence in the protein-protein interaction. |
Effect of Glucose on Platelet-Monocyte Interaction ex-vivo
In our ex-vivo analysis, D-glucose has shown concentration and time dependent increase in PMA formation. The effect of hyperglycemia on platelet-monocyte interaction was visually confirmed by confocal microscope and increased PMA formation was observed in a D-Glucose concentration dependent manner (Figure 8A). After six hours of incubation, platelet-monocyte aggregate formation reached a plateau stage with three D-glucose concentrations. Incubation with 5 mmol/L D-glucose showed a 49.7% PMA formation, further it showed a maximum of 61.7% and 83.5% for 15 mmol/L and 30 mmol/L, respectively (Figure 8B).
 |
Figure 8 Effect of hyperglycemia on platelet-monocyte aggregate formation - Ex-vivo. (A) Confocal microscopic images of platelet-monocytes aggregate formation in different glucose concentration. Monocytes and platelets were incubated with 5 mM/L, 15 mM/L, and 30 mM/L D-Glucose, cells were fixed and stained with rhodamine phalloidin (F-actin, red) and DAPI (nuclei, blue). Scale bar = 25µm. (B) Quantification of hyperglycemia effect on platelet-monocyte aggregate formation by flow cytometer. Peripheral blood mononuclear cells and platelets were incubated with 5 mM/L, 15 mM/L, and 30 mM/L D-glucose for up to 8 hours. Monocytes were identified with CD14 APC-CY7 and monocytes aggregate formation with platelets were identified with the help of platelet specific marker CD41a Pecy5. |
Discussion
Type 2 diabetes and coronary artery diseases share many pathophysiological processes, and together increases the risk of cardiovascular morbidity and mortality.18–20 In the present study, increased platelet activation and increased platelet-immune cell aggregate formation were observed in T2DM and T2DM_CAD groups. We observed an increase in IL-1β, IL-2, IL-4, IL-6, IL-8, IL12p70, L-13 IL-18, and CCL2 in the T2DM_CAD group and increased cytokines are correlated with platelet activation and platelet-immune cell aggregation markers. Further, we confirmed that the hyperglycaemia increases the platelet-monocyte aggregate formation through ex-vivo study. We have identified increased platelet activation in T2DM and T2DM_CAD groups, irrespective of their anti-platelet medication status. Hyperglycemia, insulin resistance, oxidative stress, inflammation, endothelial damage conditions associated with the type 2 diabetes and coronary artery diseases, together contributes to platelet activation by impairing the calcium homeostasis, ROS generation, disrupting NO production and glycation of platelet proteins.11,21 In addition, platelet activation marker p-selectin was positively correlated with the fasting blood sugar and glycated hemoglobin (HbA1c) levels. This supports, our notion that hyperglycemia may play a crucial role in the activation of platelets.
Altered circulatory monocytes and monocyte subpopulation are associated with CVD complications and atherosclerosis lesion progression, by increasing the ROS generation and pro-inflammatory cytokines release.22,23 Increased circulatory intermediate and non-classical monocytes may contribute to the development and progression of coronary artery disease in type 2 diabetes. Our results indicate both intermediate (CD14++ CD16+) and non-classical (CD14+ CD16++) monocytes were significantly increased in T2DM, CAD, and T2DM_CAD conditions and whereas the classical monocytes (CD14++ CD16-) were significantly decreased. Dendritic cells play a role in both promoting and preventing the atherogenesis and are potent mediators of inflammation in coronary arteries.26 We observed a decrease in total peripheral dendritic cells and their subsets (pDC and mDC) in T2DM, CAD and T2DM_CAD conditions which agrees with reported studies.24,25 Observed changes could be due to compensatory immune response in type 2 diabetes and coronary artery disease conditions.
Further, we identified increased platelet-monocyte, platelet-neutrophil and platelet-T lymphocyte aggregate formation in T2DM and T2DM_CAD groups. Our observed 63.3% PMA levels in control subjects was higher than those previous published, where the authors reported a PMA range of 10–30% in control subjects in different populations.27,28 The disparity could be related to differences in ethnicity and clinical features between the control subjects of different studies.29,30 Based on the available evidence, activated platelets may adhere to leukocytes and can form platelet-leukocyte aggregates (PLA) by tethering platelet surface ligands like p-selectin, CD40L, ICAM-2 with its respective counter receptors on leukocytes ie, PSGL-1, CD40, and αLβ2. Further, soluble fibrinogen may act as a bridge between integrin αIIbβ3 and integrin Mac-1(αLβ2), and contributes to the formation of PLA in T2DM conditions.31 Platelet-immune cell aggregates induce the adhesive properties of immune cells thus aids their trans-endothelial migration.31,32 Passacquale et al suggests that PMA formation induces COX-2 dependent pro-inflammatory phenotypic changes in monocytes (CD14++CD16+).33 Platelet aggregation with different immune cells are positively correlated with FBS and HbA1c levels. This was further confirmed with ex-vivo experiments. Our results confirming that hyperglycemia may enhance the platelet–leucocyte aggregation in T2DM and T2DM_CAD condition. Apart from P-selectin, pac-1 and platelet-leukocyte aggregates, recently platelet derived micro vesicles emerged as potential markers for platelet activation. Reports suggested that increased platelet derived micro vesicles observed in T2DM, coronary artery disease and people with high risk of developing cardiovascular disease34–36 and increased platelet derived micro vesicles are associated with the severity of the CAD patient.35
Activated platelets secrete an enormous number of inflammatory mediators like cytokines/ chemokines and play an important role in chronic low grade inflammation in type 2 diabetes and coronary artery disease development.37 In our study, increased CCL-11 was observed in T2DM patients, Herder et al reported similar changes of CCL-11 levels in T2DM subjects.38 Our findings decreased CCL-3 levels in T2DM patients, which contradicts those of Araujo et al where authors reported increased CCL-3 levels in T2DM.39 Activated platelet releases CCL-3 and contributed to the leukocytes attraction towards thrombus.40 Increased TNF-α and IP-10 are observed in the CAD group and as per the published literatures these changes are associated with CAD and the predictor for the severity of CAD.41,42 Pro-inflammatory cytokine IL-12 levels are increased in T2DM and T2DM_CAD groups and increased IL-12 levels in T2DM_CAD was associated with insulin resistance in these patients.20 Our results show interleukins such as IL-1β, IL-2, IL-4, IL-6, IL-8 and IL-13 were increased in both CAD and T2DM_CAD groups. Reports suggest that monocytes and macrophages in CAD patients release elevated levels of IL-1β and IL-6 in a glucose/ROS dependent manner43 and increased IL-2 levels involved in immune activation.44 The role of IL-4 in contradicting41 however, increased IL-4 levels could be linked to the cardiac repair mechanism in disease conditions.41,45 Several reports suggests that high circulating levels of IL-6 and IL-8 have been linked to an increased risk of CAD and increased IL-6 may further contribute to the development of insulin resistance in these patients.8,46,47 The decreased CCL-5 and CXCL-1 and increased IL-18 levels observed in the T2DM_CAD group. Podolec et al reported that decreased CCL-5 levels are correlated with the severity of the coronary atherosclerosis.48 Our observations support that CCL-5 could be a marker for type 2 diabetes with CAD. Increased CXCL-1 levels are linked with obesity, hyperglycemia and myocardial infarction patients. Further, CXCL-1 is associated with coronary artery calcium (CAC), aortic wall thickness and plaque burden.49 Our results are in contrast to the circulatory CXCL-1 levels from other studies. This might be a compensatory response to the type 2 diabetes with coronary atherosclerosis. Studies have reported, increased IL-18 levels in T2DM_CAD disease and IL-18 was found to be associated with insulin resistance, vascular inflammation and atherosclerosis conditions.50,51 Increased CCL2 levels are observed in T2DM, CAD and T2DM_CAD groups. Researchers reported that CCL-2 as a risk factor for type 2 diabetes and coronary artery diseases and contributes to the development and progression of insulin resistance and atherosclerosis.52,53
Next, we performed a correlation study to find the association among all observed markers in disease conditions. Our correlation analysis revealed that platelet activation marker P-selectin was positively correlated with IL-1β, IL-18 and the same was negatively correlated with CXCL-1. The role of IL-1β in platelet activation, secretion of micro particles and other cytokines has been extensively reported.54–56 Further, activated platelet boost IL-1β production through the activation of inflammasome activity in different innate immune cells like macrophages, neutrophils and monocytes.57 Activated platelet and inflammasome activated immune cells release IL-18 and that in turn causes the atherosclerotic plaque instability in patients with coronary artery disease.58 The negative correlation between p-selectin and CXCL-1 may be due to complex of inflammatory conditions in disease states.
We next studied to understand the platelet-immune cell interactions and their impact on disease severity. In our study, PMA and PNA, were found correlated with circulatory levels of IL-1β, IL-2, IL-4, IL-6, IL-8, IL-12p70, IL-13, IL-18 and CCL-2. Further, researchers observed that co-incubation of platelets with monocytes induces the release of pro-inflammatory cytokines ie, IL-6, IL8, TNF-α and CCL2 which is mediated by NF-κB (nuclear factor–κB) pathway.59 It is also confirmed that monocyte tethering by P-selectin increases the secretion of cytokines CCL-2 and TNF-α by enhancing nuclear translocation of NF-κB.60 An activated platelet induces endothelial cells to release CCL-2 (MCP-1) and increases the recruitment of monocytes.61 Apart from this CCL2 is also playing a key role in platelet activation, aggregation, secretion and arterial thrombosis via PKCα-P38MAPK-HSP27 pathway.62
Furthermore, we identified possible cellular signaling pathways using inflammatory markers that are differently expressed in T2DM_CAD group and significantly correlated with platelet activation markers. The protein-protein network and pathway analysis revealed that these inflammatory markers are tightly inter connected and implicated in several immune, inflammatory and insulin resistance pathways like MAPK cascade, TLR signalling pathway, NOD like receptor signalling pathway and Jak-STAT signalling pathway. Moreover, our results indicate that the change in cytokine expression levels may lead to a progression of a pathophysiological condition related to that of coronary artery diseases in type 2 diabetes.
Limitations
In this study, we have attempted to find the link between platelet activation and inflammation process by doing a cross-sectional study with a robust study design. However, our study has some limitations. The major limitation of the present study is its cross-sectional nature with a small sample size. Another study limitation is that it did not confirm the causality. In the present study, we have focused mostly on the flow cytometry technique and not found the molecular mechanisms responsible for the platelet activation and inflammation process. However, we have attempted to find the molecular signaling pathways that interfere in the type 2 diabetes with coronary artery disease development by using a protein-protein network and pathway analysis.
Conclusion
In conclusion, patients with type 2 diabetes and coronary artery disease in type 2 diabetes have increased platelet activation that leads to platelet-immune cell aggregation. These changes may initiate the inflammatory responses by releasing circulatory inflammatory cytokine/chemokines and contribute to the disease progression (Figure 9). These findings may help to identify the platelet-immune cells aggregate markers to detect the progression of the diseases and develop new therapeutic strategies for the prevention of coronary artery diseases in type 2 diabetes focusing on systemic and platelet mediated inflammation. A better understanding of the molecular mechanisms underlying platelet mediated inflammatory responses in the development of diabetes associated cardiovascular diseases needs to be elucidated in future studies.
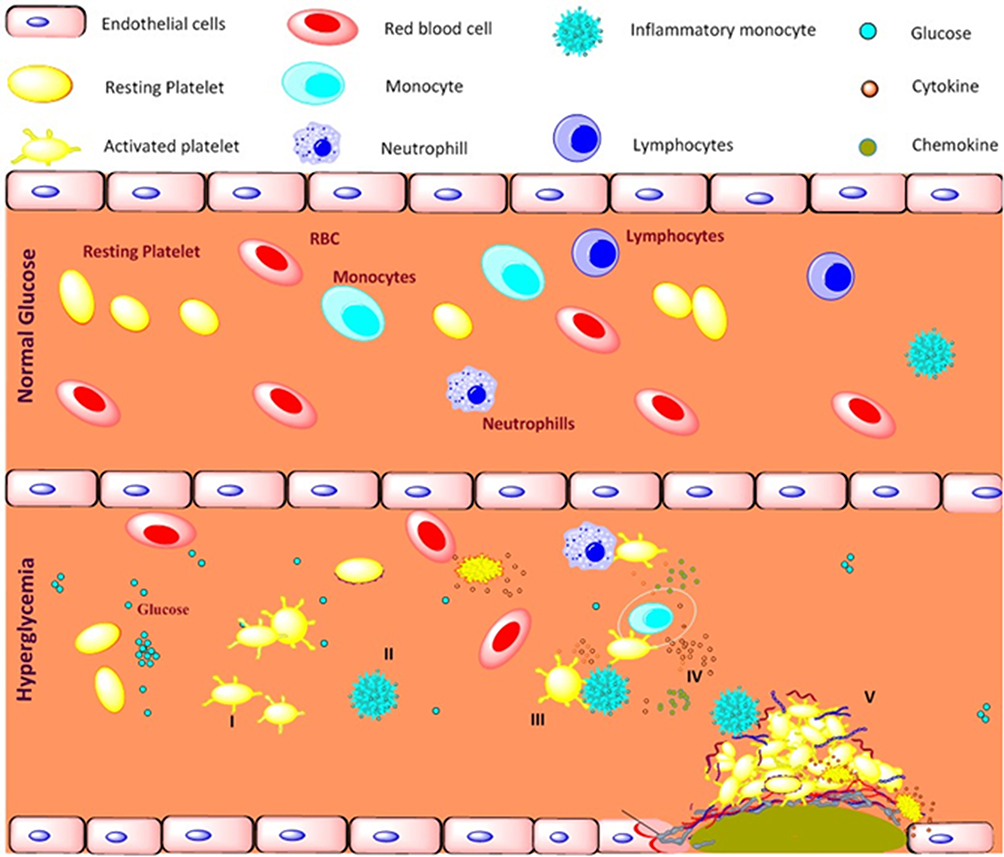 |
Figure 9 Schematic representation of platelet mediated inflammation process in type 2 diabetes and coronary artery diseases associated with type 2 diabetes. Long term exposure to the hyperglycemia condition and metabolic disturbance, I) activates platelets and II) shift monocytes towards inflammatory phenotypes, III) activated platelets aggregates with immune cells mainly monocytes, IV) triggers the release of pro-inflammatory, anti-inflammatory cytokines and chemokines, V) together contributes to development of atherosclerotic coronary artery diseases in type 2 diabetic patients. |
Data Sharing Statement
The datasets used and/or analyzed during the present study are available from the corresponding author upon reasonable request.
Ethics Approval and Informed Consent
The study was approved by the Institutional Ethics Committee of Downtown Hospital (Ethics committee approval No: EC/DTH/CT/2018/07). All subjects were given detailed information about the study and informed consent was obtained from each study participant.
Consent for Publication
All authors have read the paper and agree that it can be published.
Acknowledgments
RA and EJ are thankful to Dr. USN Murty, Director, National Institute of Pharmaceutical Education and Research, Guwahati and Department of Pharmaceuticals (DoP), Ministry of Chemicals and Fertilizers, Govt. of India for providing necessary support and funding. RA and EJ are thankful to Dr. Gayatri Vishwakarma, Biostatician, Indian Institute of Spinal Injuries, New Delhi for her support in statistical analysis. RA and EJ are thankful to Prof. Prasenjit Guchhait for the support and training to Mr Ebin Johny.
Author Contributions
All authors made a significant contribution to the work reported, whether that is in the conception, study design, execution, acquisition of data, analysis and interpretation, or in all these areas; took part in drafting, revising or critically reviewing the article; gave final approval of the version to be published; have agreed on the journal to which the article has been submitted; and agree to be accountable for all aspects of the work.
Funding
There is no funding to report.
Disclosure
The authors declare no conflicts of interest for this work.
References
1. Adela R, Banerjee SK. GDF-15 as a target and biomarker for diabetes and cardiovascular diseases: a translational prospective. J Diabetes Res. 2015;2015:490842. doi:10.1155/2015/490842
2. Saeedi P, Petersohn I, Salpea P, et al. Global and regional diabetes prevalence estimates for 2019 and projections for 2030 and 2045: results from the International Diabetes Federation Diabetes Atlas. Diabetes Res Clin Pract. 2019;157:107843. doi:10.1016/j.diabres.2019.107843
3. Aronson D, Edelman ER. Coronary artery disease and diabetes mellitus. Cardiol Clin. 2014;32(3):439–455. doi:10.1016/j.ccl.2014.04.001
4. Ormazabal V, Nair S, Elfeky O, Aguayo C, Salomon C, Zuñiga FA. Association between insulin resistance and the development of cardiovascular disease. Cardiovasc Diabetol. 2018;17(1):1–14. doi:10.1186/s12933-018-0762-4
5. Nam H, Cho Y, Lim J, et al. Functional status of immune cells in patients with long‐lasting type 2 diabetes mellitus. Clin Exp Immunol. 2018;194(1):125–136. doi:10.1111/cei.13187
6. Nagareddy PR, Murphy AJ, Stirzaker RA, et al. Hyperglycemia promotes myelopoiesis and impairs the resolution of atherosclerosis. Cell Metab. 2013;17:695–708. doi:10.1016/j.cmet.2013.04.001
7. Donath MY, Dinarello CA, Mandrup-Poulsen T. Targeting innate immune mediators in type 1 and type 2 diabetes. Nat Rev Immunol. 2019;19(12):734–746. doi:10.1038/s41577-019-0213-9
8. Adela R, Reddy PNC, Ghosh TS, et al. Serum protein signature of coronary artery disease in type 2 diabetes mellitus. J Transl Med. 2019;17(1):1–17. doi:10.1186/s12967-018-1755-5
9. Morrell CN, Aggrey AA, Chapman LM, Modjeski KL. Emerging roles for platelets as immune and inflammatory cells. Blood. 2014;123(18):2759–2767. doi:10.1182/blood-2013-11-462432
10. Kaur R, Kaur M, Singh J. Endothelial dysfunction and platelet hyperactivity in type 2 diabetes mellitus: molecular insights and therapeutic strategies. Cardiovasc Diabetol. 2018;17(1):1–17. doi:10.1186/s12933-018-0763-3
11. Kakouros N, Rade JJ, Kourliouros A, Resar JR. Platelet function in patients with diabetes mellitus: from a theoretical to a practical perspective. Int J Endocrinol. 2011;2011:1–14. doi:10.1155/2011/742719
12. Israels SJ, McNicol A, Dean HJ, Cognasse F, Sellers EA. Markers of platelet activation are increased in adolescents with type 2 diabetes. Diabetes Care. 2014;37(8):2400–2403. doi:10.2337/dc13-2718
13. Pretorius L, Thomson GJ, Adams RC, Nell TA, Laubscher WA, Pretorius E. Platelet activity and hypercoagulation in type 2 diabetes. Cardiovasc Diabetol. 2018;17(1):1–11. doi:10.1186/s12933-018-0783-z
14. Thomas MR, Storey RF. The role of platelets in inflammation. Thromb Haemost. 2015;114(09):449–458. doi:10.1160/TH14-12-1067
15. Rossaint J, Margraf A, Zarbock A. Role of platelets in leukocyte recruitment and resolution of inflammation. Front Immunol. 2018;9:2712. doi:10.3389/fimmu.2018.02712
16. Huang DW, Sherman BT, Lempicki RA. Bioinformatics enrichment tools: paths toward the comprehensive functional analysis of large gene lists. Nucleic Acids Res. 2009;37(1):1–13. doi:10.1093/nar/gkn923
17. Szklarczyk D, Gable AL, Lyon D, et al. STRING v11: protein–protein association networks with increased coverage, supporting functional discovery in genome-wide experimental datasets. Nucleic Acids Res. 2019;47(D1):D607–D613. doi:10.1093/nar/gky1131
18. Martín-Timón I, Sevillano-Collantes C, Segura-Galindo A, Del Cañizo-Gómez FJ. Type 2 diabetes and cardiovascular disease: have all risk factors the same strength? World J Diabetes. 2014;5(4):444. doi:10.4239/wjd.v5.i4.444
19. Pedicino D, Liuzzo G, Trotta F, et al. Adaptive immunity, inflammation, and cardiovascular complications in type 1 and type 2 diabetes mellitus. J Diabetes Res. 2013;2013:1–11. doi:10.1155/2013/184258
20. Madhumitha H, Mohan V, Deepa M, Babu S, Aravindhan V. Increased Th1 and suppressed Th2 serum cytokine levels in subjects with diabetic coronary artery disease. Cardiovasc Diabetol. 2014;13(1):1–8. doi:10.1186/1475-2840-13-1
21. Pretorius E. Platelets as potent signaling entities in type 2 diabetes mellitus. Trends Endocrinol Metab. 2019;30(8):532–545. doi:10.1016/j.tem.2019.05.003
22. Shantsila E, Tapp LD, Wrigley BJ, et al. Monocyte subsets in coronary artery disease and their associations with markers of inflammation and fibrinolysis. Atherosclerosis. 2014;234(1):4–10. doi:10.1016/j.atherosclerosis.2014.02.009
23. Kapellos TS, Bonaguro L, Gemünd I, et al. Human monocyte subsets and phenotypes in major chronic inflammatory diseases. Front Immunol. 2019;10:2035. doi:10.3389/fimmu.2019.02035
24. Seifarth C, Hinkmann C, Hahn E-G, Lohmann T, Harsch I. Reduced frequency of peripheral dendritic cells in type 2 diabetes. Exp Clin Endocrinol Diabetes. 2008;116(03):162–166. doi:10.1055/s-2007-990278
25. Van Vre EA, Hoymans VY, Bult H, et al. Decreased number of circulating plasmacytoid dendritic cells in patients with atherosclerotic coronary artery disease. Coron Artery Dis. 2006;17(3):243–248. doi:10.1097/00019501-200605000-00007
26. Zernecke A. Dendritic cells in atherosclerosis: evidence in mice and humans. Arterioscler Thromb Vasc Biol. 2015;35(4):763–770. doi:10.1161/ATVBAHA.114.303566
27. Gkaliagkousi E, Gavriilaki E, Yiannaki E, et al. Platelet activation in essential hypertension during exercise: pre-and post-treatment changes with an angiotensin II receptor blocker. Am J Hypertens. 2014;27(4):571–578. doi:10.1093/ajh/hpt153
28. Gkaliagkousi E, Corrigall V, Becker S, et al. Decreased platelet nitric oxide contributes to increased circulating monocyte-platelet aggregates in hypertension. Eur Heart J. 2009;30(24):3048–3054. doi:10.1093/eurheartj/ehp330
29. Goubareva I, Gkaliagkousi E, Shah A, Queen L, Ritter J, Ferro A. Age decreases nitric oxide synthesis and responsiveness in human platelets and increases formation of monocyte–platelet aggregates. Cardiovasc Res. 2007;75(4):793–802. doi:10.1016/j.cardiores.2007.05.021
30. Gupta M, Brister S, Verma S. Is South Asian ethnicity an independent cardiovascular risk factor? Can J Cardiol. 2006;22(3):193–197. doi:10.1016/s0828-282x(06)70895-9
31. Martins PA, van Gils JM, Mol A, Hordijk PL, Zwaginga JJ. Platelet binding to monocytes increases the adhesive properties of monocytes by up‐regulating the expression and functionality of β1 and β2 integrins. J Leukoc Biol. 2006;79(3):499–507. doi:10.1189/jlb.0605318
32. Page C, Pitchford S. Neutrophil and platelet complexes and their relevance to neutrophil recruitment and activation. Int Immunopharmacol. 2013;17(4):1176–1184. doi:10.1016/j.intimp.2013.06.004
33. Passacquale G, Vamadevan P, Pereira L, Hamid C, Corrigall V, Ferro A. Monocyte-platelet interaction induces a pro-inflammatory phenotype in circulating monocytes. PLoS One. 2011;6(10):e25595. doi:10.1371/journal.pone.0025595
34. Gkaliagkousi E, Nikolaidou B, Gavriilaki E, et al. Increased erythrocyte-and platelet-derived microvesicles in newly diagnosed type 2 diabetes mellitus. Diab Vasc Dis Res. 2019;16(5):458–465. doi:10.1177/1479164119844691
35. Gkaliagkousi E, Gavriilaki E, Yiannaki E, et al. Platelet microvesicles are associated with the severity of coronary artery disease: comparison between peripheral and coronary circulation. J Thromb Thrombolysis. 2021;51(4):1138–1143. doi:10.1007/s11239-020-02302-5
36. Lazaridis A, Gavriilaki E, Nikolaidou B, et al. A study of endothelial and platelet microvesicles across different hypertension phenotypes. J Hum Hypertens. 2021;1–9. doi:10.1038/s41371-021-00531-6.
37. Yun S-H, Sim E-H, Goh R-Y, Park J-I, Han J-Y. Platelet activation: the mechanisms and potential biomarkers. Biomed Res Int. 2016;2016:1–5. doi:10.1155/2016/9060143
38. Herder C, Haastert B, Müller-Scholze S, et al. Association of systemic chemokine concentrations with impaired glucose tolerance and type 2 diabetes: results from the Cooperative Health Research in the Region of Augsburg Survey S4 (KORA S4). Diabetes. 2005;54(suppl2):S11–S17. doi:10.2337/diabetes.54.suppl_2.s11
39. Araújo LS, da Silva MV, da Silva CA, et al. Analysis of serum inflammatory mediators in type 2 diabetic patients and their influence on renal function. PLoS One. 2020;15(3):e0229765. doi:10.1371/journal.pone.0229765
40. Lam FW, Vijayan KV, Rumbaut RE. Platelets and their interactions with other immune cells. Compr Physiol. 2015;5(3):1265. doi:10.1002/cphy.c140074
41. Min X, Lu M, Tu S, et al. Serum cytokine profile in relation to the severity of coronary artery disease. Biomed Res Int. 2017;2017:1–9. doi:10.1155/2017/4013685
42. Kumari R, Kumar S, Ahmad MK, et al. TNF-α/IL-10 ratio: an independent predictor for coronary artery disease in North Indian population. Diabetes Metab Syndr. 2018;12(3):221–225. doi:10.1016/j.dsx.2017.09.006
43. Shirai T, Nazarewicz RR, Wallis BB, et al. The glycolytic enzyme PKM2 bridges metabolic and inflammatory dysfunction in coronary artery disease. J Exp Med. 2016;213(3):337–354. doi:10.1084/jem.20150900
44. Ding R, Gao W, Ostrodci DH, et al. Effect of interleukin-2 level and genetic variants on coronary artery disease. Inflammation. 2013;36(6):1225–1231. doi:10.1007/s10753-013-9659-2
45. Shintani Y, Ito T, Fields L, et al. IL-4 as a repurposed biological drug for myocardial infarction through augmentation of reparative cardiac macrophages: proof-of-concept data in mice. Sci Rep. 2017;7(1):1–14. doi:10.1038/s41598-017-07328-z
46. Yuan S, Lin A, He Q-Q, Burgess S, Larsson SC. Circulating interleukins in relation to coronary artery disease, atrial fibrillation and ischemic stroke and its subtypes: a two-sample Mendelian randomization study. Int J Cardiol. 2020;313:99–104. doi:10.1016/j.ijcard.2020.03.053
47. Zhang S, Gao Y, Huang J. Interleukin-8 gene− 251 A/T (rs4073) polymorphism and coronary artery disease risk: a meta-analysis. Med Sci Monit. 2019;25:1645. doi:10.12659/MSM.913591
48. Podolec J, Kopeć G, Niewiara MK, et al. Chemokine RANTES is increased at early stages of atherosclerosis severity. J Physiol Pharmacol. 2016;67(2):321–328.
49. Pordel S, Sajedi Khanian M, Karimi MH, Nikoo H, Doroudchi M. Plasma CXCL 1 levels and TRAF 3 IP 2 variants in patients with myocardial infarction. J Clin Lab Anal. 2018;32(6):e22402. doi:10.1002/jcla.22402
50. Trøseid M, Seljeflot I, Arnesen H. The role of interleukin-18 in the metabolic syndrome. Cardiovasc Diabetol. 2010;9(1):1–8. doi:10.1186/1475-2840-9-11
51. Suchanek H, Myśliwska J, Siebert J, et al. High serum interleukin-18 concentrations in patients with coronary artery disease and type 2 diabetes mellitus. Eur Cytokine Netw. 2005;16(3):177–185.
52. Lin J, Kakkar V, Lu X. Impact of MCP-1 in atherosclerosis. Curr Pharm Des. 2014;20(28):4580–4588. doi:10.2174/1381612820666140522115801
53. Sartipy P, Loskutoff DJ. Monocyte chemoattractant protein 1 in obesity and insulin resistance. Proc Natl Acad Sci U S A. 2003;100(12):7265–7270. doi:10.1073/pnas.1133870100
54. Lindemann S, Tolley ND, Dixon DA, et al. Activated platelets mediate inflammatory signaling by regulated interleukin 1β synthesis. J Cell Biol. 2001;154(3):485–490. doi:10.1083/jcb.200105058
55. Brown GT, McIntyre TM. Lipopolysaccharide signaling without a nucleus: kinase cascades stimulate platelet shedding of proinflammatory IL-1β–rich microparticles. J Immunol. 2011;186(9):5489–5496. doi:10.4049/jimmunol.1001623
56. Hottz ED, Monteiro APT, Bozza FA, Bozza PT. Inflammasome in platelets: allying coagulation and inflammation in infectious and sterile diseases? Mediators Inflamm. 2015;2015:1–7. doi:10.1155/2015/435783
57. Rolfes V, Ribeiro LS, Hawwari I, et al. Platelets fuel the inflammasome activation of innate immune cells. Cell Rep. 2020;31(6):107615. doi:10.1016/j.celrep.2020.107615
58. Scherr C, Albuquerque DC, Pozzan R, et al. Role of interleukin-18 and the thrombus precursor protein in coronary artery disease. Arq Bras Cardiol. 2020;114(4):692–698. doi:10.36660/abc.20190176
59. Kral JB, Schrottmaier WC, Salzmann M, Assinger A. Platelet interaction with innate immune cells. Transfus Med Hemother. 2016;43(2):78–88. doi:10.1159/000444807
60. Kojok K, El-Kadiry AE-H, Merhi Y. Role of NF-κB in platelet function. Int J Mol Sci. 2019;20(17):4185. doi:10.3390/ijms20174185
61. Gleissner CA, von Hundelshausen P, Ley K. Platelet chemokines in vascular disease. Arterioscler Thromb Vasc Biol. 2008;28(11):1920–1927. doi:10.1161/ATVBAHA.108.169417
62. Liu D, Cao Y, Zhang X, et al. Chemokine CC-motif ligand 2 participates in platelet function and arterial thrombosis by regulating PKCα-P38MAPK-HSP27 pathway. Biochim Biophys Acta Mol Basis Dis. 2018;1864(9):2901–2912. doi:10.1016/j.bbadis.2018.05.025
 © 2021 The Author(s). This work is published and licensed by Dove Medical Press Limited. The full terms of this license are available at https://www.dovepress.com/terms.php and incorporate the Creative Commons Attribution - Non Commercial (unported, v3.0) License.
By accessing the work you hereby accept the Terms. Non-commercial uses of the work are permitted without any further permission from Dove Medical Press Limited, provided the work is properly attributed. For permission for commercial use of this work, please see paragraphs 4.2 and 5 of our Terms.
© 2021 The Author(s). This work is published and licensed by Dove Medical Press Limited. The full terms of this license are available at https://www.dovepress.com/terms.php and incorporate the Creative Commons Attribution - Non Commercial (unported, v3.0) License.
By accessing the work you hereby accept the Terms. Non-commercial uses of the work are permitted without any further permission from Dove Medical Press Limited, provided the work is properly attributed. For permission for commercial use of this work, please see paragraphs 4.2 and 5 of our Terms.