")
Back to Journals » Journal of Inflammation Research » Volume 17
Phenotypes and Lung Microbiota Signatures of Immunocompromised Patients with Pneumonia-Related Acute Respiratory Distress Syndrome
Authors Hu Y, Shen J, An Y, Jiang Y, Zhao H
Received 11 December 2023
Accepted for publication 27 February 2024
Published 1 March 2024 Volume 2024:17 Pages 1429—1441
DOI https://doi.org/10.2147/JIR.S453123
Checked for plagiarism Yes
Review by Single anonymous peer review
Peer reviewer comments 2
Editor who approved publication: Dr Tara Strutt
Yan Hu,1,* Jiawei Shen,2,* Youzhong An,2 Yanwen Jiang,1 Huiying Zhao2
1Department of Respiratory and Critical Care Medicine, Peking University International Hospital, Beijing, People’s Republic of China; 2Department of Critical Care Medicine, Peking University People’s Hospital, Beijing, People’s Republic of China
*These authors contributed equally to this work
Correspondence: Huiying Zhao, Department of Critical Care Medicine, Peking University People’s Hospital, Beijing, People’s Republic of China, Email [email protected]
Objective: We aim to identify the clinical phenotypes of immunocompromised patients with pneumonia-related ARDS, to investigate the lung microbiota signatures and the outcomes of different phenotypes, and finally, to develop a machine learning classifier for a specified phenotype.
Methods: This prospective study included immunocompromised patients with pneumonia-related ARDS. We identified phenotypes using hierarchical clustering to analyze clinical variables and serum cytokine levels. We then compared outcomes and lung microbiota signatures between phenotypes. Based on lung microbiota markers, we developed a random forest classifier for a specified phenotype with worse outcomes.
Results: This study included 92 patients, who were divided into three phenotypes, namely “type α” (N = 33), “type β” (N = 12), and “type γ” (N = 47). Compared to type α or type β, patients with type γ had no obvious inflammatory presentation and had significantly lower IL-6 levels and more severe oxygenation failure. Type γ was also related to higher 30-day mortality and lower ventilator free days. The microbiota signatures of type γ were characterized by lower alpha diversity and distinct compositions than those of other patients. We developed a lung microbiota-derived random forest model to differentiate patients with type γ from other phenotypes.
Conclusion: Immunocompromised patients with pneumonia-related ARDS can be clustered into three clinical phenotypes, namely type α, type β, and type γ. Phenotypes were distinguished from each other with different outcomes and lung microbiota signatures. Type γ, which was characterized by insufficient inflammation response and worse outcomes, can be detected with a random forest model based on lung microbiota markers.
Keywords: immunocompromised host, respiratory failure, microbiota
Introduction
With the progression of oncology and rheumatology, the prognosis of patients with various malignancies or auto-immune diseases has been greatly improved.1–3 Yet many patients are in an immunocompromised state after chemotherapy or immunosuppressive treatments, and their risk of opportunistic infections increases significantly.4,5 Life-threatening infectious complications occur frequently, and patients need to be transferred to Intensive Care Units (ICU) for advanced life supports.6
Acute respiratory distress syndrome (ARDS) is a common complication that accompanies pulmonary infection in immunosuppressed patients.7,8 Previous studies have shown that, for immunosuppressed patients with ARDS, the ICU mortality rate is 50–75%, which is much higher than for immunocompetent patients.9,10 On the other hand, there is significant heterogeneity in the results of studies that focused on the evaluation of outcome and treatment methods: the study by Hilbert et, al. suggested that, when compared to traditional oxygen therapy, non-invasive mechanical ventilation can significantly reduce ICU mortality in these patients,11 while subsequent studies did not reach a consistent conclusion.12–14 Some studies have suggested that glucocorticoid treatment may improve outcomes in selected patients,15,16 but this result could not be replicated in immunocompromised hosts17 or other patients.18,19 This evidence suggests that novel methods are necessary to predict patient prognosis and their response to specific treatments to ensure appropriate support for specified patients.
Recent studies on ARDS patients have shown that latent class analysis or supervised learning like clustering can be used to classify patients into different phenotypes based on their basic clinical variables and their serum cytokine levels. Calfee’s research suggests that ARDS patients can be divided into hyperinflammatory (high IL-6, IL-8, TNFr1, etc.) and hypoinflammatory phenotypes.20 These two phenotypes were characterized by different clinical outcomes and responses to steroids and fluid managements.21,22 For immunocompromised hosts, no studies investigated whether such phenotypes existed or were clinically relevant.
On the other hand, based on next-generation sequencing technology (NGS), recent research on the lung microbiome provides a new perspective for the prognostic assessment and inflammatory response classification of ARDS. Dickson et, al. analyzed ICU hospitalized patients requiring mechanical ventilation support and found that the enrichment of gut bacteria in the lungs was associated with high patient mortality.23 Kyo et al reported that the diversity of lung microorganisms in patients with ARDS was significantly reduced, and the enrichment of specific microorganisms can lead to a high inflammatory state and higher ICU mortality.24 For immunosuppressed patients, there are no relevant studies that focus on the relationship between the patient’s lung microbiota and inflammatory response.
Based on current knowledge, we hypothesized that by analyzing clinical variables, the immunocompromised ARDS patients can be divided into sub-phenotypes that characterized by different lung microbiota signatures and clinical outcomes.
Therefore, in this prospective observational study, we aim to identify the clinical phenotypes of immunocompromised patients with pneumonia-related ARDS, to investigate the lung microbiota signatures and the outcomes of different phenotypes, and finally, to develop a machine learning classifier for a specified phenotype.
Methods
Ethics Statement
This study was approved by the ethics committee of Peking University International Hospital (PKUIH, 2021-KY-0026-02) and was conducted under the principles of the Helsinki Declaration. Patients or their relatives signed informed consent before participation (please check the details in the Declarations).
Subject Recruitment
From January, 2021, to December, 2022, we recruited patients who were transferred to the ICUs of Peking University International Hospital and Peking University People’s Hospital with the diagnosis of immunosuppression and ARDS.
The criteria for immunocompromisation were ① neutropenia (<1.5 ×10⁹/L) caused by chemotherapy or hematopoietic stem cell transplantation, ② drug-induced immunosuppression in organ transplant recipients, ③ immunosuppression caused by corticosteroid or cytotoxic therapy in non-malignant diseases, or ④ diagnosed of acquired immunodeficiency syndrome. ARDS was diagnosed with reference to Berlin Definition.25
The exclusion criteria were ① <18 years old, ② in pregnancy, or ③ having a decision that precludes intubation.
Baseline Data, Laboratory Tests and Cytokine Analysis
The patient’s baseline demographic data (gender, age, primary disease diagnosis, etc.) and basic laboratory tests (complete blood count, blood biochemistry, C-reactive protein, procalcitonin, arterial blood gas, etc.) and serum cytokine levels (IL-17a, IL-2, IL-4, IL-5, IL-6, IL-10, IFN-γ, TNF-α) were collected within 24 hours after the patient was transferred to the ICU. Please refer to Table S1 for instruments and reagents used in the tests.
Mechanical Ventilation Support
All patients were supported by non-invasive ventilation on ICU admission. Ventilators were set to maintain a minimal SPO2 of 93%, a tidal volume of 6 mL/kg (predicted body weight), and a respiratory rate lower than 30 per minute. If these parameters cannot be maintained through non-invasive ventilation, patients will be intubated and supported with invasive mechanical ventilation (IMV). Sedation and analgesia were applied to improve patient-ventilator synchronization. Other adjunctive therapies for ARDS (eg, prone positioning, neuro-muscular blocking, extracorporeal membrane oxygenation) were performed at the discretion of the physicians.
Clustering of Phenotypes, Variables, and Outcomes of Phenotypes
Variables were normalized, and Ward’s hierarchical clustering was performed to minimize the variance within clusters (using the “ggdendro” package in R). The optimal number of clusters was assessed with the “Nbclust” package by calculating the average silhouette width. Visualization of clustering results was performed with the “factoextra” package. Outcomes, including 30-day mortality, ventilator free days, and ICU stay were compared between phenotypes. Then, using Cox regression statics to estimate the 60-day survival of patients, the survival curve was striated by phenotypes, or the SOFA (sequential organ failure assessment) score was conducted and visualized with the “survminer” package.
Bronchial Alveolar Lavage and RNA-Based Metagenomic Next-Generation Sequencing
All included patients received a bronchoscope examination with bronchial alveolar lavage within 48 hours of ICU admission. At least 5 mL of BALF was collected for each patient. BALF samples were analyzed with RNA-based metagenomic next-generation sequencing (mNGS) to ensure the detection of microbes, including bacteria, fungus and viruses.26 Briefly, RNA was extracted from BALF samples, and through reverse transcription, cDNA libraries were constructed and sequenced with the NextSeq 1000 System (150-bp paired-end reads; Illumina) to produce sequencing data for downstream analysis. BALF samples were also sent for culture, and the results were recorded.
After cleaning the human sequences and adapter sequences, we identified the microbes in BALF samples and calculated the abundances (including alpha and beta diversity) of different phenotypes. The constitution of microbes between phenotypes was compared. Please refer to Table S2 for our bioinformatic protocol.
Etiological Diagnosis
After the metagenomic analysis and culture of the BALF samples. The etiological diagnoses were made based on the following criteria: ① positive in culture or ② in mNGS, RPM (reads per million) higher than 100 for virus, 20 for bacteria, fungus, or other pathogens.
Develop Prediction Tools for Phenotype
To test whether lung microbiota constitution can distinguish a specified phenotype, we trained a random forest model at the genus level based on random sampling with replacement (using the R package “randomForest”, with the number of decision trees = 1000). The number of marker genera and clinical variables was identified using 10-fold cross-validation with five repeats. The variable importance by mean decrease of accuracy was calculated and visualized. The classification efficacy of the random forest model was evaluated and compared with Receiver Operating Characteristic (ROC) curves.
Statistical Analysis
All statistical analyses were performed on R (version 4.3.2). Missing variables were replaced using multiple imputation chained equations (“MICE” package). Continuous variables were presented as medians (interquartile range), categorical variables were presented as numbers (percentage). A comparison of categorical variables (ie, 30-day mortality) was achieved using χ2 test. Comparison of two groups of continuous variables was performed with the Kruskal–Wallis H-test. All tests were two-sided, and p <0.05 was considered statistically significant.
Results
Patient Recruitment and Clustering of Phenotypes
A total of 112 patients who met the inclusion criteria were admitted to the two ICUs in the study period, and 20 patients were excluded (7 under 18 years old and 13 refused to intubate). There were finally 92 patients included in this study (Figure 1, downstream analyses based on phenotypes were also illustrated). Baseline characteristics including clinical variables, laboratory tests, and serum cytokine levels were used for phenotype clustering.
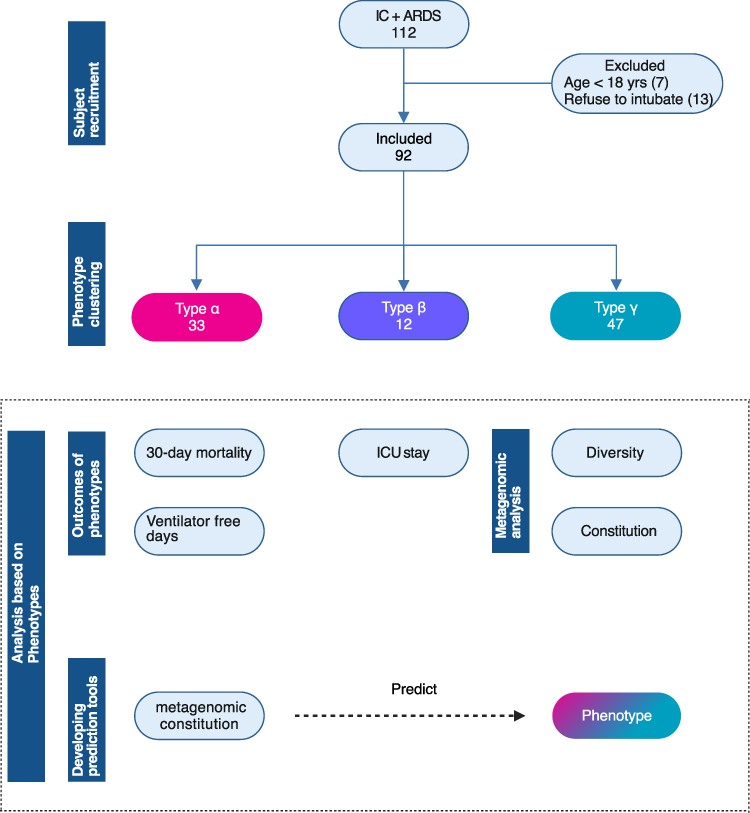 |
Figure 1 Flow chart of this study. All included patients were divided into three phenotypes using hierarchical clustering. And the following analyses were performed: comparison of outcomes, metagenomic analysis of bronchoalveolar lavage fluids, and development of a prediction tool for a specified phenotype. |
With the average silhouette width method, the optimal cluster number was set to 3, the clusters were defined as type α (33 patients), type β (12 patients), and type γ (47 patients) (Figure 2A and B). As reported in Table 1, when compared to type α and type β, type γ was characterized by lower SOFA score, temperature, white blood cell count, lymphocyte count, neutrophil count, hemoglobin, platelets, C-reactive protein, procalcitonin, and IL-6 level [type γ vs type β vs type α: 0(0–0) vs 22.38(0–34.2) vs 97.60(59.05–382.60), p < 0.001] but higher mean arterial pressure and INF-γ level and was characterized with more significant lower PaO2/FiO2 levels [type γ vs type β vs type α: 202(180–220) vs 245(155–286) vs 227(188–259), p = 0.004]. In other words, unlike the other two types, type γ was lacking typical signs of inflammation.
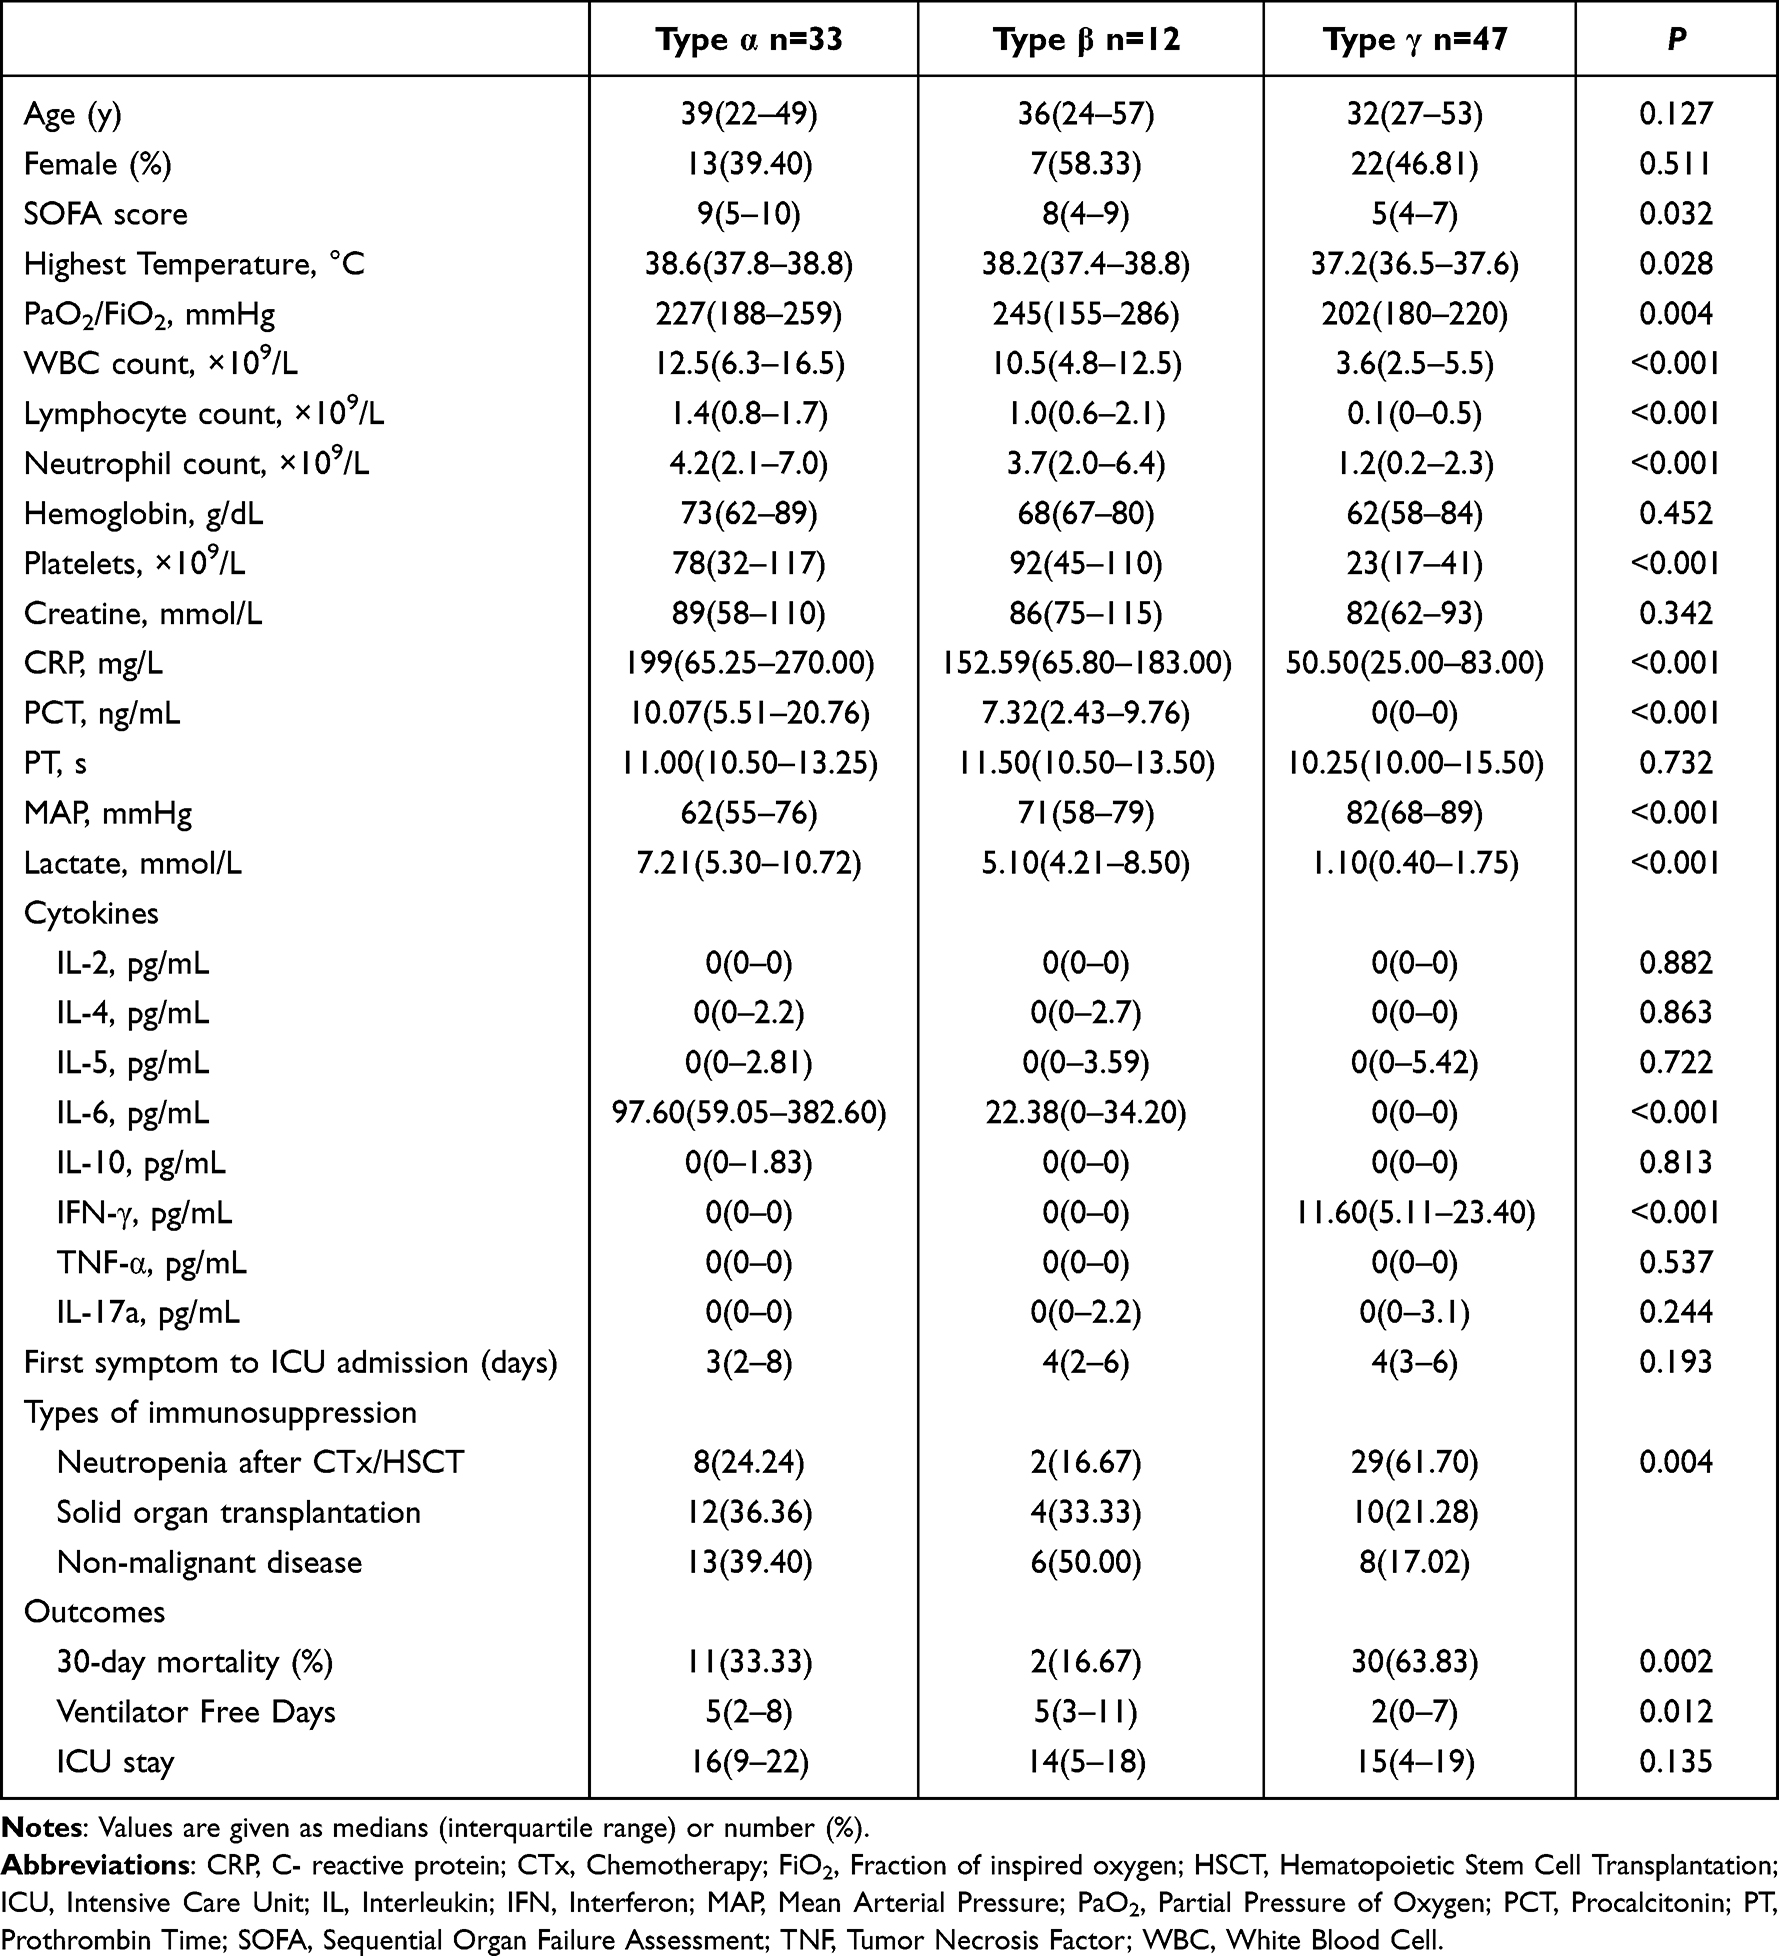 |
Table 1 Characteristics and Outcomes of Patients of Different Phenotypes |
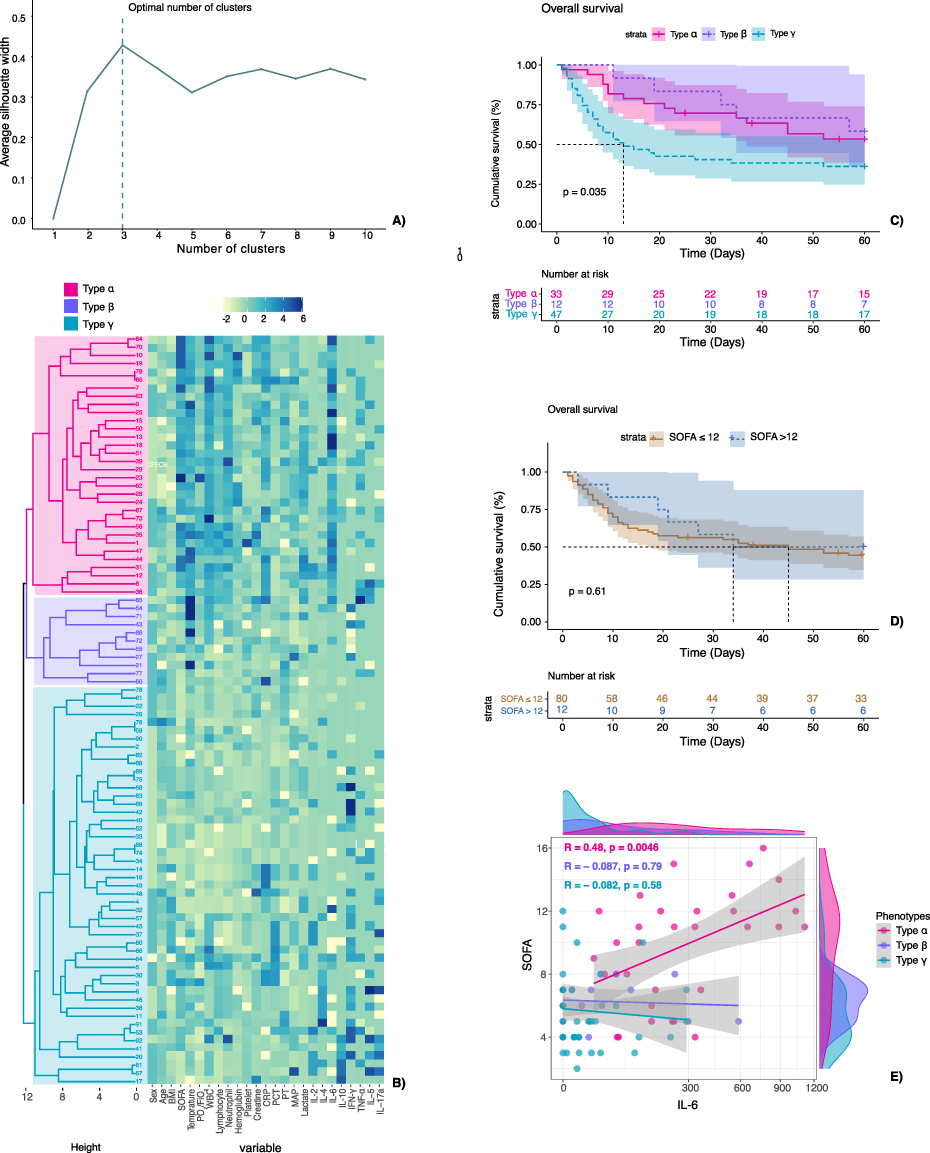 |
Figure 2 Identification of clinical phenotypes and estimation of survival between phenotypes. (A) Calculation of the optimal cluster number. The optimal cluster number was 3 as evaluated with average silhouette width. (B) Hierarchical clustering of phenotypes. Based on the optimal cluster number, clinical variables, and cytokine levels, we defined three phenotypes: α, β and γ. Rows: patients. Columns: clinical variables. First column: dendrogram in red: “type α”, dendrogram in blue: “type β”, dendrogram in green: “type γ”. (C) Cox survival curve to 60 days for patients striated with phenotypes. Type γ had a significantly lower survival rate than patients in other phenotypes p = 0.035, adjusted for age, SOFA score, and PaO2/FiO2. (D) Cox survival curve to 60 days for patients striated by SOFA score. Patients stratified with SOFA score (≤ 12 or >12 points) did not show a difference of survival over time. p = 0.610, adjusted for age, and PaO2/FiO2. (E) Scatter plot between IL-6 levels and SOFA score for patients with different phenotypes. The correlation was evaluated with the Pearson correlation coefficient (R). The correlation of IL-6 level and SOFA score only existed in type α (Pearson’s R =0.48, p=0.0046). Abbreviations: SOFA, Sequential Organ Failure Assessment. |
Worse Outcomes for Patients with Type γ
The type γ was related to higher 30-day mortality (type γ vs type β vs type α: 63.83% vs 16.67% vs 33.33%, p = 0.002) and ventilator free days [type γ vs type β vs type α: 2(0–7) vs 5(3–11) vs 5(2–8), p = 0.012] (Table 1). In Cox regression for survival analysis (Figure 2C), patients with type γ had a significantly lower survival rate than patients with other phenotypes (p = 0.035, adjusted for age, SOFA score, and PaO2/FiO2), while patients stratified by SOFA score (≤12 or >12 points) did not show a difference in survival over time (Figure 2D, p = 0.61). The correlation between IL-6 level and SOFA score only existed in type α (Figure 2E, Pearson’s R = 0.48, p = 0.0046).
Type γ Was Characterized by Low Alpha Diversity and a Distinct Microbiome Composition
When evaluated with the Shannon index and Chao1 index, type γ presented with a significantly lower alpha diversity than type α or type β. In other words, lung microbiotas in type γ had a lower richness and diversity (Figure 3A and B).
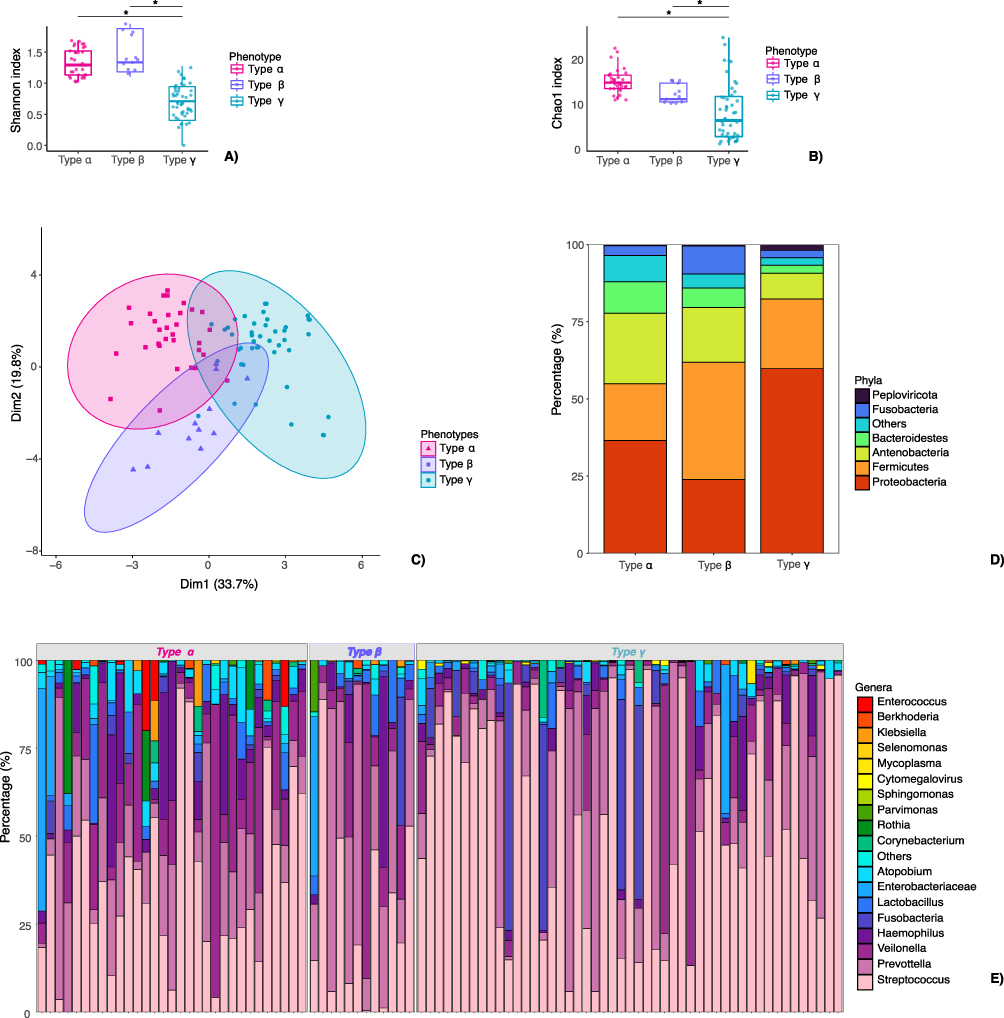 |
Figure 3 Microbiota signatures for patients with different phenotypes. (A and B) Alpha diversity of lung microbiota from patients with different phenotypes. Alpha diversity was evaluated with the Shannon index and the Chao1 index. Patients with phenotype γ had significantly lower alpha diversity than the other two phenotypes. *P < 0.05. (C) Beta diversity as evaluated with the Bray-Curtis dissimilarity metric plotted in a principal coordinate analysis (PCoA). The analysis showed separation of species in phenotypes and revealed an apparent pattern of clustering. (D) Average microbial compositions of phenotypes at the phylum level. In type γ, the most abundance of phylum were Proteobacteria, Firmicutes, Actinobacteria, Bacteroidetes, Fusobacteria, and Peploviricota, their proportion were slightly different from type α or type β. (E) Microbial compositions of different samples within phenotypes at the genus level. On the genus level, the most abundant genera were Streptococcus, Prevotella, Veillonella, and Haemophilus across phenotypes. |
The beta diversity among phenotypes was analyzed by PCoA with the Bray-Curtis dissimilarity metric, which showed the separation of species in phenotypes and revealed an apparent pattern of clustering (Figure 3C). The contribution of phylum and genus to the lung microbiota of phenotypes were depicted in Figure 3D and E. In type γ, the most abundant phylum were Proteobacteria, Firmicutes, Actinobacteria, Bacteroidetes, Fusobacteria, and Peploviricota, their proportions were slightly different from those in type α or type β.
On the genus level, the most abundant genera (Figure 3E) were Streptococcus, Prevotella, Veillonella, and Haemophilus across phenotypes. Figure 4 depicts significant differences of species in phenotypes. Most prominently, Human betaherpesvirus 5, Fusobacterium necrophorum, Streptococcus pneumoniae, Human alphaherpesvirus 1, Staphylococcus cohnii, and Veillonella parvula were significantly enriched in type γ when compared to type α or type β. In type α, the significantly enriched genera were Stenotrophomonas maltophilia, Enterococcus faecium, and Klebsiella pneumoniae, while in type β, Staphylococcus haemolyticus and Candida albicans were with high abundance.
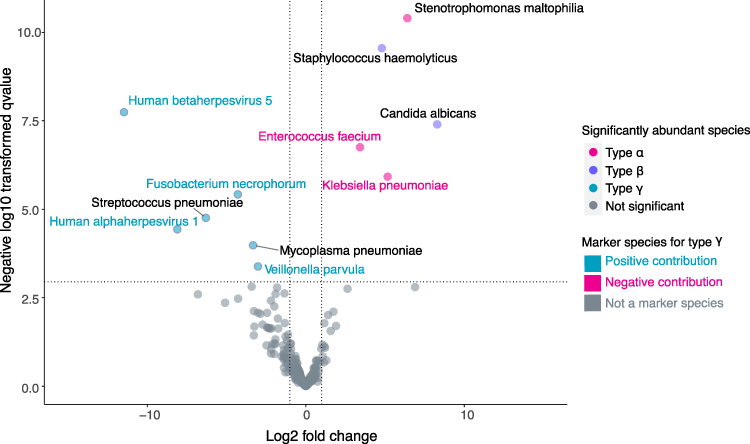 |
Figure 4 Enrichment of species between type γ and other types. Lung microbiota composition data was processed by edgeR to test enriched species between type γ and the other two phenotypes. Most prominently, Human betaherpesvirus 5, Fusobacterium necrophorum, Streptococcus pneumoniae, Human alphaherpesvirus 1, Staphylococcus cohnii, and Veillonella parvula were significantly enriched in type γ when compared to type α or type β. In type α, the significantly enriched genera were Stenotrophomonas maltophilia, Enterococcus faecium, and Klebsiella pneumoniae. While in type β, Staphylococcus haemolyticus and Candida albicans were in high abundance. Green dots represent significantly differentially abundant species in type γ. Red and blue dots represent significantly differentially abundant species in type α and type β. Species with name colored in green: within the genus that was selected by a random forest model for type γ, positive contributed to the detection of type γ. Species with names colored in red: within the genus were selected by a random forest model for type γ, negatively contributed to the detection of type γ. Black colored species were not marker species. Abbreviation: FDR, False Discovery Rate. |
The etiological results of the patient were reported in Figures S1 and S2. In general, mNGS plus the standard method identified pathogens in 72.09% of the included patients. In 43.48% of the cases, the tmNGS and standard method had the same results (Figure S1). mNGS had an obvious advantage in detecting virus (for viruses cannot be cultured by the standard method) and rarely were the cases that mNGS missed the pathogen, while culture showed positive results (in 7 cases, Figure S2).
Lung Microbiota as Markers for Type γ
We next explored whether lung microbiota could be used as markers for specified phenotypes. Using the random forest method, we built a random forest model that correlated microbiota composition (on the genus level) with type γ. We used a 10-fold cross-validation with five repeats to evaluate the importance of predictor genera. The cross-validation error stabilized with 17 genera were used as markers (Figure 5A). In these markers, 11 genera had higher abundance in type γ than the other two types (positive contribution), while 6 markers had lower abundance in type γ (Figure 5B, negative contribution). In the study cohort, the random forest model achieved an AUC (area under curve) of 0.793 (Figure 5C).
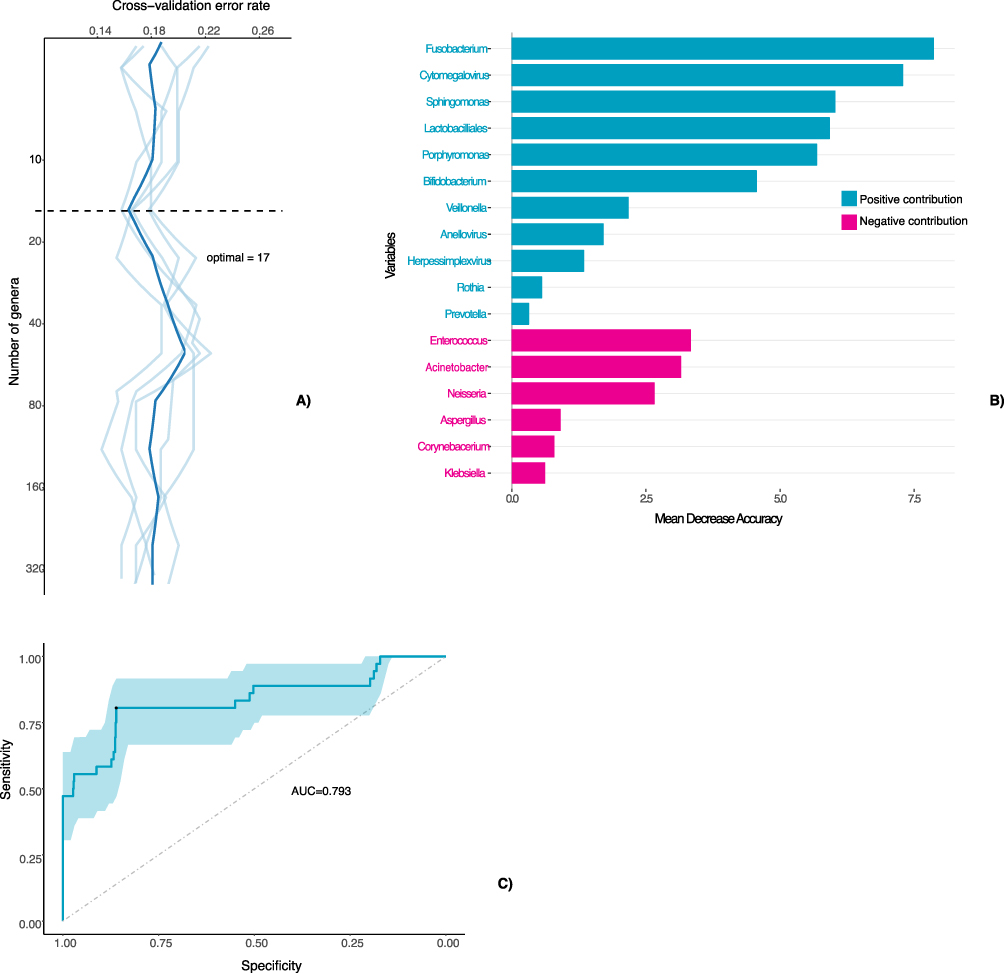 |
Figure 5 Random forest model for detection of type γ using lung microbiota data. (A) Ten-fold cross-validation error as a function of the number of genera used to differentiate type γ and other phenotypes in order of variable importance. The calculated optimal number of genera was 17. (B) The top 17 microbe genera were identified by random-forest classification of the abundance of lung microbiota in different phenotypes. Biomarker genera are ranked in descending order of importance to the accuracy of the model. Green: positively contributed to the detection of type γ. Red: Negatively contributed to the detection of type γ. (C) Performance of random forest model in detecting type γ, evaluated with ROC curve the random forest model achieved an AUC of 0.793. Abbreviations: AUC, Area Under the Curve; ROC, the Receiver Operating Characteristic. |
Discussion
In the present study, we identified three clinical phenotypes in immunocompromised patients with ARDS. Type γ presents with no significant inflammation but more severe oxygenation failure and worse outcomes and is characterized by distinct microbiota signatures and outcomes. We also developed a lung microbiota-derived random forest model to differentiate patients with type γ from other phenotypes. These findings will facilitate prognosis evaluation in clinical practice and possible mechanism exploration for ARDS in future studies.
Studies on ARDS have been hampered by the heterogeneity of patients.27,28 In consequence, trials on potential interventions failed to produce repeatable results.29–32 Recently, the phenotype classification of ARDS patients provided a probable solution for this issue: Calfee et, al divided ARDS patients into two phenotypes, with the hyper-inflammatory phenotype expressing higher inflammatory cytokines, an increased incidence of shock, and non-pulmonary sepsis.33 In the following studies, the two phenotypes have been proven to respond differently to treatments including end-expiratory pressure,33 fluid therapy,21 and simvastatin.34 In previous studies on ARDS, about 31% percent of ARDS was triggered by sepsis, sepsis-induced ARDS was marked by uncontrolled inflammation, multiple organ failures, and high morbidity and mortality.35,36 Corresponding to this phenomenon, suppression of inflammation with corticosteroid has improved patient outcomes in a study that included more sepsis-induced ARDS.16 However, in our study, there was no advantage in survival for the more “hypo-inflammatory” type γ. On the contrary, higher mortality and lower ventilator free days were observed in this group of patients.
In type γ, there were more patients with stem cell transplantation and chemotherapy-induced neutropenia. As the hematopoietic function was suppressed or not successfully reconstructed, patients had low hemoglobin level and low platelet levels. More importantly, they had extremely low levels of white blood cell and cytokine levels. As a result, the unexpectedly poor outcome of type γ may arise from relatively insufficient inflammation responses. Cortigiani et, al reported that regardless of ARDS severity, immunocompromised patients had higher mortality rates than the immunocompetent ones.37 This suggested that immunocompromised ARDS patients may be hindered by insufficient inflammatory response to control infection. A similar phenomenon had been observed in end stage sepsis patients, called sepsis-related immunosuppression.38 In these patients, immunosuppression was triggered by macrophage overactivation and T cell disfunction.39,40 This may contribute to negative results of glucocorticoid or other inhibition therapies in sepsis studies41,42 For patients in a state of insufficient inflammatory response, immune suppression induced by drugs might be catastrophic.
Based on findings from the immunocompromised hosts, we can infer that immunological evaluation for ARDS patients may need to be performed in a quantified manner, including immune cell function assessments, which will inform us whether the patient has adequate inflammatory response. From another perspective, clinical phenotypes but not classical methods (like SOFA) are more valuable in predicting patient outcomes for the subjects of the present study, for positive correlations between inflammation (evaluated with IL-6) and SOFA score only existed within type α (Figure 1E). However, the SOFA score was not correlated with mortality in our cohort.
As far as we know, this is the first study that has investigated lung microbiota signatures in immunocompromised hosts with ARDS. Some of the results we had in this study were consistent with previous reports. First, loss of alpha diversity was observed in the type γ- A phenotype that had worse outcomes. In immunocompetent hosts with ARDS,43 chronic obstructive pulmonary disease (COPD) or idiopathic pulmonary fibrosis (IPF)44,45, the relation between dysbiosis and disease progression also exists. However, whether the dysbiosis is a result of the aggravation of diseases or the cause of the aggravation is not clear.
Second, in type α, which is characterized by more active inflammation, more gut-associated bacteria were enriched. Dickson et, al. reported the association of gut bacteria in the lower respiratory tract and intensified systemic inflammation.46 Similar results were reported, but no study has proved an association of gut bacteria and higher mortality or lower successful extubation rate.43 On the contrary, we observed a better outcome in gut-bacteria enriched and inflammation-activated immunocompromised hosts (type α) than in the inflammation-inactive hosts (type γ), which indicates that an adequate host response is necessary for infection control. Thus, the enrichment of specified microbes might, to some extent, actually a result of the host immune responses.47
We also developed a microbiota data-based random forest model to distinguish type γ from other types. The model has a satisfying classification ability. It proved that microbiota composition is an effective marker for clinical phenotypes. With the advance of rapid NGS analyzing techniques (ie, nanopore-targeted sequencing), the turn-around time for NGS was greatly reduced from around 24 hours48 to theoretically 6 hours.49 Based on our model, a specified testing panel can be developed for detecting high-risk type γ patients. The microbes in the model should be further evaluated for their role and their functional contribution in host–microbe interaction.
The study has several shortcomings: First, the robustness of the clustering may be limited by the relatively limited sample size.50 The results need to be validated in larger cohorts. Second, what we presented in this study was a static description of clinical variables and lung microbiota signatures. The trend of host inflammation response and microbiota transformation over the scale of time and disease state can also provide valuable information,51 which is worth exploring in further studies.
Conclusion
Immunocompromised patients with pneumonia-related ARDS can be clustered into three clinical phenotypes, namely type α, type β, and type γ. Phenotypes were distinguished from each other with different outcomes and lung microbiota signatures. Type γ, which was characterized by insufficient inflammation response and worse outcomes, can be detected with a random forest model based on lung microbiota markers.
Data Sharing Statement
The data that support the findings of this study are available from the corresponding author upon reasonable request.
Ethics Approval and Consent to Participate
All participants of this study have signed the informed consent sheet and consented to participate. If the patient lacks capacity to give consent, eg, 1. dementia, 2. delirium 3. shock, stroke, hypoglycemia or sedatives induced unconsciousness. Once the patients regained consciousness, they will be asked to provide their own informed consent to participate in this study.
Consent for Publication
All authors have read this manuscript and consented to publication.
Funding
This project was supported by Peking University International Hospital Research Funds (No. YN2021QN02), The National Natural Science Foundation of China (Grant No. 82202326), Clinical Medicine Plus X – Young Scholars Project, Peking University, The Fundamental Research Funds for the Central Universities (PKU2022LCXQ031), Wu Jieping Medical Foundation Runze Fund for Critical Care Medicine (NO320·6750·2022-2-34) and Peking University People’s Hospital Scientific Research Development Funds(No. RDJP2022-54).
Disclosure
The authors report no conflicts of interest in this work.
References
1. Brenner H. Long-term survival rates of cancer patients achieved by the end of the 20th century: a period analysis. Lancet. 2002;360(9340):1131–1135. doi:10.1016/S0140-6736(02)11199-8
2. Sun W, Huang X. Role of allogeneic haematopoietic stem cell transplantation in the treatment of adult acute lymphoblastic leukaemia in the era of immunotherapy. Chin Med J. 2022;135(8):890–900. doi:10.1097/CM9.0000000000001898
3. Kaul A, Gordon C, Crow MK, et al. Systemic lupus erythematosus. Nat Rev Dis Primers. 2016;2(1). doi:10.1038/nrdp.2016.39
4. Gatti M, Rinaldi M, Bussini L, et al. Clinical outcome in solid organ transplant recipients affected by COVID-19 compared to general population: a systematic review and meta-analysis. Clin Microbiol Infect. 2022;28(8):1057–1065. doi:10.1016/j.cmi.2022.02.039
5. Soerjomataram I, Lortet-Tieulent J, Parkin DM, et al. Global burden of cancer in 2008: a systematic analysis of disability-adjusted life-years in 12 world regions. Lancet. 2012;380(9856):1840–1850. doi:10.1016/S0140-6736(12)60919-2
6. Lueck C, Stadler M, Koenecke C, et al. Improved short- and long-term outcome of allogeneic stem cell recipients admitted to the intensive care unit: a retrospective longitudinal analysis of 942 patients. Intensive Care Med. 2018;44(9):1483–1492. doi:10.1007/s00134-018-5347-x
7. Matthay MA, Arabi Y, Arroliga AC, et al. A new global definition of acute respiratory distress syndrome. Am J Respir Crit Care Med. 2023;2023:1.
8. van Vliet M, Verburg IWM, van den Boogaard M, et al. Trends in admission prevalence, illness severity and survival of haematological patients treated in Dutch intensive care units. Intensive Care Med. 2014;40(9):1275–1284. doi:10.1007/s00134-014-3373-x
9. Shen J, Hu Y, Zhao H, et al. Risk factors of non-invasive ventilation failure in hematopoietic stem-cell transplantation patients with acute respiratory distress syndrome. Ther Adv Respir Dis. 2020;14:175346662091422. doi:10.1177/1753466620914220
10. Azevedo LCP, Caruso P, Silva UVA, et al. Outcomes for patients with cancer admitted to the ICU requiring ventilatory support. Chest. 2014;146(2):257–266. doi:10.1378/chest.13-1870
11. Hilbert G, Gruson D, Vargas F, et al. Noninvasive ventilation in immunosuppressed patients with pulmonary infiltrates, fever, and acute respiratory failure. N Engl J Med. 2001;344(7):481–487. doi:10.1056/NEJM200102153440703
12. Frat J-P, Ragot S, Girault C, et al. Effect of non-invasive oxygenation strategies in immunocompromised patients with severe acute respiratory failure: a post-hoc analysis of a randomised trial. Lancet Respir Med. 2016;4(8):646–652. doi:10.1016/S2213-2600(16)30093-5
13. Lemiale V, Mokart D, Resche-Rigon M, et al. Effect of noninvasive ventilation vs oxygen therapy on mortality among immunocompromised patients with acute respiratory failure. JAMA. 2015;314(16):1711. doi:10.1001/jama.2015.12402
14. Dumas G, Lemiale V, Rathi N, et al. Survival in immunocompromised patients ultimately requiring invasive mechanical ventilation: a pooled individual patient data analysis. Am J Respir Crit Care Med. 2021;204(2):187–196. doi:10.1164/rccm.202009-3575OC
15. Chaudhuri D, Sasaki K, Karkar A, et al. Corticosteroids in COVID-19 and non-COVID-19 ARDS: a systematic review and meta-analysis. Intensive Care Med. 2021;47(5):521–537. doi:10.1007/s00134-021-06394-2
16. Villar J, Ferrando C, Martínez D, et al. Dexamethasone treatment for the acute respiratory distress syndrome: a multicentre, randomised controlled trial. Lancet Respir Med. 2020;8(3):267–276. doi:10.1016/S2213-2600(19)30417-5
17. Hu Y, Shen J, An Y, Liu S. Early high dose corticosteroid therapy in hematopoietic stem cell transplantation patients with acute respiratory distress syndrome: a propensity score matched study. Ther Adv Respir Dis. 2021;15:175346662110093. doi:10.1177/17534666211009397
18. Dequin P-F, Heming N, Meziani F, et al. Effect of hydrocortisone on 21-day mortality or respiratory support among critically ill patients with COVID-19. JAMA. 2020;324(13):1298. doi:10.1001/jama.2020.16761
19. National Heart, Lung, and Blood Institute Acute Respiratory Distress Syndrome (ARDS) Clinical Trials Network. Efficacy and safety of corticosteroids for persistent acute respiratory distress syndrome. N Engl J Med. 2006;354(16):1671–1684. doi:10.1056/NEJMoa051693
20. Wilson JG, Calfee CS. ARDS subphenotypes: understanding a heterogeneous syndrome. Critical Care. 2020;24(1). doi:10.1186/s13054-020-2778-x
21. Famous KR, Delucchi K, Ware LB, et al. Acute respiratory distress syndrome subphenotypes respond differently to randomized fluid management strategy. Am J Respir Crit Care Med. 2017;195(3):331–338. doi:10.1164/rccm.201603-0645OC
22. Sinha P, Furfaro D, Cummings MJ, et al. Latent class analysis reveals COVID-19–related acute respiratory distress syndrome subgroups with differential responses to corticosteroids. Am J Respir Crit Care Med. 2021;204(11):1274–1285. doi:10.1164/rccm.202105-1302OC
23. Dickson RP, Schultz MJ, van der Poll T, et al. Lung microbiota predict clinical outcomes in critically ill patients. Am J Respir Crit Care Med. 2020;201(5):555–563. doi:10.1164/rccm.201907-1487OC
24. Kyo M, Nishioka K, Nakaya T, et al. Unique patterns of lower respiratory tract microbiota are associated with inflammation and hospital mortality in acute respiratory distress syndrome. Respir Res. 2019;20(1). doi:10.1186/s12931-019-1203-y
25. Fan E, Brodie D, Slutsky AS. Acute respiratory distress syndrome: advances in diagnosis and treatment. JAMA. 2018;319:698.
26. Chen H, Yin Y, Gao H, et al. Clinical utility of in-house metagenomic next-generation sequencing for the diagnosis of lower respiratory tract infections and analysis of the host immune response. Clin Infect Dis. 2020;71(Supplement_4):S416–S426. doi:10.1093/cid/ciaa1516
27. Gorman EA, O’Kane CM, McAuley DF. Acute respiratory distress syndrome in adults: diagnosis, outcomes, long-term sequelae, and management. Lancet. 2022;400(10358):1157–1170. doi:10.1016/S0140-6736(22)01439-8
28. Maslove DM, Tang B, Shankar-Hari M, et al. Redefining critical illness. Nature Med. 2022;28(6):1141–1148. doi:10.1038/s41591-022-01843-x
29. Lim J, Litton E. Airway pressure release ventilation in adult patients with acute hypoxemic respiratory failure: a systematic review and meta-analysis. Crit Care Med. 2019;47(12):1794–1799. doi:10.1097/CCM.0000000000003972
30. Othman F, Alsagami N, Alharbi R, et al. The efficacy of airway pressure release ventilation in acute respiratory distress syndrome adult patients: a meta-analysis of clinical trials. Ann Thorac Med. 2021;16(3):245–252. doi:10.4103/atm.ATM_475_20
31. Girard TD, Kress JP, Fuchs BD, et al. Efficacy and safety of a paired sedation and ventilator weaning protocol for mechanically ventilated patients in intensive care (Awakening and Breathing Controlled trial): a randomised controlled trial. Lancet. 2008;371(9607):126–134. doi:10.1016/S0140-6736(08)60105-1
32. National Heart, Lung, and Blood Institute PETAL Clinical Trials Network. Early neuromuscular blockade in the acute respiratory distress syndrome. N Engl J Med. 2019;380:1997–2008.
33. Calfee CS, Delucchi K, Parsons PE, et al. Subphenotypes in acute respiratory distress syndrome: latent class analysis of data from two randomised controlled trials. Lancet Respir Med. 2014;2(8):611–620. doi:10.1016/S2213-2600(14)70097-9
34. Calfee CS, Delucchi KL, Sinha P, et al. Acute respiratory distress syndrome subphenotypes and differential response to simvastatin: secondary analysis of a randomised controlled trial. Lancet Respir Med. 2018;6(9):691–698. doi:10.1016/S2213-2600(18)30177-2
35. Bersten AD, Edibam C, Hunt T, et al. Incidence and mortality of acute lung injury and the acute respiratory distress syndrome in three Australian States. Am J Respir Crit Care Med. 2002;165(4):443–448. doi:10.1164/ajrccm.165.4.2101124
36. Englert JA, Bobba C, Baron RM. Integrating molecular pathogenesis and clinical translation in sepsis-induced acute respiratory distress syndrome. JCI Insight. 2019;4(2). doi:10.1172/jci.insight.124061
37. Cortegiani A, Madotto F, Gregoretti C, et al. Immunocompromised patients with acute respiratory distress syndrome: secondary analysis of the LUNG SAFE database. Critical Care. 2018;22(1):157. doi:10.1186/s13054-018-2079-9
38. Gotts JE, Matthay MA. Sepsis: pathophysiology and clinical management. BMJ. 2016;i1585. doi:10.1136/bmj.i1585
39. Karakike E, Giamarellos-Bourboulis EJ. Macrophage activation-like syndrome: a distinct entity leading to early death in sepsis. Front Immunol. 2019;10. doi:10.3389/fimmu.2019.00055
40. Hotchkiss RS, Monneret G, Payen D. Sepsis-induced immunosuppression: from cellular dysfunctions to immunotherapy. Nat Rev Immunol. 2013;13(12):862–874. doi:10.1038/nri3552
41. Sprung CL, Annane D, Keh D, et al. Hydrocortisone therapy for patients with septic shock. N Engl J Med. 2008;358(2):111–124. doi:10.1056/NEJMoa071366
42. Clark MA, Plank LD, Connolly AB, et al. Effect of a chimeric antibody to tumor necrosis factor-alpha on cytokine and physiologic responses in patients with severe sepsis-A randomized, clinical trial. Crit Care Med. 1998;26(10):1650–1659. doi:10.1097/00003246-199810000-00016
43. Britton N, Elbehairy AF, Mensink-Bout SM, et al. European respiratory society international congress 2020: highlights from best-abstract awardees. Breathe. 2020;16(4). doi:10.1183/20734735.0270-2020
44. Dickson RP, Erb-Downward JR, Huffnagle GB. The role of the bacterial microbiome in lung disease. Expert Rev Respir Med. 2013;7(3):245–257. doi:10.1586/ers.13.24
45. Garcia-Nuñez M, Millares L, Pomares X, et al. Severity-related changes of bronchial microbiome in chronic obstructive pulmonary disease. J Clin Microbiol. 2014;52(12):4217–4223. doi:10.1128/JCM.01967-14
46. Dickson RP, Singer BH, Newstead MW, et al. Enrichment of the lung microbiome with gut bacteria in sepsis and the acute respiratory distress syndrome. Nat Microbiol. 2016;1(10). doi:10.1038/nmicrobiol.2016.113
47. Zheng D, Liwinski T, Elinav E. Interaction between microbiota and immunity in health and disease. Cell Res. 2020;30(6):492–506. doi:10.1038/s41422-020-0332-7
48. Gu W, Deng X, Lee M, et al. Rapid pathogen detection by metagenomic next-generation sequencing of infected body fluids. Nature Med. 2021;27(1):115–124. doi:10.1038/s41591-020-1105-z
49. Zhang Y, Lu X, Tang LV, et al. Nanopore-targeted sequencing improves the diagnosis and treatment of patients with serious infections. mBio. 2023;14:e03055.
50. Dalmaijer ES, Nord CL, Astle DE. Statistical power for cluster analysis. BMC Bioinf. 2022;23(1):205. doi:10.1186/s12859-022-04675-1
51. Natalini JG, Singh S, Segal LN. The dynamic lung microbiome in health and disease. Nat Rev Microbiol. 2023;21(4):222–235. doi:10.1038/s41579-022-00821-x
 © 2024 The Author(s). This work is published and licensed by Dove Medical Press Limited. The full terms of this license are available at https://www.dovepress.com/terms.php and incorporate the Creative Commons Attribution - Non Commercial (unported, v3.0) License.
By accessing the work you hereby accept the Terms. Non-commercial uses of the work are permitted without any further permission from Dove Medical Press Limited, provided the work is properly attributed. For permission for commercial use of this work, please see paragraphs 4.2 and 5 of our Terms.
© 2024 The Author(s). This work is published and licensed by Dove Medical Press Limited. The full terms of this license are available at https://www.dovepress.com/terms.php and incorporate the Creative Commons Attribution - Non Commercial (unported, v3.0) License.
By accessing the work you hereby accept the Terms. Non-commercial uses of the work are permitted without any further permission from Dove Medical Press Limited, provided the work is properly attributed. For permission for commercial use of this work, please see paragraphs 4.2 and 5 of our Terms.