")
Back to Journals » Drug Design, Development and Therapy » Volume 10
Pharmacophore modeling and in silico toxicity assessment of potential anticancer agents from African medicinal plants
Authors Ntie-Kang F , Simoben CV, Karaman B, Ngwa VF, Judson PN, Sippl W, Meva’a Mbaze L
Received 9 March 2016
Accepted for publication 8 April 2016
Published 4 July 2016 Volume 2016:10 Pages 2137—2154
DOI https://doi.org/10.2147/DDDT.S108118
Checked for plagiarism Yes
Review by Single anonymous peer review
Peer reviewer comments 2
Editor who approved publication: Prof. Dr. Wei Duan
Fidele Ntie-Kang,1,2,* Conrad Veranso Simoben,1,2,* Berin Karaman,1 Valery Fuh Ngwa,3 Philip Neville Judson,4 Wolfgang Sippl,1 Luc Meva’a Mbaze5
1Department of Pharmaceutical Chemistry, Martin-Luther University of Halle-Wittenberg, Halle (Saale), Germany; 2Department of Chemistry, University of Buea, Buea, Cameroon; 3Interuniversity Institute For Biostatistics and Statistical Bioinformatics (I-BioStat), University of Hasselt, Hasselt, Belgium; 4Chemical Bioactivity Information Centre, Harrogate, UK; 5Department of Chemistry, Faculty of Science, University of Douala, Douala, Cameroon
*These authors contributed equally to this work
Abstract: Molecular modeling has been employed in the search for lead compounds of chemotherapy to fight cancer. In this study, pharmacophore models have been generated and validated for use in virtual screening protocols for eight known anticancer drug targets, including tyrosine kinase, protein kinase B β, cyclin-dependent kinase, protein farnesyltransferase, human protein kinase, glycogen synthase kinase, and indoleamine 2,3-dioxygenase 1. Pharmacophore models were validated through receiver operating characteristic and Güner–Henry scoring methods, indicating that several of the models generated could be useful for the identification of potential anticancer agents from natural product databases. The validated pharmacophore models were used as three-dimensional search queries for virtual screening of the newly developed AfroCancer database (~400 compounds from African medicinal plants), along with the Naturally Occurring Plant-based Anticancer Compound-Activity-Target dataset (comprising ~1,500 published naturally occurring plant-based compounds from around the world). Additionally, an in silico assessment of toxicity of the two datasets was carried out by the use of 88 toxicity end points predicted by the Lhasa’s expert knowledge-based system (Derek), showing that only an insignificant proportion of the promising anticancer agents would be likely showing high toxicity profiles. A diversity study of the two datasets, carried out using the analysis of principal components from the most important physicochemical properties often used to access drug-likeness of compound datasets, showed that the two datasets do not occupy the same chemical space.
Keywords: anticancer, natural products, medicinal plants, pharmacophore, toxicity, virtual screening
Introduction
In spite of the enormous efforts and progress in the field of cancer research, cancer is the second most common disease-related cause of human mortality, only next to myocardial infarction.1 According to the recent World Health Organization reports, cancer alone is responsible for ~7.6 million deaths (~13% of all deaths) annually,2 and it is estimated that the threat of cancer-related diseases will worsen if no measures are taken.3 Additionally, plant-derived NPs have played a significant role in drug discovery, by being an important source of several clinically useful drugs,4–8 including anticancer agents.9
A cancerous growth is often defined as any malignant tumor. A neoplasm or tumor is an abnormal mass of tissue whose growth exceeds that of normal tissues and whose growth is uncoordinated with that of the latter. Such cancerous growth continues in the same manner after cessation of the stimuli that had initiated it.9,10 The methods of cancer treatment include radiation therapy, surgery, and chemotherapy. However, the first two treatment methods are only successful at the early localized stages of the disease, while chemotherapy is the main treatment method for malignancies because it has the ability to cure widespread cancer even at the later stages. In the search for lead compounds of cancer chemotherapy and prevention, research groups have often resorted to medicinal plants, based on their ethnobotanical uses in the treatment of several cancer-related symptoms and ailments.9,11–25 This is because local and traditional knowledge has been the starting point for many successful drug development projects over the last few decades, as recorded in several literature references.9,10,16–18,26–28 The African flora, for example, is known to contain promising anticancer agents, both based on traditional knowledge and isolated bioactive metabolites that have tested positive against a number of cancer cell lines.29–31 In silico methods of drug discovery programs have proven to be useful in quickly providing lead compounds from enormous databases and also help in lead optimization. This justifies the development of compound libraries, particularly “focused” library scaffolds of compounds that have shown some potency in experimental assays against a particular disease or a drug target. A recent study showed that ~400 compounds from the African medicinal plants, with demonstrated in vitro and/or in vivo anticancer, cytotoxic, and antiproliferative activities, have been identified.32 This dataset (AfroCancer) has been compared with a larger dataset of ~1,500 compounds contained in the Naturally Occurring Plant-based Anticancer Compound-Activity-Target (NPACT) database and with the much larger dataset contained within the Dictionary of Natural Products.32–34 The drug-likeness properties of these plant-derived anticancer datasets have been explored in the previous studies, proving to be interesting starting points for anticancer lead discovery.32,33 It is noteworthy that approximately half of known anticancer drugs are either NPs or NP-related synthetic compounds.35–37 Despite the enormous potential of NPs from the African flora,38–40 little has been done to exploit them into real marketable drugs.41 This calls for efforts from within the continent for laying the groundwork for anticancer drug discovery projects from the floral matter.
The application of in silico (computer-based) modeling in the search for lead compounds is a promising endeavor in drug discovery, since it often accelerates the process and cuts down costs.42 Virtual screening methods are useful because, in principle, they narrow down the number of compounds to be actually tested in biological assays. This is practicable when the in silico scoring methods are sufficiently able to discriminate between active and inactive ones.43,44 The approaches of docking,45–47 quantitative structure-activity relationship,48,49 and pharmacophore searching47,49–53 have been previously employed with relative success in anticancer lead generation programs. The previous in silico modeling efforts targeting NPs from the African flora have been focused on the building of datasets for virtual screening30,54–56 and pharmacokinetic profiling of the derived datasets.30,57–59 The aim of the current study was to employ molecular modeling methods to access the toxicity profiles of the aforementioned datasets32,33 of promising plant-derived anticancer agents and to evaluate the performance of derived pharmacophore models for virtual screening, in a quest to identify new and/or promising anticancer lead compounds from the African flora.
Materials and methods
Data collection and analysis
The dataset for naturally occurring compounds with promising anticancer properties (AfroCancer) has been recently described.32 The compounds of the NPACT database were downloaded from the official webpage (http://crdd.osdd.net/raghava/npact/)34 and prepared for virtual screening as previously described.33
Pharmacophore modeling approach
All pharmacophore modeling was carried out using the LigandScout software (Inte:Ligand, Vienna, Austria).60 All protein–ligand complexes in this study were retrieved from the protein databank61 and prepared as previously described.32 The datasets of active compounds against each drug target were identified from the literature sources cited in the Results section (Table 1). Small molecule modeling of the compounds active against each target was carried out using the Molecular Operating Environment (MOE) (Montreal, QC, Canada) software62 running on a Linux workstation with a 3.5 GHz Intel Core 2 Duo processor (San Jose, CA, USA). The three-dimensional (3D) structures were generated using the builder module of MOE, and energy minimization was subsequently carried out using the MMFF94 force field63 until a gradient of 0.01 kcal/mol was reached. In generating the 3D structures, both R and S forms of stereoisomers were generated in the case of racemic mixtures. Additionally, the ligand databases were given a preliminary treatment using the LigPrep software (Schrödinger LLC, NY, USA).64 Protonation states at biologically relevant pH were correctly assigned (group I metals in simple salts were disconnected, strong acids were deprotonated, strong bases were protonated, and explicit hydrogens were added), and conformers were generated. The generated conformer datasets were further inspected visually, eg, piperazines were mono- or diprotonated taking into account the neighboring groups; piperidines, pyrrolidines, and tertiary aliphatic amines were charged positively always; pyrimidones were also represented as hydroxy pyrimidines; and for ethylenediamines, both neutral and monoprotonated forms were generated. The 3D structures of the compounds and conformers were then saved as individual .mol2 files, subsequently included into a MOE database (.mdb) file and exported to the .ldb file, which is suitable for use in virtual screening workflows using the LigandScout software.60 The performance of a pharmacophore model in virtual screening experiments is often tested by its ability to discriminate between known active compounds and decoys (supposed to be inactive). Such enrichment tests were performed on the set of active compounds (training set) and later used to screen for hits from the AfroCancer and NPACT libraries, using the generated pharmacophore models. In order to avoid artificial enrichment in assessing the performances of the generated pharmacophore models in virtual screening, decoy libraries were generated using the commercially available database Directory of Useful Decoys, Enhanced (DUD-E; http://dude.docking.org),65 ie, 50 decoys per active ligand. Simplified Molecular Input Line Entry System strings of the active compounds were provided for the DUD-E decoy generation tool, and 50 decoys per active ligand were generated based on similar physical properties of active compounds, such as molecular weight (MW), Log P, H-bond donors (HBDs) and H-bond acceptors (HBAs), number of rotatable bonds, and net molecular charge. The motivation behind using decoys with similar one-dimensional physicochemical properties but dissimilar two-dimensional topology is to avoid artificial enrichment in assessing the performances of the generated pharmacophore models in virtual screening.
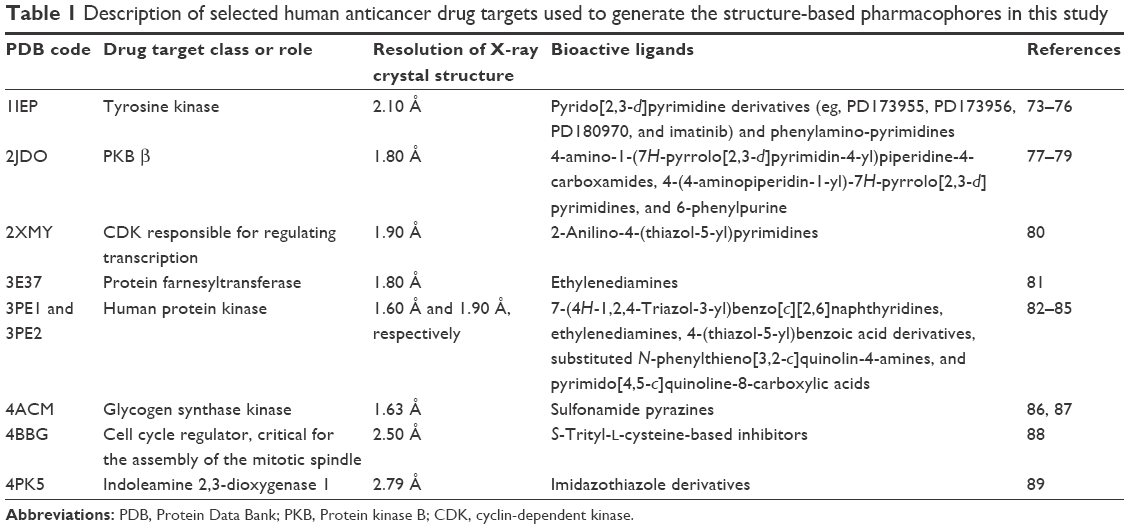 | Table 1 Description of selected human anticancer drug targets used to generate the structure-based pharmacophores in this study |
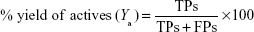
Both libraries of active compounds and decoys were run through or “fitted into” the generated pharmacophore models. The poses were scored (ranked) using the pharmacophore fit score function implemented in LigandScout.60 In general, true positive (TP)/false positive (FP) hit rates, true negative (TN)/false negative (FN) hit rates, enrichment factor (EF), goodness of hits, and the receiver operating characteristic (ROC) curve–area under the ROC curve (AUC) are among the most common quality parameters used in the pharmacophore model evaluation experiments. To assess the performance of each pharmacophore scoring scheme used in this study, some important measures were considered, eg, the percentage yield of active compounds (Ya), percentage actives, and Goodness of a Hit list (Güner–Henry [GH] scoring). The percentage yield of actives was defined as the ratio of actives found in the hit list to the total number of compounds in the hit list, given by the following equation:
|
|
where the TPs are defined as bioactive compounds that are correctly recognized by the pharmacophore model and the FPs are defined as inactive compounds that fit into the pharmacophore model. The percentage of actives represent the ratio of active compounds in the hit list (TPs) to the total number of actives in the dataset (training set), given by the following equation:
|
|

where A is the total number of compounds in the dataset of actives. The sensitivity (Se), specificity (Sp), and EF parameters shown in Equations 3–5, respectively, were computed and used as indicators of the GH score (Equation 6),66–68 ie, goodness of hit (GH score):
|
|

|
|

|
|

|
|
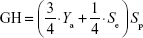
where FNs are bioactive compounds that are not recognized by a model, TNs are inactive compounds that do not fit into the pharmacophore model, and D is the total number of compounds in each dataset (actives + decoys). The GH score ranges from 0 to 1, where a value of 1 signifies an ideal model and a value of 0 signifies a null model. The ROC curve is a graphical plot of the TP rate (Se) versus FP rate (1−Sp), while the AUC is an important method of measuring the performance of the test. The equation for computing the AUC is shown as follows:
|
|
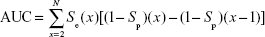
where Se (x) is the percent of the TPs versus the total positives at rank position x and (1−Sp)(x) is the percent of the FPs versus the total negatives at rank position x.
In silico toxicity assessment methods
Toxicity prediction was carried out using Lhasa’s expert knowledge-based predictive tool, Derek software Version 3.0.1 (Lhasa Ltd, Leeds, UK),69 running on Nexus 1.5.0 platform. The two datasets (AfroCancer and NPACT) were input in .sdf format. The chosen species was human beings, and 88 toxicity end points were predicted. A full list of the predicted end points has been provided in the Supplementary materials. The toxicity prediction run was carried out for both AfroCancer and NPACT datasets, and the results were analyzed.
Diversity analysis of the AfroCancer and NPACT datasets
Diversity analysis was done by the principal component analysis (PCA) method [68] implemented in the MOE package.62 A number of simple descriptor parameters for the two datasets (AfroCancer and NPACT) were generated using the molecular descriptor calculator included in the QuSAR module of the MOE package.62 The computed descriptors include the MW, number of rotatable single bonds, lipophilicity (log P), solubility (log S), number of HBAs, number of HBDs, total hydrophobic surface area, total polar surface area, number of oxygen, number of chiral centers, number of rings, and number of Lipinski violations. In order to select the optimum number of molecular descriptors for the molecules of both datasets, QuSAR-Contingency (a statistical application in MOE) was employed. The dimensionality of the best selected descriptors, obtained from QuSAR-Contingency, was further reduced by linear transformation of the data by PCA.70 This resulted in a new (smaller) table of descriptors that are uncorrelated and normalized (mean =0 and variance =1). All computed descriptors were employed in the PCA, while the minimum variance was set at 98% for the final set of principal components retained. The 3D plots of the best three principal components (PCA1, PCA2, and PCA3) for both datasets were plotted on the same set of coordinate axes, with PCA1 on the x-axis, PCA2 on the y-axis, and PCA3 on the z-axis, each point on a dataset in the coordinate axes representing a molecule. In order to analyze the diversity of the scaffolds in both datasets, the compounds were fragmented using the retrosynthetic combinatorial analysis procedure algorithm.71 The LibMCS program of JKlustor was used for maximum common substructure clustering of the two datasets.72 The frequency of occurrence of each scaffold in the two datasets was computed and ranked. The most common substructures (most common substructure selection [MCSS]) of the two datasets were then tabulated and compared.
Overall rationale of the modeling methods
Data related to the protein–ligand complexes73–89 used to generate pharmacophore models for virtual screening are listed in Table 1. The biological significance of the drug targets for which the pharmacophore models were generated has been discussed in our previous study.32 Pharmacophore-based virtual screening is often an efficient method for the identification of potentially new lead compounds for further development from a virtual database.66–68 Molecules that satisfy the features of the pharmacophore models used as the 3D query are retained as hits. In this study, 3D pharmacophore models were generated and validated, while the best pharmacophore models were used as a 3D search query for retrieving potent molecules from the AfroCancer and NPACT chemical databases, which could be proposed for bioassays. The performance of each pharmacophore model was evaluated using ROC analysis,90 based on their ability to selectively capture diverse active compounds against the chosen targets from a large list of decoys or inactives. The numbers of conformers of actives and decoys for each target and characteristics for GH or “goodness of hit” scoring (eg, Sp, Se, EF, Ya, and % yield of actives) are listed in Table 2. In this study, the GH method was used to assess the pharmacophore models generated. This is because this method has been previously used to quantify model selectivity (best model), accuracy of hits, and the recall of actives from a molecule dataset consisting of known actives and inactives with relative success.91–93 The GH score has been applied for quantifying model selectivity and covering the activity space from database mining successfully47,93–98 and for evaluating the effectiveness of similarity search in databases containing both structural and biological activity data.92 GH scoring contains a coefficient used to penalize excessive hit list size when evaluating hit lists. This coefficient is calibrated by weighting the score with respect to the yield and coverage. The GH scores were computed following Equation 7, and the values are listed in Table 2, ranging from 0 to 1, with 0 indicating a null model and 1 a perfect model (containing only actives and no decoys).68 For a good model, the GH value is expected to be >0.7.47 The most promising models have been marked with an asterisk (*) on the respective GH score value. Finally, the ROC curve is a function of Se versus the Sp, and the AUC value is an important method of measuring the performance of the test.
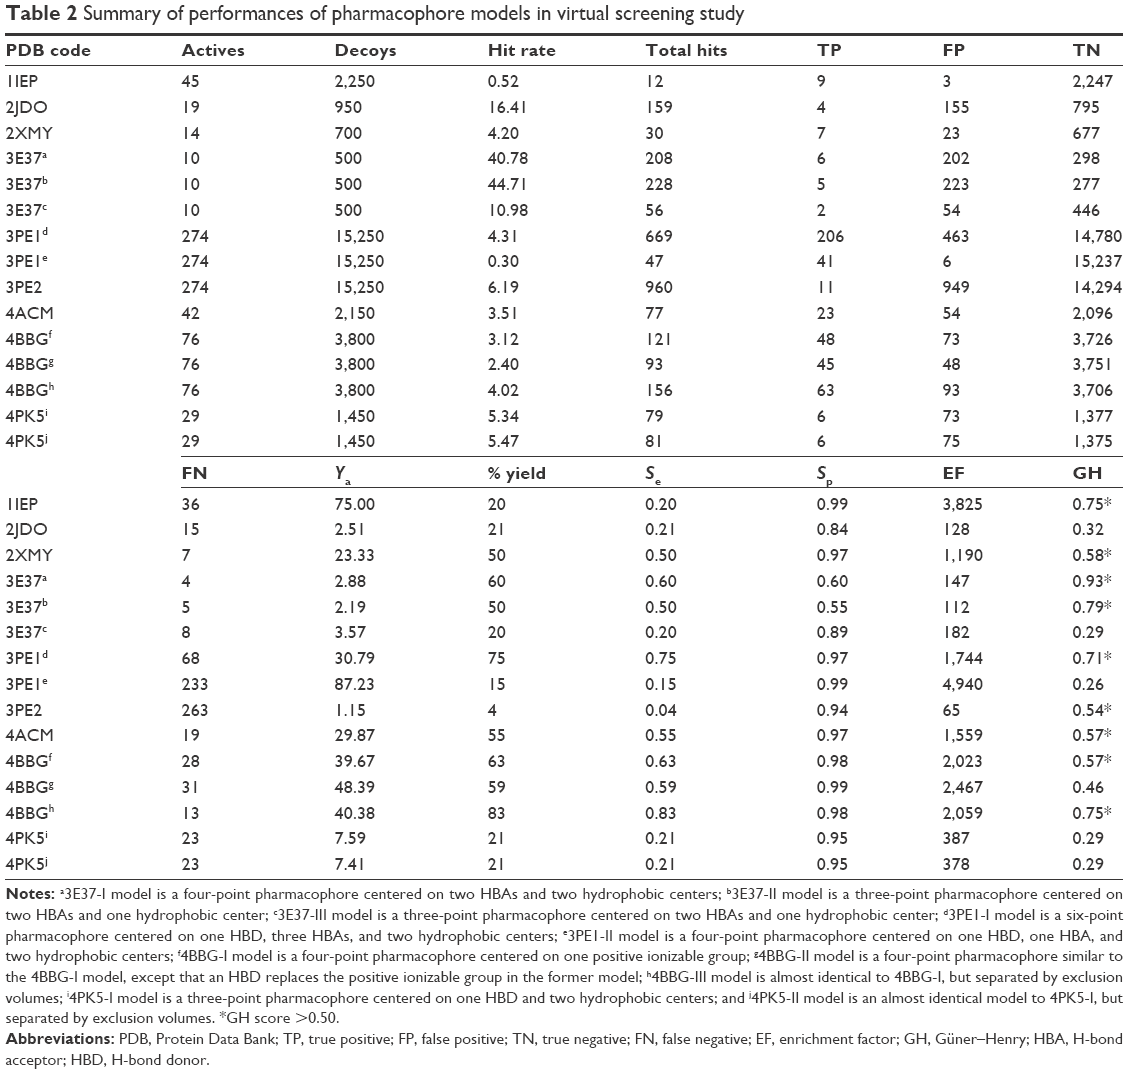 | Table 2 Summary of performances of pharmacophore models in virtual screening study |
Results and discussion
Assessment of pharmacophore models generated
For the 1IEP target, for example, the best derived pharmacophore model was composed of a combination of an HBA (Acc) feature located on the carbonyl of the native ligand separated from an HBD (Don1) and two hydrophobic centers (Hyd1 and Hyd2), respectively, by 4.97 Å, 4.14 Å, and 3.64 Å (Figure 1). The second HBD feature (Don2) was located between the two hydrophobic centers, with respective distances of 2.90 Å and 3.80 Å from Hyd1 and Hyd2 (Figure 1). Scoring of this pharmacophore model using the pharmacophore fit score implemented in LigandScout58 resulted in the identification of nine out of the 45 generated active conformers in the hit list composed of only 12 hits (hit rate =0.52; Table 2). Even though the hit rate is weak, the Ya, % yield, Se, Sp, EF, and GH scores are, respectively, 75%, 20%, 0.20, 0.99, 3,825, and 0.75 (Table 2).
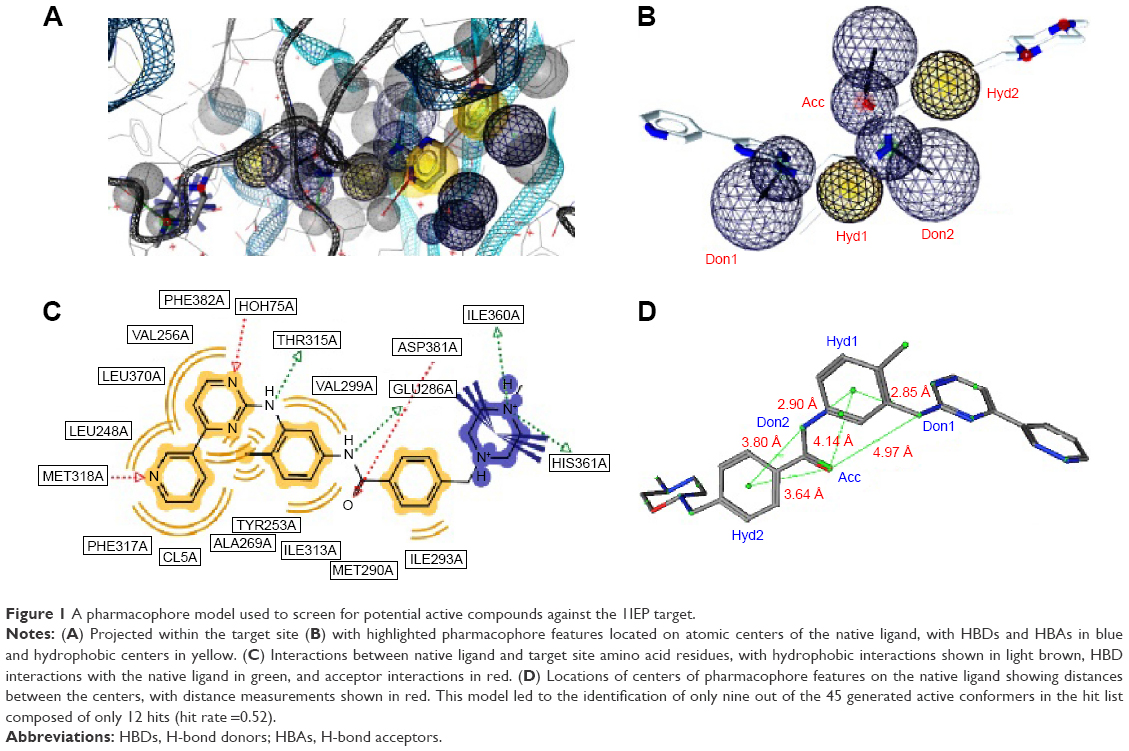 | Figure 1 A pharmacophore model used to screen for potential active compounds against the 1IEP target. |
Two separate high-performance pharmacophore models were generated for the 3PE1 target (I and II; Figure 2) with the common features comprising the HBD (Don), the acceptor (Acc2), and the hydrophobic center (Hyd2; Figure 2A and B). Even though the pharmacophore model 3PE1-I was composed of many more features (as shown in Figure 2A, C and D) than the 3PE1-II (Figure 2B and E), the first model gave a much higher yield, selectivity, and GH score. Meanwhile, the second model performed better in terms of Ya values because it scored up to 41 out of the 47 compounds in the hit list, even though a total of up to 274 compounds were present in the original list of actives. The performance of this human protein kinase pharmacophore model was also tested for the Protein Data Bank code 3PE2 (with only three features, one corresponding to the common acceptor in models 3PE1-I and 3PE1-II; Figure 3). The specificity of this pharmacophore model was comparable with that of the earlier models (3PE1-I and 3PE1-II), while the GH score was midway between that of the 3PE1 models. The performances of these pharmacophores reveal that the 3PE1-I model could be suitable for initially screening a huge dataset, while the more specific model (3PE1-II) could be more suitable in cases of small datasets, which might be the results from a hit list derived from a primary screen of a large dataset using the 3PE1-I model query. The third model (3PE2) is rather less selective, “picking up” too many FPs, thus resulting in a very low Se value (0.04) and rendering this model the least desirable of the three pharmacophores that could be used in screening for human protein kinase inhibitors in this study.
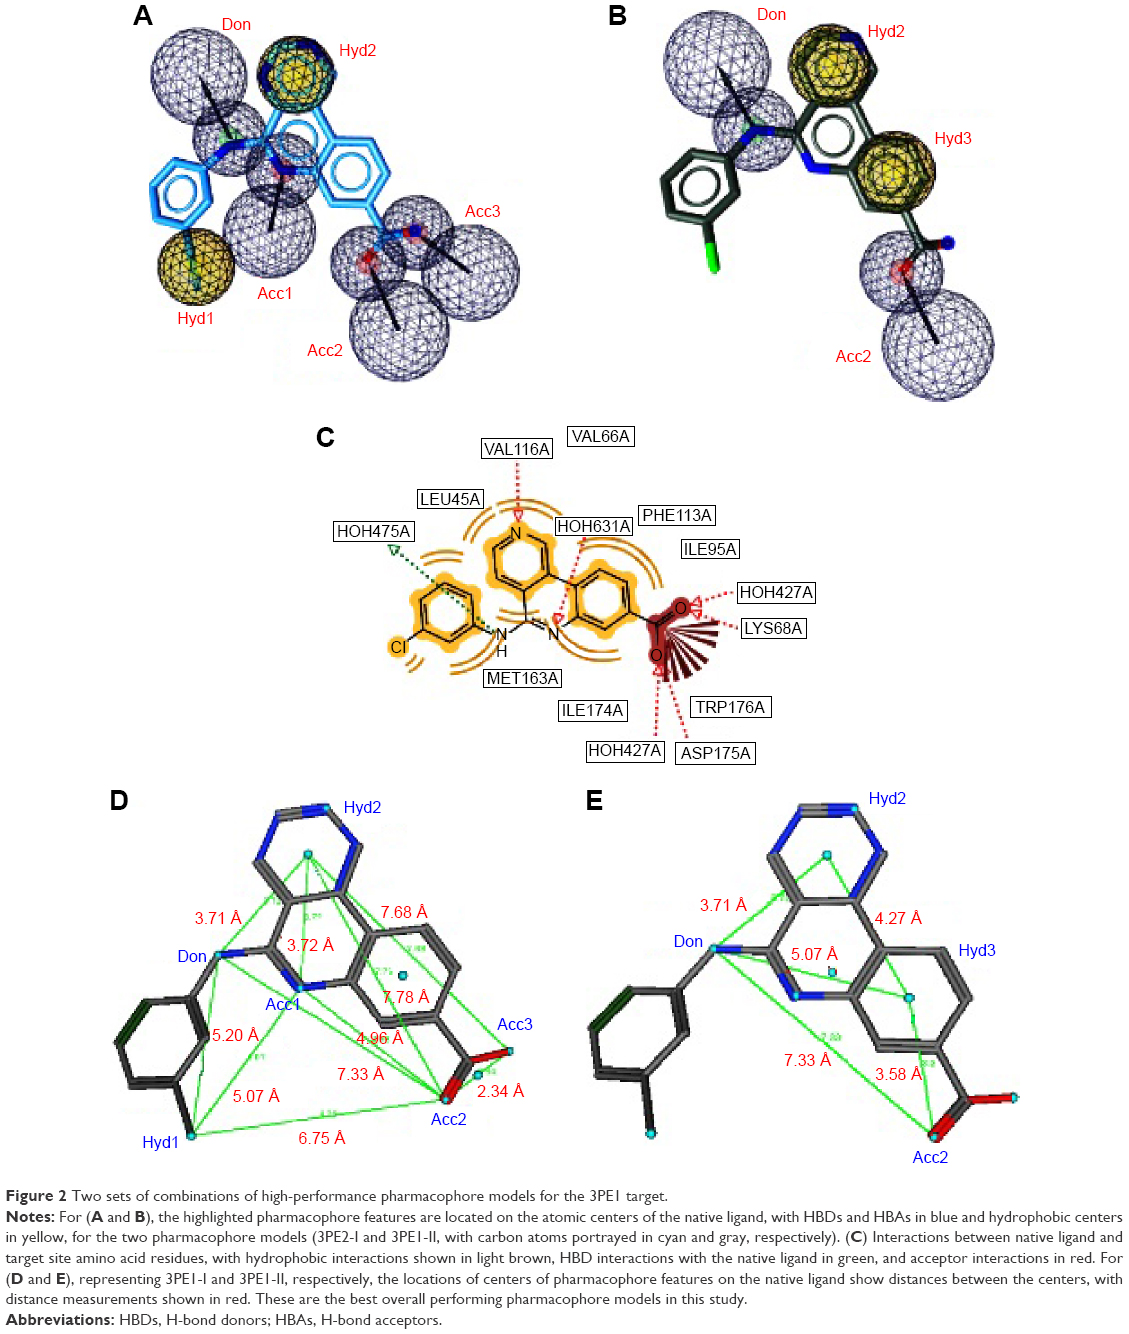 | Figure 2 Two sets of combinations of high-performance pharmacophore models for the 3PE1 target. |
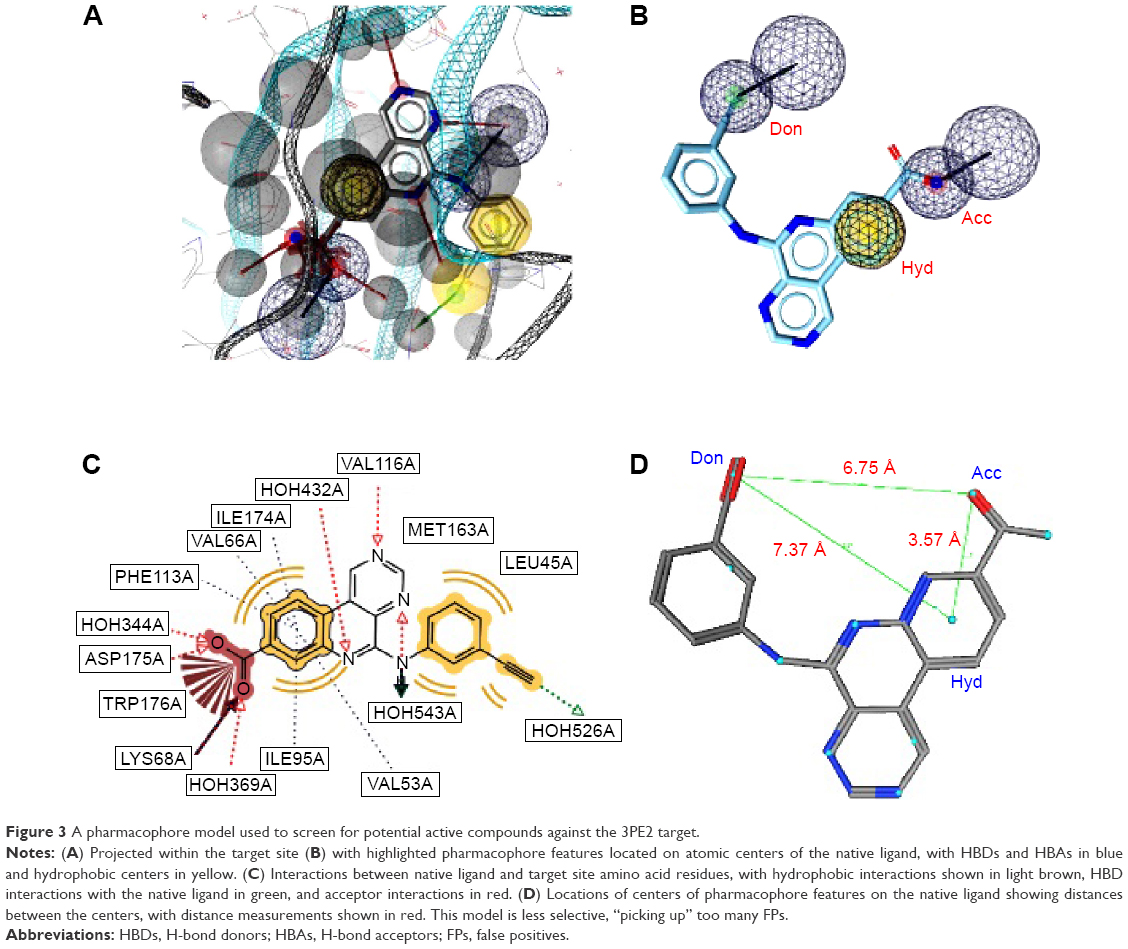 | Figure 3 A pharmacophore model used to screen for potential active compounds against the 3PE2 target. |
The validated model for the 4ACM target has been shown in Figure 4, while the remaining models are given in Figures S1–S5. The 4ACM model is composed of two HBAs centered, respectively, on the sulfonyl and pyrazine ring; one HBD on the amino substituent of the pyrazine ring; and a hydrophobic center on the benzene ring. The interactions between the native ligand used to generate this model and the target binding site residues are shown in Figure 4, while the distances between feature centers are shown in Figure 4D. This model was able to capture up to 23 out of the 42 compounds (% yield of actives =55%) in the original database of actives, with a hit rate of 3.51% from the total database of actives and decoys. Meanwhile, the Se, Sp, and GH values for this model were all ≥0.55. It was generally observed that the best models were 1IEP, 2XMY, 3E37-I, 3PE1-I, 4ACM, and 4BBG-III, while the other models still needed refinement. The 2XMY model (Figure S2), for example, was able to capture seven out of the 14 active compounds in the original database of actives (50% yield of actives), with the strength of the model being the fact that the Se, Sp, and GH scores were all ≥0.50. Meanwhile, the 3E37-I model (Figure S3-I) was able to capture six out of the ten active compounds in the original dataset of actives as the top scoring hits. Our study also involved pharmacophore models for the protein kinase B (PKB) β, Protein Data Bank code 2JDO, which has been recently explored by Vyas et al47 in a virtual screening study, giving a much weaker model than reported in the previous study.
 | Figure 4 A pharmacophore model used to screen for potential active compounds against the 4ACM target. |
The ROC curves used to evaluate the performances of the generated pharmacophore models are shown in Figures 5 and 6 for three of the “best” models. Figure 5 shows the enrichment curve for the 3PE1-I model. The TP rate has also been plotted against the FP rate and used to compare the two of the 4BBG models (I and III) for the purpose of comparison (Figure 6). Both 4BBG models show better enrichment than the 3PE1-I model, with the 4BBG-III model (Figure 6B) having a higher AUC value than the 4BBG-I model (Figure 6A).
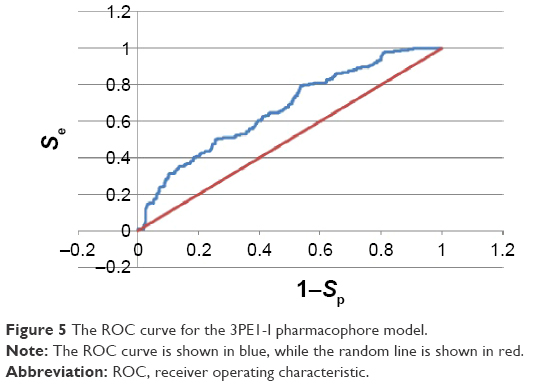 | Figure 5 The ROC curve for the 3PE1-I pharmacophore model. |
 | Figure 6 ROC curves for the 4BBG pharmacophore models. |
Pharmacophore-based virtual screening of AfroCancer and NPACT datasets
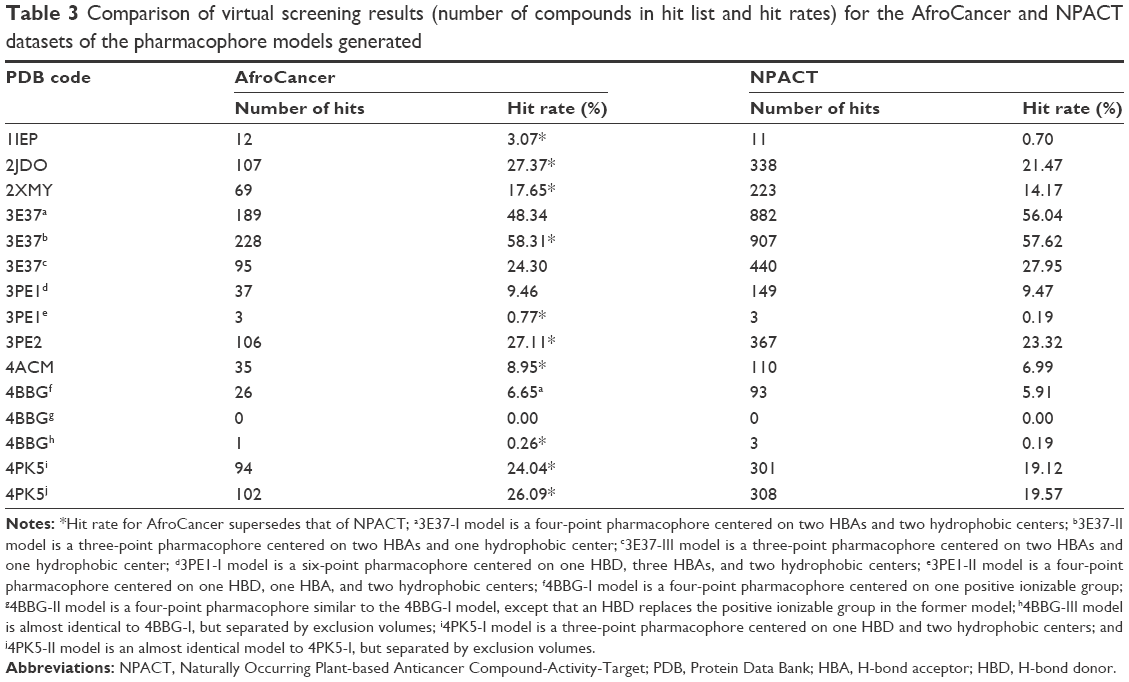
The best derived pharmacophore hypotheses were employed as 3D search queries against the AfroCancer and NPACT databases. Compounds that had their chemical groups spatially overlapping (mapping) with the corresponding features, ie, molecules that satisfied all the features of the pharmacophore model used as the 3D query of the particular pharmacophoric model, were captured as hits and ranked following their pharmacophore fitness score, as implemented in LigandScout.60 A summary of the virtual screening results (number of hits and hit rates) for the AfroCancer and NPACT datasets, using the established and validated pharmacophore models, is given in Table 3. It was generally observed that, apart from the null case (model 4BBG-II), the hit rates for the virtual screening of the much smaller AfroCancer dataset were higher than those for the NPACT. Moreover, a plot of the ranks of the retrieved hits by pharmacophore fit scores against the number of compounds screened in the respective databases showed a better performance for the AfroCancer, eg, for the 4ACM pharmacophore model; this curve is shown in Figure 7.
 | Table 3 Comparison of virtual screening results (number of compounds in hit list and hit rates) for the AfroCancer and NPACT datasets of the pharmacophore models generated |
 | Figure 7 Enrichment curves obtained by screening the database compounds consisting of the AfroCancer database (blue) and NPACT database (green), using the 4ACM pharmacophore query features. |
Assessment of the toxicological profiles of the AfroCancer and NPACT datasets
Assessment of the toxicological profiles of the AfroCancer and NPACT datasets was run on the Derek Nexus platform.69 Derek Nexus is an expert, knowledge-based software that gives informative toxicity predictions quickly. The ability to predict potential toxicity of either the parent compound or its metabolites is important in the novel drug design programs.99,100 Computer-based assessment of potential toxicity has become increasingly popular in the past decade.99–102 Thus, early and accurate in silico toxicity prediction using Derek Nexus is an acceptable way of identifying potentially toxic chemicals, by helping experts to reject unsuitable drug candidates.99 The Derek system is able to perceive chemical substructures within molecules and relate these to a rule base, linking the substructures with likely types of toxicity.99–102 It is intended to aid the selection of compounds based on toxicological considerations or separately to indicate specific toxicological properties to be assayed early in the evaluation of a compound, thus saving time, cutting down costs, and saving the lives of some laboratory animals.103,104 This works through the identification of toxicity alerts within the chemical structures of a possible drug candidate. Alerts are collections of structural features observed to result in toxicological activity. Lhasa’s Nexus platform helps automate alert identification by mining descriptions of activating structural features or substructures directly from toxicity datasets, which have been included within the program’s knowledge base.105 Each rule contained in the rule base describes the relationship between a structural feature or toxicophore and its associated toxic effect. Derek possesses the particular ability to report the reasoning behind its predictions.102 The rules are derived by an evaluation of toxicological, mechanistic, and physicochemical data.103 This is achieved by an argumentation-based approach using general toxicological and physicochemical concepts, eg, log P.102,103 In this study, an attempt has been made to identify structural patterns within the AfroCancer and NPACT datasets, which may be related to toxicity of some of the compounds.
Of the 390 compounds within the AfroCancer dataset, 1,330 tautomers were generated. A corresponding 5,357 tautomers were also generated for the NPACT dataset. Predictions were carried out for all the tautomers. In some cases, the output “NOTHING TO REPORT” was recorded. This means that these compounds do not contain any toxicophores that are described in Derek’s current knowledge base. The proportion of tautomers with the NOTHING TO REPORT output was 5.93% for AfroCancer and 4.39% for NPACT. This could also imply that the models in DEREK may not be in the applicability domain of the compounds with the NOTHING TO REPORT output. The remaining compounds showed a number of toxicophores identified with a wide range of toxicity end points. The Derek Nexus prediction includes an overall conclusion about the likelihood of toxicity in a structure and detailed reasoning information for the likelihood (or confidence level). The confidence levels are classified as CERTAIN, PROBABLE, PLAUSIBLE, EQUIVOCAL, and DOUBTED, based on experimental evidence and computed physicochemical parameters. It is important to mention that an outcome “CERTAIN” indicates that the query compounds themselves (or very closely related analogs) have been tested and found to be active. A definition of these confidence levels is provided in Table S1. As an example, chromosome damage in vitro was predicted to be CERTAIN for two compounds from the AfroCancer dataset (Figure 8). The log P-value of both compounds, imperatorin and bergapten (isolated from the stem of Balsamocitrus paniculata and the related Cameroonian rutaceae species),106,107 was computed to be 4.01, while the computed log Kp was −1.52. The coumarin imperatorin is an antimutagene,108 also known to exert antihypertrophic effect both in vitro and in vivo,109 as well as antimicrobial activities.107 Both imperatorin and bergapten are also known to be components of the apiaceous Bishop’s weed (Ammi majus), growing wild in Egypt and the Mediterranean (a plant used for the treatment of leucoderma and skin diseases).110 The two coumarins activated the Derek alert for psoralen, which causes human chromosome damage in the in vitro chromosome aberration test.111 Experimental evidence suggests that activity in the in vitro chromosome aberration test may be a result of their DNA intercalating properties. The noncovalent binding of psoralen and several derivatives between two base pairs of DNA has been demonstrated.112 This mechanism is also supported by the weak mutagenic activity observed for several psoralen derivatives in the Ames test in Salmonella typhimurium strain TA1537,113 a strain that appears sensitive to other DNA intercalators.114,115
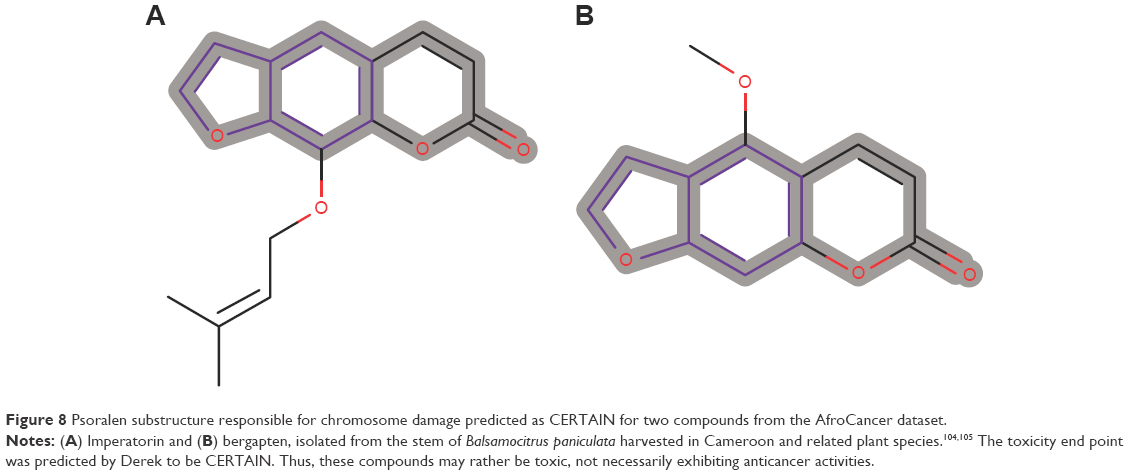 | Figure 8 Psoralen substructure responsible for chromosome damage predicted as CERTAIN for two compounds from the AfroCancer dataset. |
For the NPACT dataset, hepatotoxicity was predicted to be CERTAIN for one tautomer, ocular toxicity for two tautomers, and skin sensitization for six tautomers. The toxicophores responsible for these outcomes will be discussed separately. A total of 22 and 32 end points gave predictions, ranging from CERTAIN to DOUBTED for the AfroCancer and NPACT datasets, respectively (Table 4). “DOUBTED” means Derek predicts this compound to be INACTIVE but is not very confident about the conclusion, maybe because of absence of further experimental evidence. A bar chart showing the distribution of the percentage of compounds per likelihood for each end point has been represented in Figure 9 for both AfroCancer and NPACT datasets for chromosome damage in vitro, along with the totals. It was observed that the proportions of tautomers predicted with extreme likelihoods for the various toxicity end points (CERTAIN, PROBABLE, and DOUBTED) were relatively small when compared with the likelihoods PLAUSIBLE and EQUIVOCAL; eg, the bar charts in Figure 9A show that 8.5% and 9.4% of the generated tautomers were predicted as PLAUSIBLE for chromosome damage in vitro (an end point whose data are well distributed among the various aforementioned likelihoods) for the AfroCancer and NPACT datasets, respectively, when compared with equivalent percentages of 0.45% and 0.29% for the likelihoods CERTAIN, PROBABLE, and DOUBTED put together. Regarding the totals (Figure 9B), 93.6% of the generated tautomers were predicted as either PLAUSIBLE or EQUIVOCAL for all likelihoods of the AfroCancer dataset, with an equivalent 80.5% for the NPACT dataset. The Derek program uses the terms “CERTAIN”, “PROBABLE”, and “PLAUSIBLE” to express confidence in predictions based on criteria such that a record in the database reports the query itself to have been tested on the query species and found to be active, a record in the database reports the query itself to have been tested on a species related to the query species (but not on the species itself) and found to be active, and there are no relevant test results in the database but the query triggers at least one alert for activity and it is within the applicability domain for the model. The terms DOUBTED and IMPROBABLE are not weak predictions of activity – they mean that there are clear reasons to predict inactivity. Predictions of PLAUSIBLE or EQUIVOCAL may also imply that either experimental evidence is not strong enough to demonstrate that such toxicity is CERTAIN or that there are both arguments for and against such likelihood. Among the end points computed, the proportion of tautomers with predictions for skin sensitization was most pronounced, corresponding to 47.2% of all predictions for the AfroCancer dataset and 36.9% for the NPACT dataset. Our previous study had shown that the predicted maximum transdermal transport rates, Jm (in μcm−2·h−1), computed from the aqueous solubility (Swat) and skin permeability (Kp) and MW using the relation 8:
Jm = Kp × MW × Swat | (8) |
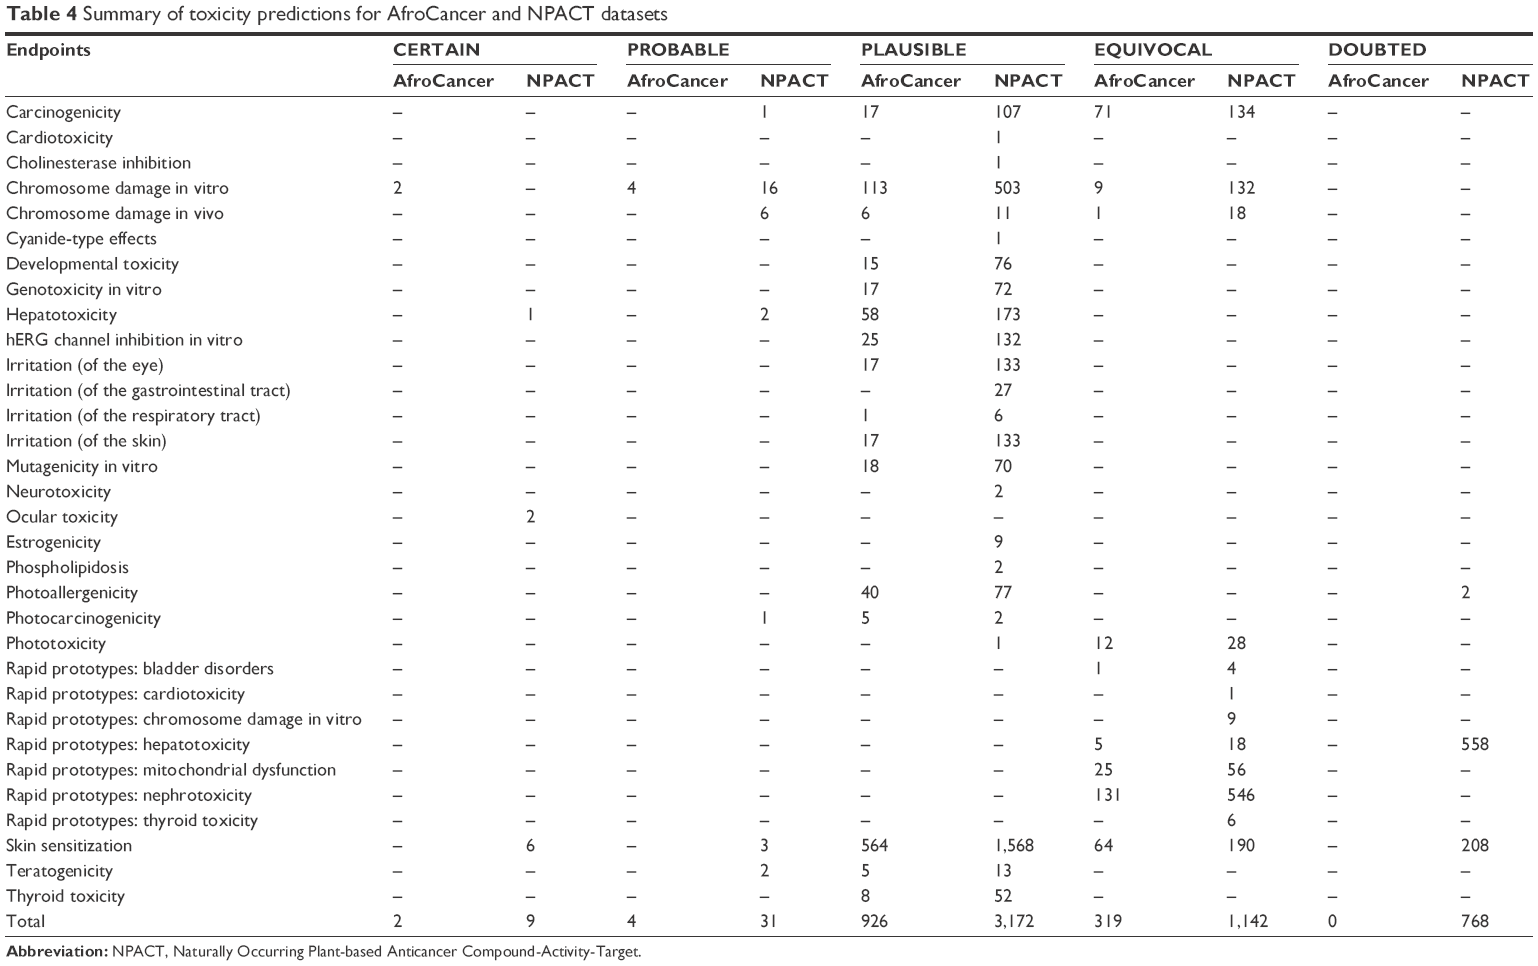 | Table 4 Summary of toxicity predictions for AfroCancer and NPACT datasets |
 | Figure 9 Bar charts showing the distribution of toxicity predictions per likelihood. |
indicated variations from 0 μcm−2·h−1 to 365 μcm−2·h−1, with only ~1.6% of the compounds in AfroCancer having the predicted value of Jm >100 μcm−2·h−1.32 However, 91.8% of the compounds were predicted to fall within the recommended range of the Kp parameter for >95% of known drugs. Skin sensitization studies may be relevant for molecules involved in drug discovery programs for skin cancers. Some of the end points may, however, be irrelevant for a study of anticancer agents. For example, potential eye irritation would not be of interest for an anticancer agent intended to be taken orally. A number of toxicophores responsible for the skin sensitization predictions will be discussed separately. Whether the compounds within both datasets of naturally occurring potential anticancer agents would be suitable starting points for lead discovery against skin cancers would be subject to further (experimental) investigations. hERG channel inhibition in vitro was predicted as PLAUSIBLE for <2% of compounds from the AfroCancer, with a corresponding only 2.46% of the compounds from the NPACT. This parameter had given a compliance of 58.5% and 62.6% for the recommended range of >95% of known drugs in our previous study.32
Diversity of the AfroCancer and NPACT datasets
In order to reduce redundancy and enhance the coverage of biological activity and chemical space, a dataset for virtual screening must have the requirement of diversity. PCA was used as a means of comparing the extent of diversity of the two datasets. This consists of reducing the dimensionality of the calculated descriptors by linearly transforming the data, by calculating a new and smaller set of descriptors, which are uncorrelated and normalized. The PCA scatter plot of the previously calculated physicochemical properties of the AfroCancer (red) and NPACT dataset (blue), shown in Figure 10, is a visual representation of the molecules in the respective datasets, as described by the three best selected principal components (PCA1, PCA2, and PCA3). Each point shown corresponds to a molecule, with the spread of the points representing the diversity of the respective datasets. In this study, a comparison was carried out for the diversity of the two datasets, with the intention of examining the chemical spaces of the two datasets. From the 3D scatter plot of the three best principal components, obtained from the uncorrelated normalized descriptors (Figure 10), the regions close to the center of the cube contain some regions of intersection of chemical spaces of the two datasets. The larger number of outliers in the case of the NPACT dataset (away for the center and toward the left side of the cube) indicates a wider sampling of the chemical space, when compared with the AfroCancer collection. However, it stands out clear that the right side of the cube is dominated by components from the AfroCancer dataset, while the left side is dominated by components from the NPACT dataset. Overall, the NPACT occupies a wider region of chemical space than the AfroCancer. The first three PCAs could explain 89% (AfroCancer) and 87% (NPACT) of variance of the individual datasets. The MCSS panel for compound selection in the two datasets (Figure 11) is based on the substructures that can be synthetically combined and are common in “drug-like” molecules, allowing a direct selection and identification of compounds containing such substructures. The panel highlights the large diversity of the rings present in the NPs of both datasets, but a broad diversity is clearly seen in the MCSSs, apart from ethers, olefins, and carbonyl-bonded aromatic esters, featuring among the most common fragments obtained in the two datasets.
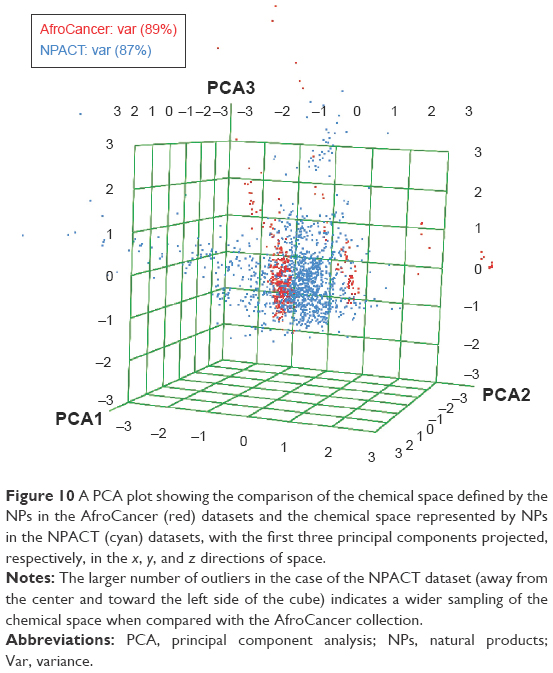 | Figure 10 A PCA plot showing the comparison of the chemical space defined by the NPs in the AfroCancer (red) datasets and the chemical space represented by NPs in the NPACT (cyan) datasets, with the first three principal components projected, respectively, in the x, y, and z directions of space. |
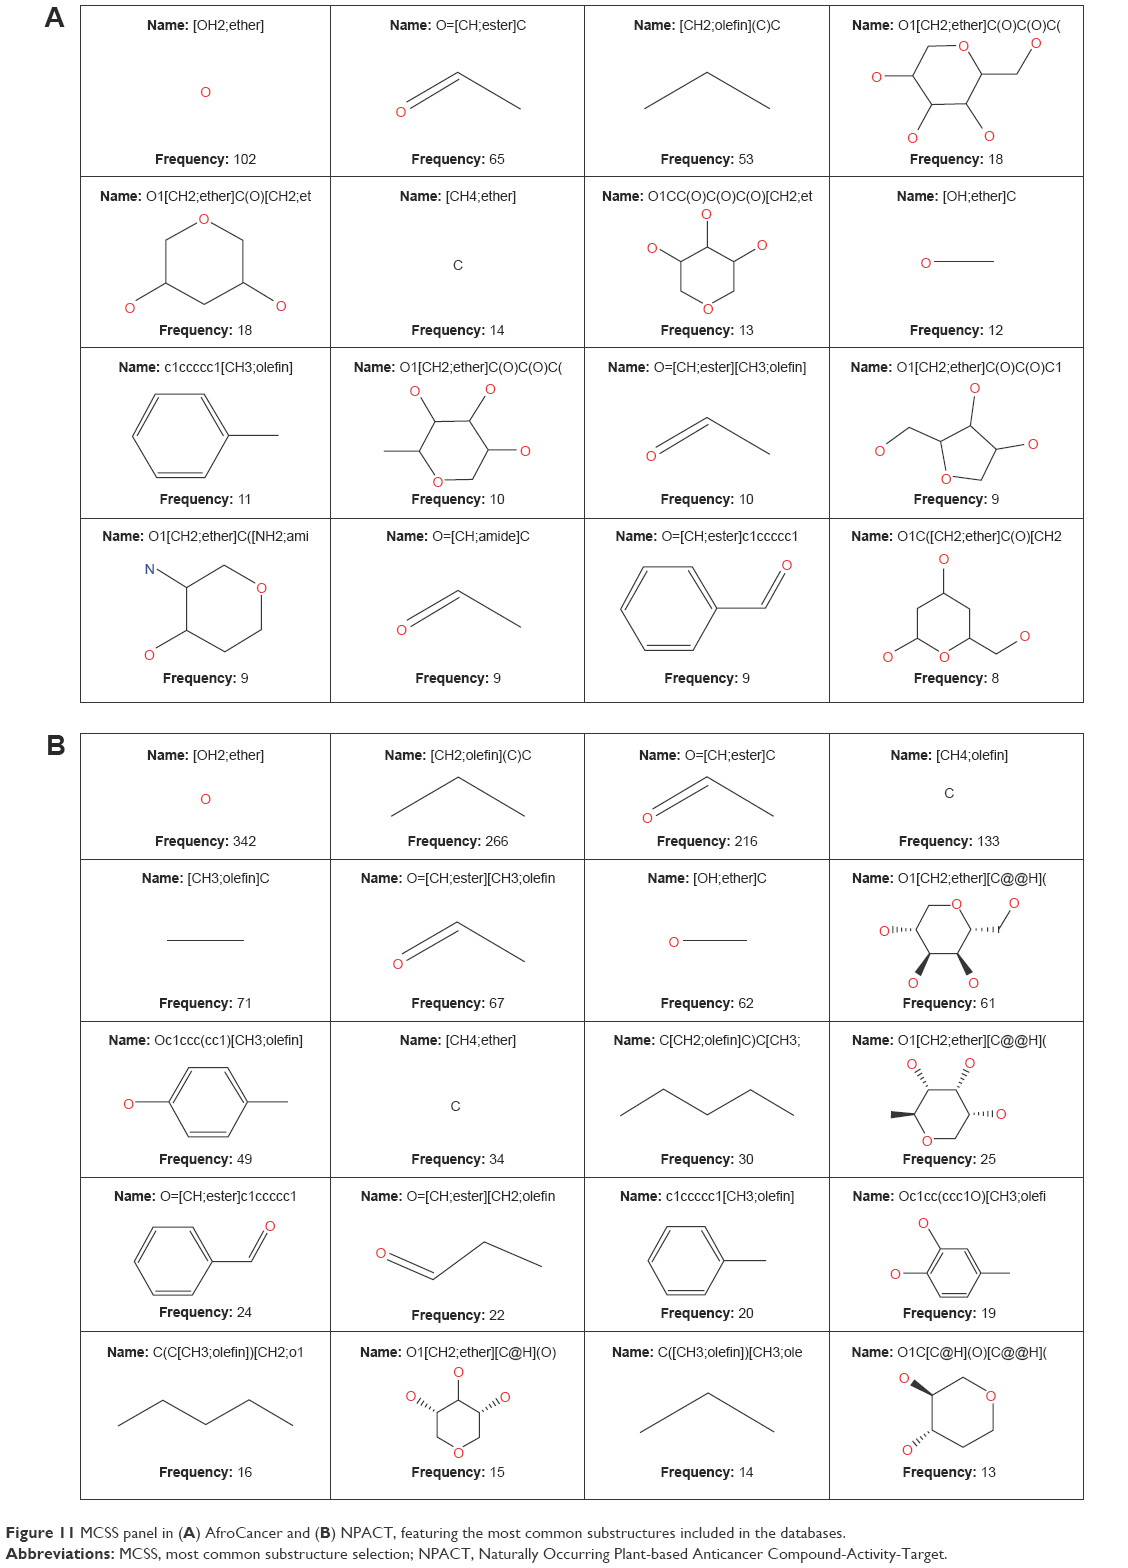 | Figure 11 MCSS panel in (A) AfroCancer and (B) NPACT, featuring the most common substructures included in the databases. |
Conclusion
Based on this study, three main objectives have been attained: pharmacophore models for virtual screening aimed at the identification of naturally occurring anticancer agents have been generated and validated, the toxicity of the components of two datasets containing naturally occurring potential anticancer agents has been assessed in computer-based methods, and a diversity analysis of the two datasets has been carried out. This sets the stage for further identification and development of high affinity compounds with potential activities against eight known anticancer drug targets, including tyrosine kinase, PKB β, cyclin-dependent kinase, protein farnesyltransferase, human protein kinase, glycogen synthase kinase, and indoleamine 2,3-dioxygenase 1. The advantage of this work is that both datasets evaluated are relatively small and easy to screen virtually, even using a laptop personal computer. After virtual screening runs using the established pharmacophore-based models, a significant numbers of virtual “hits” have been identified from the datasets of both compounds. These could be further assayed using classical “wet lab” experiments. Moreover, predictions from Derek show that only a few of the compounds in both datasets could be potentially toxic to an extent that might make them unsuitable for investigation as potential cancer therapy. Diversity analysis using the three most important principal components of the computed physicochemical properties of the compounds in the two datasets shows that the databases do not occupy the same chemical space. The two datasets therefore represent reasonable starting virtual libraries for the identification of naturally occurring plant-based anticancer lead compounds for drug discovery.
Acknowledgments
Financial assistance is acknowledged from Lhasa Limited, Leeds, UK. Computational resources were made available through the Molecular Simulations Laboratory, Department of Chemistry, University of Buea, Cameroon. InteLigand Inc. is acknowledged for the academic license to use LigandScout. FN-K currently holds a Georg Forster fellowship from the Alexander von Humboldt Foundation, Germany, while CVS is currently a PhD student funded by the German Academic Exchange Services (DAAD).
Disclosure
The authors report no conflicts of interest in this work.
References
Gibbs JB. Mechanism-based target identification and drug discovery in cancer research. Science. 2000;287(5460):1969–1973. | ||
WHO Media Centre [webpage on the Internet]. Fast sheet No 297; 2013. Available from: http://www.who.int/mediacentre/factsheets/fs297/en/index.html. Accessed February 4, 2014. | ||
[webpage on the Internet]. Globocan Fast Stats; 2008. Available from: http://www.iarc.fr/en/media-centre/iarcnews/2010/globocan2008.php. Accessed August 4, 2013. | ||
Newman DJ, Cragg GM, Snader KM. The influence of natural products upon drug discovery. Nat Prod Rep. 2000;17(3):215–234. | ||
Hostettmann K, Terreaux C. Search for new lead compounds from higher plants. Chimia. 2000;54(11):652–657. | ||
Saklani A, Kutty SK. Plant-derived compounds in clinical trials. Drug Discov Today. 2008;13(3):161–171. | ||
Salim AA, Chin YW, Kinghorn AD. Drug discovery from plants. In: Ramawat KG, Merillon JM, editors. Bioactive Molecules and Medicinal Plants. Heidelberg: Springer; 2008:1–24. | ||
Kinghorn AD, Pan L, Fletcher JN, Chai H. The relevance of higher plants in lead compound discovery programs. J Nat Prod. 2011;74(6):1539–1555. | ||
Grothaus PG, Cragg GM, Newman DJ. Plant natural products in anticancer drug discovery. Curr Org Chem. 2010;14(16):1781–1791. | ||
Ashutosh K. Medicinal Chemistry. New Delhi, India: New Age International Ltd.; 2007:794. | ||
Desai AG, Qazi GN, Ganju RK, et al. Medicinal plants and cancer chemoprevention. Curr Drug Metab. 2008;9(7):581–591. | ||
Heinrich M, Bremner P. Ethnobotany and ethnopharmacy – their role for anti-cancer drug development. Curr Drug Targets. 2006;7(3):239–245. | ||
Cragg GM, Newman DJ. Nature: a vital source of leads for anticancer drug development. Phytochem Rev. 2009;8(2):313–331. | ||
Hollósy F, Kéri G. Plant-derived protein tyrosine kinase inhibitors as anticancer agents. Curr Med Chem Anticancer Agents. 2004;4(2):173–197. | ||
Clardy J, Walsh C. Lessons from natural molecules. Nature. 2004;432(7019):829–837. | ||
Reddy L, Odhav B, Bhoola KD. Natural products for cancer prevention: a global perspective. Pharmacol Ther. 2003;99(1):1–13. | ||
Lucas DM, Still PC, Pérez LB, Grever MR, Kinghorn AD. Potential of plant-derived natural products in the treatment of leukemia and lymphoma. Curr Drug Targets. 2010;11(7):812–822. | ||
Wang HK, Lee KH. Plant-derived anticancer agents and their analogs currently in clinical use or in clinical trials. Bot Bull Acad Sinica. 1997;38:225–235. | ||
Pan L, Chai H, Kinghorn AD. The continuing search for antitumor agents from higher plants. Phytochem Lett. 2010;3(1):1–8. | ||
Cragg GM, Newman DJ. Plants as a source of anti-cancer agents. J Ethnopharmacol. 2005;100(1):72–79. | ||
Balunas MJ, Kinghorn AD. Drug discovery from medicinal plants. Life Sci. 2005;78(5):431–441. | ||
Srivastava V, Negi AS, Kumar JK, Gupta MM, Khanuja SP. Plant-based anticancer molecules: a chemical and biological profile of some important leads. Bioorg Med Chem. 2005;13(21):5892–5908. | ||
Cragg GM, Grothaus PG, Newman DJ. Impact of natural products on developing new anti-cancer agents. Chem Rev. 2009;109(7):3012–3043. | ||
Gurib-Fakim A. Medicinal plants: traditions of yesterday and drugs of tomorrow. Mol Aspects Med. 2006;27(1):1–93. | ||
Nobili S, Lippi D, Witort E, et al. Natural compounds for cancer treatment and prevention. Pharmacol Res. 2009;59(6):365–378. | ||
Lee KH. Anticancer drug design based on plant-derived natural products. J Biomed Sci. 1999;6(4):236–250. | ||
Gordaliza M. Natural products as leads to anticancer drugs. Clin Transl Oncol. 2007;9(12):767–776. | ||
Connors T. Anticancer drug development: the way forward. Oncologist. 1996;1(3):180–181. | ||
Fadeyi SA, Fadeyi OO, Adejumo AA, Okoro C, Myles EL. In vitro anticancer screening of 24 locally used Nigerian medicinal plants. BMC Complement Altern Med. 2013;13(1):79. | ||
Ntie-Kang F, Zofou D, Babiaka SB, et al. AfroDb: a select highly potent and diverse natural product library from African medicinal plants. PLoS One. 2013;8(10):e78085. | ||
Sawadogo WR, Schumacher M, Teiten MH, Dicato M, Diederich M. Traditional West African pharmacopeia, plants and derived compounds for cancer therapy. Biochem Pharmacol. 2012;84(10):1225–1240. | ||
Ntie-Kang F, Nwodo JN, Ibezim A, et al. Molecular modeling of potential anticancer agents from African medicinal plants. J Chem Inf Model. 2014;54(9):2433–2450. | ||
Ntie-Kang F, Lifongo LL, Judson PN, Sippl W, Efange SMN. How “drug-like” are naturally occurring anti-cancer compounds? J Mol Model. 2014;20(1):1–13. | ||
Mangal M, Sagar P, Singh H, Raghava GP, Agarwal SM. NPACT: naturally occurring plant-based anti-cancer compound-activity-target database. Nucleic Acids Res. 2013;41(D1):D1124–D1129. | ||
Cragg GM, Newman DJ. Plants as a source of anti-cancer and anti-HIV agents. Ann Appl Biol. 2003;143(2):127–133. | ||
Newman DJ, Cragg GM. Natural products as sources of new drugs over the 30 years from 1981 to 2010. J Nat Prod. 2012;75(3):311–335. | ||
Newman DJ, Cragg GM. Natural products as sources of new drugs over the last 25 years. J Nat Prod. 2007;70(3):461–477. | ||
Hostettmann K, Marston A, Ndjoko K, Wolfender JL. The potential of African plants as a source of drugs. Curr Org Chem. 2000;4(10):973–1010. | ||
Sandberg F, Perera-Ivarsson P, El-Seedi HR. A Swedish collection of medicinal plants from Cameroon. J Ethnopharmacol. 2005;102(3):336–343. | ||
El-Seedi HR, Burman R, Mansour A, et al. The traditional medical uses and cytotoxic activities of sixty-one Egyptian plants: discovery of an active cardiac glycoside from Urginea maritima. J Ethnopharmacol. 2013;145(3):746–757. | ||
Efange SMN. Natural products: a continuing source of inspiration for the medicinal chemist. In: Iwu MM, Wootton JC, editors. Ethnomedicine and Drug Discovery; Advances in Phytomedicine. Vol. 1. Amsterdam, Netherlands: Elsevier Science; 2002:61–69. | ||
DiMasi JA, Hansen RW, Grabowski HG. The price of innovation: new estimates of drug development costs. J Health Econ. 2003;22(2):151–185. | ||
Klebe G. Virtual ligand screening strategies; perspective and limitations. Drug Discov Today. 2006;11(13):580–594. | ||
Kubinyi H. Structure-based design of enzyme inhibitors and receptor ligands. Curr Opin Drug Discov Devel. 1998;1(1):4–15. | ||
Chen H, Yao K, Nadas J, et al. Prediction of molecular targets of cancer preventing flavonoid compounds using computational methods. PLoS One. 2012;7(5):e38261. | ||
Paul J, Gnanam R, Jayadeepa RM, Arul L. Anti cancer activity on Graviola, an exciting medicinal plant extract vs various cancer cell lines and a detailed computational study on its potent anti-cancerous leads. Curr Top Med Chem. 2013;13(14):1666–1673. | ||
Vyas VK, Ghate M, Goel A. Pharmacophore modeling, virtual screening, docking and in silico ADMET analysis of protein Kinase B (PKB β) inhibitors. J Mol Graph Model. 2013;42:17–25. | ||
Fan Y, Shi LM, Kohn KW, Pommier Y, Weinstein JN. Quantitative structure-antitumor activity relationships of camptothecin analogues: cluster analysis and genetic algorithm-based studies. J Med Chem. 2001;44(20):3254–3263. | ||
Zhou H, Wu S, Zhai S, et al. Design, synthesis, cytoselective toxicity, structure-activity relationships, and pharmacophore of thiazolidinone derivatives targeting drug-resistant lung cancer cells. J Med Chem. 2008;51(5):1242–1251. | ||
Chiang YK, Kuo CC, Wu YS, et al. Generation of ligand-based pharmacophore model and virtual screening for identification of novel tubulin inhibitors with potent anticancer activity. J Med Chem. 2009;52(14):4221–4233. | ||
Kim DY, Kim KH, Kim ND, et al. Design and biological evaluation of novel tubulin inhibitors as antimitotic agents using a pharmacophore binding model with tubulin. J Med Chem. 2006;49(19):5664–5670. | ||
Ojima I, Chakravarty S, Inoue T, et al. A common pharmacophore for cytotoxic natural products that stabilize microtubules. Proc Natl Acad Sci U S A. 1999;96(8):4256–4261. | ||
Pérez-Sacau E, Díaz-Penãte RG, Estévez-Braun A, et al. Synthesis and pharmacophore modeling of naphthoquinone derivatives with cytotoxic activity in human promyelocytic leukemia HL-60 cell line. J Med Chem. 2007;50(4):696–706. | ||
Ntie-Kang F, Mbah JA, Mbaze LM, et al. CamMedNP: building the Cameroonian 3D structural natural products database for virtual screening. BMC Complement Altern Med. 2013;13:88. | ||
Ntie-Kang F, Onguéné PA, Scharfe M, et al. ConMedNP: a natural product library from medicinal plants in Central Africa. RSC Adv. 2014;4:409–419. | ||
Ntie-Kang F, Amoa Onguéné P, Fotso GW, et al. Virtualizing the p-ANAPL library: a step towards drug discovery from African medicinal plants. PLoS One. 2014;9(3):e90655. | ||
Ntie-Kang F, Lifongo LL, Mbah JA, et al. In silico drug metabolism and pharmacokinetic profiles of natural products from medicinal plants in the Congo Basin. In Silico Pharmacol. 2013;1:12. | ||
Ntie-Kang F, Mbah JA, Lifongo LL, et al. Assessing the pharmacokinetic profile of the CamMedNP natural products database: an in silico approach. Org Med Chem Lett. 2013;3(1):10. | ||
Onguéné PA, Ntie-Kang F, Mbah JA, et al. The potential of anti-malarial compounds derived from African medicinal plants, part III: an in silico evaluation of drug metabolism and pharmacokinetics profiling. Org Med Chem Lett. 2014;4(1):6. | ||
Wolber G, Langer T. LigandScout: 3D-pharmacophores derived from protein-bound ligands and their use as virtual screening filters. J Chem Inf Model. 2005;45(1):160–169. | ||
Berman HM, Westbrook J, Feng Z, et al. The protein data bank. Nucleic Acids Res. 2000;28(1):235–242. | ||
Chemical Computing Group Inc. Molecular Operating Environment, Version 2010. Montreal: Chemical Computing Group Inc; 2010. | ||
Halgren TA. Merck molecular forcefield. J Comput Chem. 1996;17:490–441. | ||
Schrödinger LLC. LigPrep Software, Version 2.5. New York: Schrödinger LLC; 2011. | ||
Mysinger MM, Carchia M, Irwin JJ, Shoichet BK. Directory of useful decoys, enhanced (DUD-E): better ligands and decoys for better benchmarking. J Med Chem. 2012;55(14):6582–6594. | ||
Güner OF, Henry DR. Pharmacophore perception, development, and use in drug design. In: Güner OF, editor. Metric for Analyzing Hit Lists and Pharmacophores; IUL Biotechnology Series. La Jolla, CA: International University Line; 2000:191–212. | ||
Güner OF, Waldman M, Hoffmann RD, Kim JH. Pharmacophore perception, development, and use in drug design. In: Güner OF, editor. Strategies for Database Mining and Pharmacophore Development; IUL Biotechnology Series, 1st Edition. La Jolla, CA: International University Line; 2000:213–236. | ||
Langer T, Hoffmann RD. Pharmacophores and Pharmacophore Searches. Weinheim, Germany: WILEY-VCH; 2006:338–340. | ||
Lhasa Limited [webpage on the Internet]. Derek Nexus. Available from: http://www.lhasalimited.org/products/derek-nexus.htm. Accessed May 19, 2015. | ||
Wold S, Esbensen K, Geladi P. Principal component analysis. Chemometr Intell Lab Syst. 1987;2:37–52. | ||
Lewell XQ, Judd DB, Watson SP, Hann MM. RECAP – retrosynthetic combinatorial analysis procedure: a powerful new technique for identifying privileged molecular fragments with useful applications in combinatorial chemistry. J Chem Inf Comput Sci. 1998;38(3):511–522. | ||
ChemAxon [webpage on the Internet]. JChem Software, Version 5.11.3; 2012. Available from: https://www.chemaxon.com/jchem/doc/user/LibMCS.html. Accessed May 19, 2015. | ||
Nagar B, Bornmann WG, Pellicena P, et al. Crystal structures of the kinase domain of c-Abl in complex with the small molecule inhibitors PD173955 and imatinib (STI-571). Cancer Res. 2002;62(15):4236–4243. | ||
Wisniewski D, Lambek CL, Liu C, et al. Characterization of potent inhibitors of the Bcr-Abl and the c-Kit receptor tyrosine kinases. Cancer Res. 2002;62(15):4244–4255. | ||
Zimmermann J, Buchdunger E, Mett H, Meyer T, Lydon NB. Potent and selective inhibitors of the Abl-kinase: phenylaminopyrimidine (Pap) derivatives. Bioorg Med Chem Lett. 1997;329(7):187–192. | ||
Kraker AJ, Hartl BG, Amar AM, Barvian MR, Showalter HD, Moore CW. Biochemical and cellular effects of c-Src kinase-selective pyrido[2, 3-d]pyrimidine tyrosine kinase inhibitors. Biochem Pharmacol. 2000;60(7):885–898. | ||
McHardy T, Caldwell JJ, Cheung KM, et al. Discovery of 4-amino-1-(7H-pyrrolo[2,3-d]pyrimidin-4-yl)piperidine-4-carboxamides as selective, orally active inhibitors of protein kinase B (Akt). J Med Chem. 2010;53(5):2239–2249. | ||
Caldwell JJ, Davies TG, Donald A, et al. Identification of 4-(4-aminopiperidin-1-yl)-7H-pyrrolo[2,3-d]pyrimidines as selective inhibitors of protein kinase B through fragment elaboration. J Med Chem. 2008;51(7):2147–2157. | ||
Donald A, McHardy T, Rowlands MG, et al. Rapid evolution of 6-phenylpurine inhibitors of protein kinase B through structure-based design. J Med Chem. 2007;50(10):2289–2292. | ||
Wang S, Griffiths G, Midgley CA, et al. Discovery and characterization of 2-anilino-4-(thiazol-5-yl)pyrimidine transcriptional CDK inhibitors as anticancer agents. Chem Biol. 2010;17(10):1111–1121. | ||
Hast MA, Fletcher S, Cummings CG, et al. Structural basis for binding and selectivity of antimalarial and anticancer ethylenediamine inhibitors to protein farnesyltransferase. Chem Biol. 2009;16(2):181–192. | ||
Battistutta R, Cozza G, Pierre F, et al. Unprecedented selectivity and structural determinants of a new class of protein kinase ck2 inhibitors in clinical trials for the treatment of cancer. Biochemistry. 2011;50(39):8478–8488. | ||
Pierre F, Stefan E, Nédellec AS, et al. 7-(4H-1,2,4-triazol-3-yl)benzo[c][2,6]naphthyridines: a novel class of Pim kinase inhibitors with potent cell antiproliferative activity. Bioorg Med Chem Lett. 2011;21(22):6687–6692. | ||
Hou Z, Nakanishi I, Kinoshita T, et al. Structure-based design of novel potent protein kinase CK2 (CK2) inhibitors with phenyl-azole scaffolds. J Med Chem. 2012;55(6):2899–2903. | ||
Pierre F, Regan CF, Chevrel MC, et al. Novel potent dual inhibitors of CK2 and Pim kinases with antiproliferative activity against cancer cells. Bioorg Med Chem Lett. 2012;22(9):3327–3331. | ||
Berg S, Bergh M, Hellberg S, et al. Discovery of novel potent and highly selective glycogen synthase kinase-3β (GSK3β) inhibitors for Alzheimer’s disease: design, synthesis, and characterization of pyrazines. J Med Chem. 2012;55(21):9107–9119. | ||
Coghlan MP, Culbert AA, Cross DA, et al. Selective small molecule inhibitors of glycogen synthase kinase-3 modulate glycogen metabolism and gene transcription. Chem Biol. 2000;7(10):793–803. | ||
Good JA, Wang F, Rath O, et al. Optimized S-trityl-L-cysteine-based inhibitors of kinesin spindle protein with potent in vivo antitumor activity in lung cancer xenograft models. J Med Chem. 2013;56(5):1878–1893. | ||
Tojo S, Kohno T, Tanaka T, et al. Crystal structures and structure-activity relationships of imidazothiazole derivatives as IDO1 inhibitors. ACS Med Chem Lett. 2014;5(10):1119–1123. | ||
Fawcett T. An introduction to ROC analysis. Pattern Recognit Lett. 2006;27(8):861–874. | ||
Yang JM, Shen TW. A Pharmacophore-based evolutionary approach for screening selective estrogen receptor modulators. Proteins. 2005;59(2):205–220. | ||
Muegge I. Selection criteria for drug-like compounds. Med Res Rev. 2003;23(3):302–321. | ||
Ntie-Kang F, Kannan S, Wichapong K, Owono Owono LC, Sippl W, Megnassan E. Binding of pyrazole-based inhibitors to Mycobacterium tuberculosis pantothenate synthetase: docking and MM-GB(PB)SA analysis. Mol Biosyst. 2014;10(2):223–239. | ||
Liao HS, Liu HL, Chen WH, Ho Y. Structure-based pharmacophore modeling and virtual screening to identify novel inhibitors for anthrax lethal factor. Med Chem Res. 2014;23(8):3725–3732. | ||
Koide Y, Uemoto K, Hasegawa T, et al. Pharmacophore-based design of sphingosine 1-phosphate-3 receptor antagonists that include a 3,4-dialkoxybenzophenone scaffold. J Med Chem. 2007;50(3):442–454. | ||
Lu SH, Wu JW, Liu HL, et al. The discovery of potential acetylcholinesterase inhibitors: a combination of pharmacophore modeling, virtual screening, and molecular docking studies. J Biomed Sci. 2011;18:8. | ||
Seal A, Yogeeswari P, Sriram D; OSDD Consortium, Wild DJ. Enhanced ranking of PknB inhibitors using data fusion methods. J Cheminform. 2013;5(1):2. | ||
Kalva S, Azhagiya Singam ER, Rajapandian V, Saleena LM, Subramanian V. Discovery of potent inhibitor for matrix metalloproteinase-9 by pharmacophore based modeling and dynamics simulation studies. J Mol Graph Model. 2014;49:25–37. | ||
Sanderson DM, Earnshaw CG. Computer prediction of possible toxic action from chemical structure; the DEREK system. Hum Exp Toxicol. 1991;10(4):261–273. | ||
Greene N, Judson PN, Langowski JJ, Marchant CA. Knowledge-based expert systems for toxicity and metabolism prediction: DEREK, StAR and METEOR. SAR QSAR Environ Res. 1999;10(2–3):299–314. | ||
Marchant CA, Briggs KA, Long A. In silico tools for sharing data and knowledge on toxicity and metabolism: Derek for Windows, Meteor, and Vitic. Toxicol Mech Methods. 2008;18(2–3):177–187. | ||
Ridings JE, Barratt MD, Cary R, et al. Computer prediction of possible toxic action from chemical structure: an update on the DEREK system. Toxicology. 1996;106(1–3):267–279. | ||
Greene N. Computer software for risk assessment. J Chem Inf Comput Sci. 1997;37(1):148–150. | ||
Marchant CA. Computational toxicology: a tool for all industries. Wiley Interdiscip Rev Comput Mol Sci. 2012;2(3):424–434. | ||
Sherhod R, Gillet VJ, Judson PN, Vessey JD. Automating knowledge discovery for toxicity prediction using jumping emerging pattern mining. J Chem Inf Model. 2012;52(11):3074–3087. | ||
Happi EN, Waffo AF, Wansi JD, Ngadjui BT, Sewald N. O-prenylated acridone alkaloids from the stems of Balsamocitrus paniculata (Rutaceae). Planta Med. 2011;77(9):934–938. | ||
Tsassi VB, Hussain H, Meffo BY, et al. Antimicrobial coumarins from the stem bark of Afraegle paniculata. Nat Prod Commun. 2010;5(4):559–561. | ||
Wall ME, Wani MC, Hughes TJ, Taylor H. Plant antimutagenic agents, 1. General bioassay and isolation procedure. J Nat Prod. 1988;51(5):866–873. | ||
Zhang Y, Cao Y, Zhan Y, Duan H, He L. Furanocoumarins-imperatorin inhibits myocardial hypertrophy both in vitro and in vivo. Fitoterapia. 2010;81(8):1188–1195. | ||
Khalid H, Abdalla WE, Abdelgadir H, Opatz T, Efferth T. Gems from traditional North-African medicine: medicinal and aromatic plants from Sudan. Nat Prod Bioprospect. 2012;2(3):92–103. | ||
National Toxicology Program (NTP). Toxicology and carcinogenesis studies of 8-methoxypsoralen (CAS No 298-81-7) in F344/N rats (gavage studies). National Toxicology Program Report, Additional Content: TR-359; Chapel Hill, USA; 1989. | ||
Dall’Acqua F, Terbojevich M, Marciani S, Vedaldi D, Recher M. Investigation of the dark interaction between furocoumarins and DNA. Chem Biol Interact. 1978;21(1):103–115. | ||
Quinto I, Averbeck D, Moustacchi E, Hrisoho Z, Moron J. Frameshift mutagenicity in Salmonella typhimurium of furocoumarins in the dark. Mutat Res. 1984;136(1):49–54. | ||
Ferguson LR, Denny WA. The genetic toxicology of acridines. Mutat Res. 1991;258(2):123–160. | ||
Albertini S, Bös M, Gocke E, Kirchner S, Muster W, Wichmann J. Suppression of mutagenic activity of a series of 5HT2c receptor agonists by the incorporation of a gem-dimethyl group: SAR using the Ames test and a DNA unwinding assay. Mutagenesis. 1998;13(4):397–403. |
 © 2016 The Author(s). This work is published and licensed by Dove Medical Press Limited. The full terms of this license are available at https://www.dovepress.com/terms.php and incorporate the Creative Commons Attribution - Non Commercial (unported, v3.0) License.
By accessing the work you hereby accept the Terms. Non-commercial uses of the work are permitted without any further permission from Dove Medical Press Limited, provided the work is properly attributed. For permission for commercial use of this work, please see paragraphs 4.2 and 5 of our Terms.
© 2016 The Author(s). This work is published and licensed by Dove Medical Press Limited. The full terms of this license are available at https://www.dovepress.com/terms.php and incorporate the Creative Commons Attribution - Non Commercial (unported, v3.0) License.
By accessing the work you hereby accept the Terms. Non-commercial uses of the work are permitted without any further permission from Dove Medical Press Limited, provided the work is properly attributed. For permission for commercial use of this work, please see paragraphs 4.2 and 5 of our Terms.