")
Back to Journals » Diabetes, Metabolic Syndrome and Obesity » Volume 17
Gender-Specific Fat Distribution and Association with Type 2 Diabetes Mellitus: A Study of Adiposity Indicators (DEXA, BMI, Waist-to-Hip Ratio) in Adults from Qatar
Authors Yousif D , ElTantawi N , Badr A, Nurulhaque Z, Al-Jabri A, Haithm YM, Al- Meraikhi N, Chivese T, Rathnaiah Babu G
Received 5 September 2023
Accepted for publication 26 January 2024
Published 15 April 2024 Volume 2024:17 Pages 1715—1724
DOI https://doi.org/10.2147/DMSO.S432331
Checked for plagiarism Yes
Review by Single anonymous peer review
Peer reviewer comments 3
Editor who approved publication: Dr Konstantinos Tziomalos
Duaa Yousif,1 Nouran ElTantawi,1 Ahmed Badr,1 Zainab Nurulhaque,1 Almaha Al-Jabri,1 Yunes Mohammed Haithm,1 Najlaa Al- Meraikhi,1 Tawanda Chivese,2 Giridhara Rathnaiah Babu2
1College of Medicine, QU Health, Qatar University, Doha, Qatar; 2Department of Population Medicine, College of Medicine, QU Health, Qatar University, Doha, Qatar
Correspondence: Giridhara Rathnaiah Babu, Global Health, Department of Population Medicine, College of Medicine, QU Health, Qatar University, Doha, Qatar, Email [email protected]
Aim: This study aimed to investigate the difference in adiposity measured by DEXA between people with type 2 diabetes mellitus (T2DM) and those without. Moreover, we investigated the most reliable adiposity measure for discriminating people with T2DM from those without in clinical settings.
Methods: A cross-sectional study was conducted from the database of Qatar Biobank (QBB), which comprised adults with a previous diagnosis of T2DM mellitus in Qatar. t–test and multivariable linear regression models were used to assess the association between T2DM and the difference in DEXA and BMI adiposity measures. Moreover, an evaluation of the odds of abnormal waist-hip ratio in participants with T2DM using an adjusted multivariable logistic regression was conducted.
Results: Among the participants with T2DM, males had less fat in the leg region, while females had less fat in the legs and gynoid regions, compared to individuals without T2DM. Females with T2DM had a higher average BMI. Moreover, the odds of having an abnormal waist-to-hip ratio were higher in males and females with T2DM compared to persons without T2DM.
Conclusion: There were different patterns of fat deposition in males and females with T2DM. T2DM was associated with a higher BMI in females only. The odds of abnormal waist-hip ratio were higher in individuals with T2DM of both genders. Waist-hip ratio showed reliable discrimination for T2DM and has implications for clinical practice.
Keywords: type 2 diabetes mellitus, adiposity, waist Hip ratio, body fat distribution, Qatar Biobank
Introduction
Type-2 Diabetes Mellitus (T2DM) is a chronic metabolic disease characterized by high peripheral glucose levels. The global prevalence of T2DM is expected to increase to 7079 individuals per 100,000 by 2030, indicating a significant public health concern.1 In Qatar, the prevalence of T2DM among adults was approximately 17% in 2019,2 highlighting the need for studies regarding the changes in persons with T2DM to improve clinical assessment and management.
Excessive adipose tissue is a well-established contributor to cardio-metabolic risk, with a wealth of studies underscoring its role in health outcomes.3,4 Despite this, there is a scarcity of research focusing on fat distribution in individuals with T2DM compared to those without the condition. Traditional anthropometric measurements, such as BMI and waist circumference, are commonly used for adiposity estimation but are less sensitive than Dual Energy X-ray Absorptiometry (DEXA), which is the gold standard. DEXA offers a detailed assessment of whole body and regional fat mass, lean mass, and bone mineral density.5
Understanding the relationship between body fat distribution and T2DM is vital as accumulating evidence indicates a direct link between fat accumulation, particularly in specific body regions, and the development of insulin resistance, a key precursor to T2DM.6 However, there is a discernible paucity of research delving into the alterations in fat distribution patterns among individuals diagnosed with T2DM. This study was carried out to bridge this research gap by employing a comprehensive evaluation of adiposity markers, utilizing the advanced capabilities of DEXA. This study aimed to assess the changes in DEXA adiposity markers in people with T2DM and identify the most reliable adiposity measure for discriminating between T2DM and no T2DM in clinical settings.
Methods
Study Design
This study is a cross-sectional study of adult participants aged >18 years. All data were obtained from the Qatar Biobank database. This study was analyzed as a case-control study. The Qatar Biobank study was initiated in 2012 to recruit 60,000 participants from the local population of Qatar, including Qatari nationals and long-term residents who have lived in the country for at least 15 years. The study is ongoing and continues to engage actively in research activities. The study methodology involves collecting detailed personal data and biological samples from the participants during the first visit, then repeating the process after five years to assess changes in health status and lifestyle over time. A total of 500 participants with T2DM and 500 participants without T2DM were included because of the limitation of a maximum of 1000 subjects given to the researchers by the QBB. Those participants were collected randomly from the QBB database. The study protocol was ethically approved by Qatar Biobank Institutional Review Board. Missing data were handled during the data cleaning process, where the research team identified any missing or erroneous data points and either corrected them or excluded them from the analysis. The research team conducted sensitivity analyses to assess the impact of missing data on the study’s results and test the robustness of statistical models used in the analysis.
Participants
The study included adult males and females aged over 18 years who had been diagnosed with T2DM and had available DEXA measurements, BMI, and waist-hip ratio. Individuals diagnosed with type 1 diabetes mellitus or with diabetes with age of onset earlier than 18 years were excluded from the study.
Exposure
The exposure was defined as a pre-existing diagnosis of T2DM. Establishing the diagnosis of T2DM requires a set of criteria to be fulfilled, which includes the use of fasting plasma glucose (FPG), two-hour plasma glucose during a 75 g oral glucose tolerance test (OGTT), or glycated hemoglobin (HbA1C) for diagnostic testing. Individuals presenting with classic symptoms of hyperglycemia (polyuria, polydipsia, polyphagia) and a random blood glucose of 200 mg/dL (11.1 mmol/L) or higher can be easily diagnosed with T2DM. In the absence of symptoms, a diagnosis can be established if FPG values are≥126 mg/dL (7.0 mmol/L). Fasting is defined as no caloric intake for at least eight hours, or two-hour plasma glucose values of ≥200 mg/dL (11.1 mmol/L) during a 75 g OGTT, or HbA1C value was ≥6.5% (48 mmol/mol).
If an individual is asymptomatic, the same test needs to be repeated twice for confirmation of diagnosis. However, if two different tests (eg, FPG and HbA1C) indicate elevated blood glucose levels, then no further testing is required. In case two various tests show different results (ie, one shows elevated glucose while the other does not), repeat the test that is diagnostic of diabetes to confirm the diagnosis.7
Outcome
The primary outcome of this study was the difference in adiposity markers measured by DEXA. DEXA is an imaging modality that provides an in-depth analysis of a person’s body fat tissue percentage in different regions, as well as the lean mass and bone density. By generating two photon beams of different energy levels and detecting the difference in absorption of the two-photon beams, the DEXA technique can distinguish between bone and soft tissue, allowing for precise determination of bone mineral density and fat percentages.5,8 The DEXA adiposity markers that were evaluated in this study were regional percentages of fat in the arms, legs, trunk, android, gynoid, and the total percentage of fat.
Besides DEXA measurements, BMI and waist-hip ratio (WHR) adiposity measures were evaluated as a secondary outcome of this study. The BMI is a tool that measures an individual’s weight in relation to their height. BMI is calculated by dividing an individual’s weight in kilograms by their height in meters squared. The quotient is used to classify individuals into underweight (BMI<18.5), normal weight (BMI 18.5–24.9), overweight (25–29.9), or obese (BMI>30).
Waist-hip ratio is a simple technique for determining central body fat distribution, which is calculated by dividing the waist circumference by that of the hip.9
Other Data Collected
Other data collected were nationality, age, gender, income, educational level, employment status, smoking status, cholesterol and triglycerides levels, diet, and blood pressure measures.
Statistical Analysis
Baseline characteristics were reported as percentages for categorical variables. Continuous variables were tested for normal distribution, and normally distributed data were reported as means and standard deviations, while non-normally distributed data were reported as medians and interquartile ranges.
T-tests were used to investigate differences in DEXA adiposity markers between participants with and without T2DM. Multivariable linear regression was then used to assess the association between changes in DEXA measures and T2DM while adjusting for confounders.
To investigate the association between BMI and T2DM, an adjusted multivariable linear regression was used. Moreover, an adjusted multivariable logistic regression was used to assess the odds of having an abnormal waist-hip ratio, with the predictor variable as T2DM and the outcome variable as an abnormal waist-hip ratio. The cutoff for an abnormal waist-hip ratio was set at 0.815 for females and 0.925 for males.10 The association between T2DM and different adiposity markers was investigated with stratification by sex to account for the physiological differences between males and females in fat distribution. Linear regression models were conducted in the primary and secondary analyses assuming a normal distribution of the DEXA measurements and BMI. Diet and age were accounted for in the adjusted analysis. All the statistical analyses were done using Stata software version 17, and exact p-values were reported.
Confounders
A direct acyclic graph (DAG) shown in Figure 1 was done to visualize the relationship between the exposure (T2DM), the outcome of interest (adiposity), and to select the appropriate confounders, which were; physical activity, age, and diet. The confounders were identified based on the literature review and the risk/prognostic factors of the outcome. However, it was not possible to adjust for physical activity due to inadequate information on this variable in the Qatar biobank database. Therefore, the potential for residual confounding by physical activity remains a limitation of this study.
 |
Figure 1 Direct Acyclic Graph to identify confounders. |
Ethics
The study was reviewed and approved by the Ethics Committee of the Qatar Biobank (QF-QBB-RES-ACC-00077). The informed consent was duly obtained from all study participants by Qatar Biobank. All procedures and protocols strictly adhered to the guidelines as outlined in the Declaration of Helsinki. Qatar Biobank has an agreement with Qatar University to share anonymous data with faculty and students affiliated with Qatar University.
Results
The study sample consisted of 500 with and 500 without T2DM. Most of the participants were Qatari in both groups. There are 407 (81.4%) Qatari participants in the group with T2DM and 411 (82.2%) Qatari participants without T2DM.
The median age in the participants without T2DM was 36 years, whereas it was 55 years in the group with T2DM, and 54.4% of the group without T2DM participants were females. In the group with T2DM, 47% of the participants were women. The median BMI in the group with T2DM was significantly higher than that of those without T2DM (median 31.5 (IQR 28.1, 35.3) vs 28.9 (IQR 25.1, 32.6), p<0.01) . The waist-hip ratio was 0.8 (IQR 0.7, 0.9) in the group without T2DM, which was significantly lower than the median of 0.9 (IQR 0.9, 1.0) in the group with T2DM. Most participants in both groups consumed less than three fast-food meals per week, accounting for 82.3% and 91.9% in the group without T2DM and the group with T2DM, respectively. However, more participants in the group without T2DM consumed three or more fast food meals than in cases. The median HBA1C% in the group without T2DM was 5.3% compared to 7.9% in the group with T2DM. (Table 1)
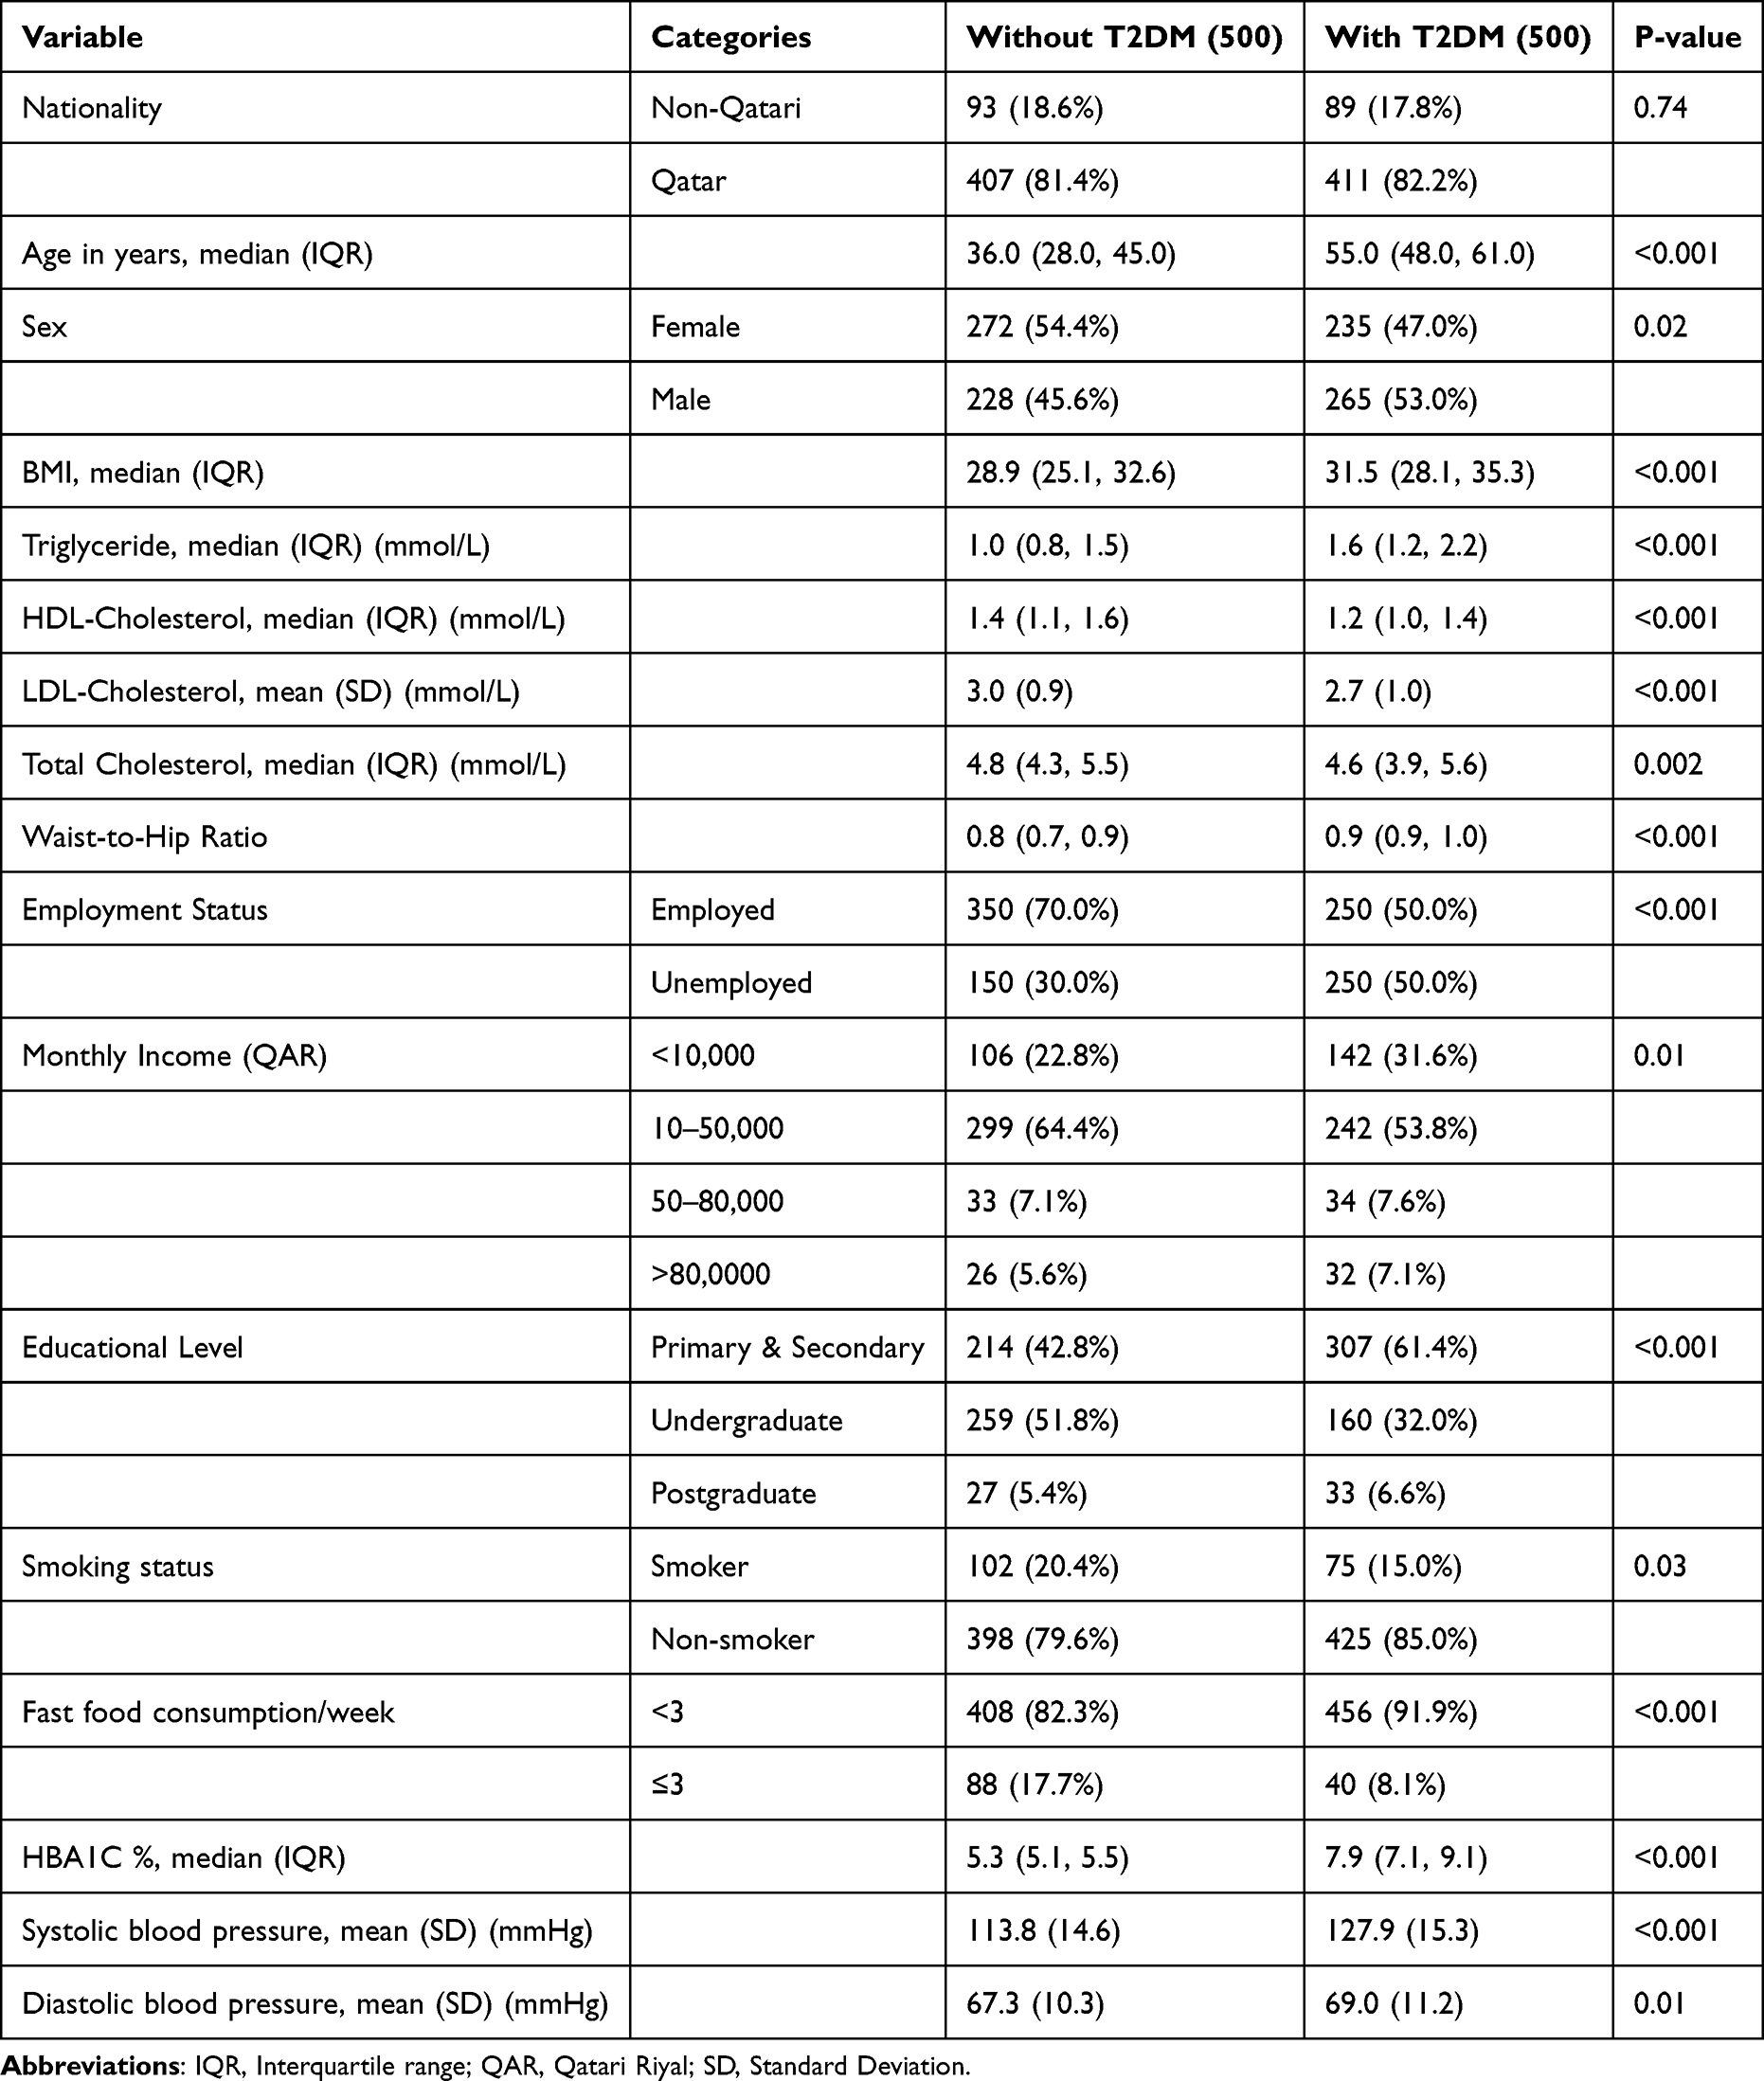 |
Table 1 Demographic and Clinical Characteristics of Participants by Diabetes Status |
Figure 2 illustrates a comparative analysis of regional fat percentage in participants with and without Type 2 Diabetes Mellitus.
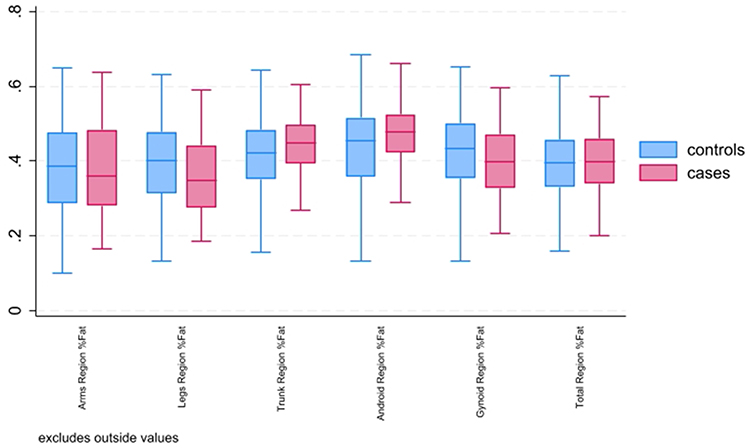 |
Figure 2 Comparative analysis of regional fat percentage in cases and controls. |
There was a lower mean fat percentage in both legs and gynoid regions in persons with T2DM compared to those without, with mean differences of 0.03% and 0.02%, respectively, with very strong evidence against the null hypothesis at this sample size (p<0.01 in both cases). In comparison, a higher mean percentage of fat in trunk and android regions was observed in those with T2DM, compared to individuals without T2DM with mean difference of 0.04%, with strong evidence against the null hypothesis at this sample size. (Table 2)
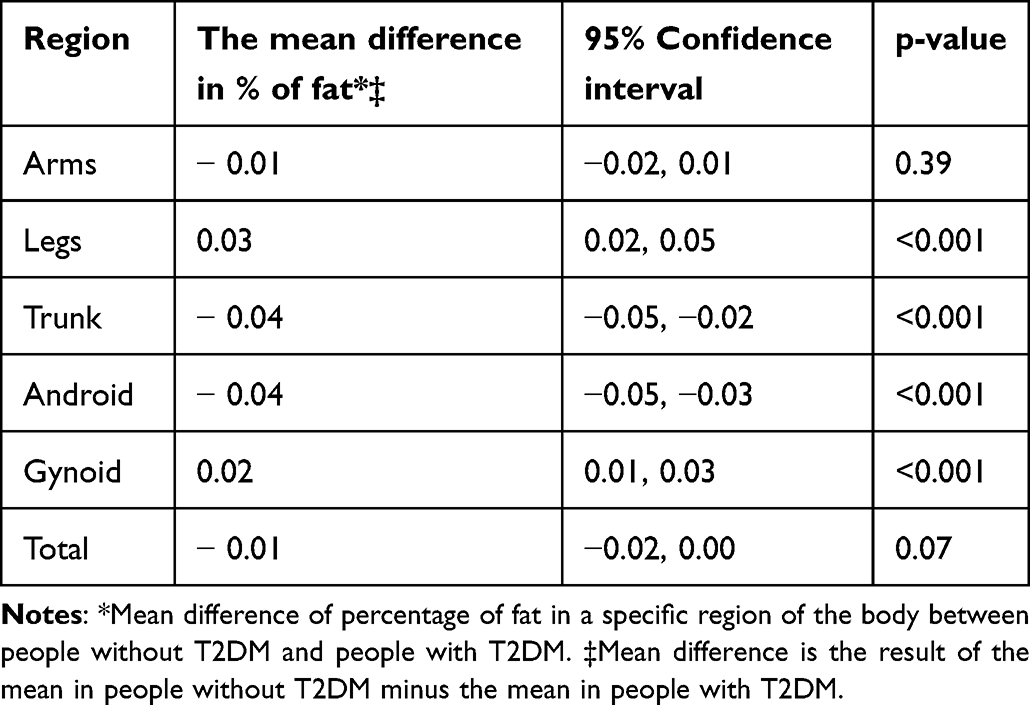 |
Table 2 t–tests: Comparison of DEXA adiposity measures between individuals with and without T2DM |
In females, the average percentage of fat in the legs region was 0.45, and it was lower by 0.03 in women with T2DM compared to those without. Similarly, the average percentage of fat in the gynoid region in females without T2DM was 0.47, lower by 0.02.
In males without T2DM, the average percentage of fat in the legs region was 0.29. In T2DM, males had a lower average fat percentage in the legs region by 0.02, with strong evidence against the null hypothesis at this sample size. (Table 3)
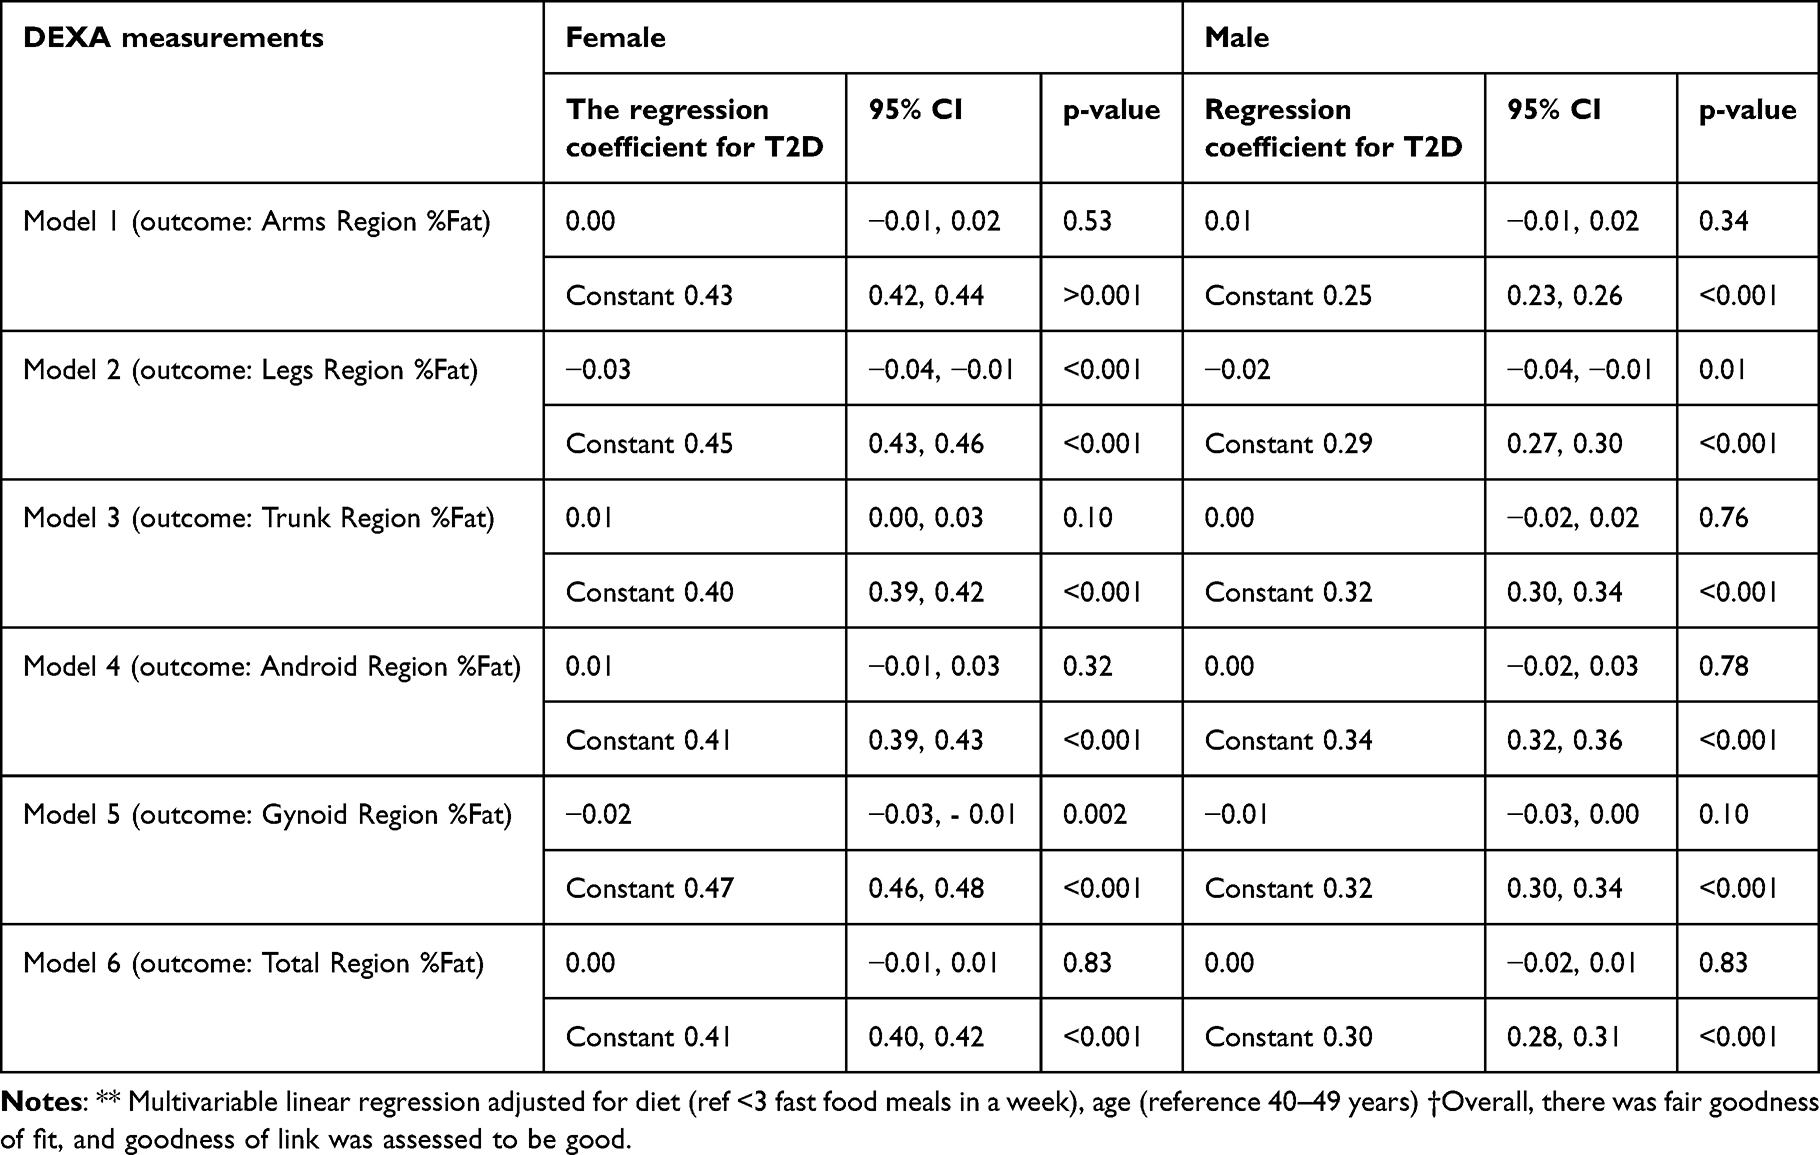 |
Table 3 Association Between T2DM and Adiposity (Multivariable linear Analysis) **† |
The results from multivariable linear regression showed that the mean BMI in females with T2DM was higher by 2.69 compared to females without T2DM (Beta=2.69, 95% CI 1.35–4.03, P value<0,001). (Table 4) Waist hip ratios cutoff was set at 0.815 in females and 0.925 in males. The odds of having an abnormal waist-to-hip ratio were five folds higher in females with T2DM than in females without T2DM (OR=5.32, 95% CI 3.26–8.68, P value <0.001). For males with T2DM, the odds of having an abnormal waist-hip ratio were three folds higher than for males without T2DM. (OR=3.32, 95% CI 2.01–5.48, P value <0.001) (Table 5) On assessment of the area under the curve for all the previously assessed adiposity markers, the waist-hip ratio showed the greatest area under the curve (0.80), followed by BMI (0.63), trunk (0.59), and android regional percentage of fat. (Figure 3)
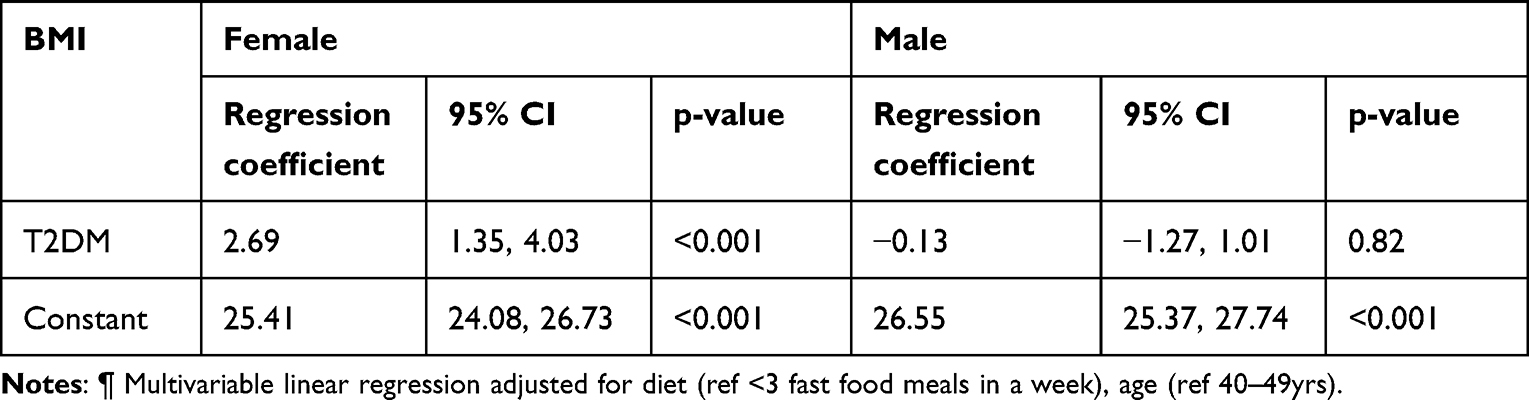 |
Table 4 Association Between T2DM and BMI (Multivariable Analysis) |
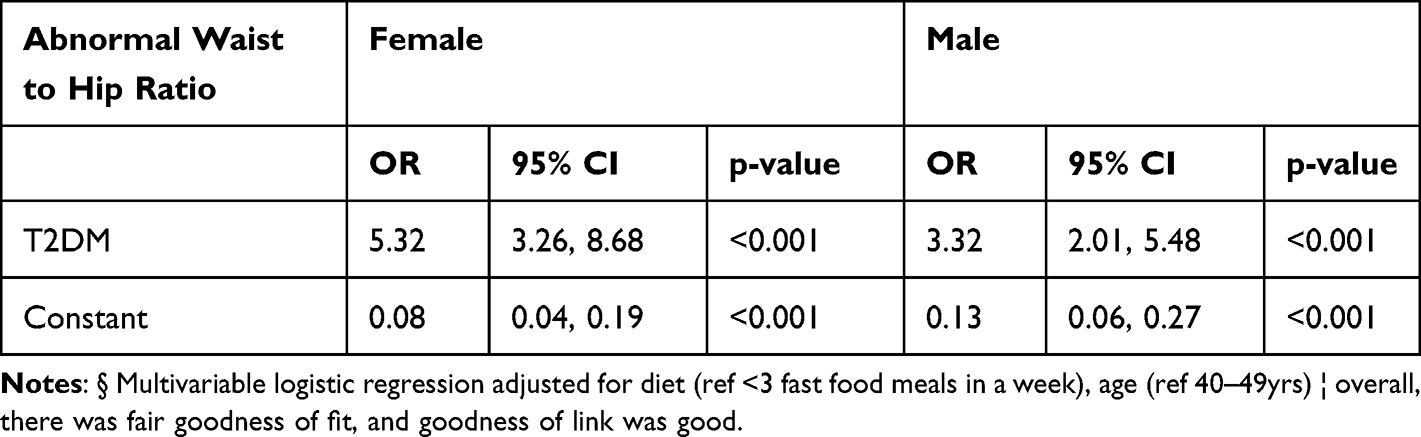 |
Table 5 Association Between T2DM and Waist Hip Ratio (Multivariable Analysis) § ¦ |
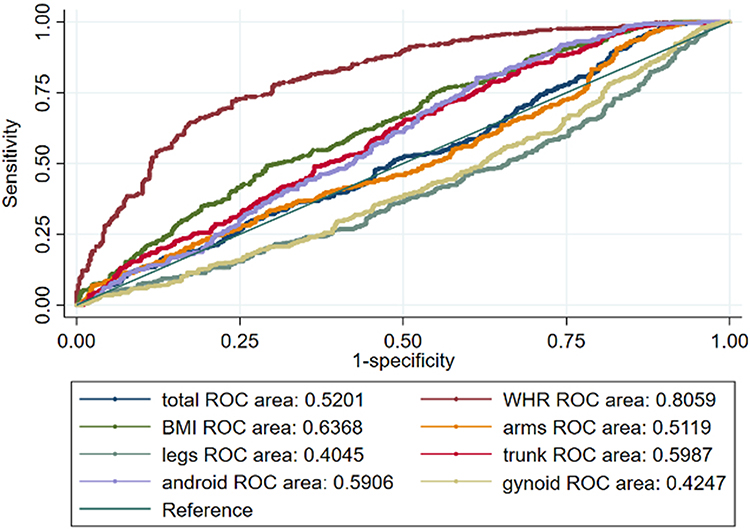 |
Figure 3 ROC curve depicting the area under the curve for anthropometric markers. |
The analysis of link functions was performed to ensure the correct specification of the relationship between predictors and response variable. (Supplemental Figures 1–17)
Discussion
This study shows that with stratification by gender and adjustment for confounders, females with T2DM had a lower average percentage of fat in the legs and gynoid. At the same time, males with T2DM had a lower average percentage of fat in the legs only. Although there was loss of fat in certain regions, it is unlikely to be clinically significant given that the mean percentage difference was small. This finding requires further investigation. The observed patterns underscore the necessity for a more comprehensive investigation to understand the underlying mechanisms and potential long-term implications of these fat distribution differences in individuals with T2DM. Further research could provide valuable insights, aiding in the development of gender-specific strategies for managing and mitigating the risks associated with T2DM.
Moreover, the assessment of other markers showed gender-specific features. In females, T2DM was associated with a higher average BMI. The findings suggest a significant increase in the odds of having a high waist-hip ratio in T2DM in both genders but the fold increase in odds of having a high waist-hip ratio was higher in females than males. This is worth further investigations to understand mechanisms for differential body composition in relation to T2DM in females compared to males. Even though DEXA measurement models suggested that there was a lower average percentage of fat in certain areas in each gender with T2DM, BMI showed a higher average in females with T2DM, and there was an increase in the odds of an abnormal waist hip ratio in both genders with T2DM. . BMI accounts for the whole body while the waist-hip ratio combines two regions in the body. Therefore, area-specific changes are masked in BMI and the waist-hip ratio. Although DEXA measurements demonstrate more accurate changes in the fat distribution, the waist hip ratio showed a larger area under the ROC curve than any DEXA measurements or BMI. This suggests that the waist-hip ratio can discriminate between participants with T2DM and those without T2DM. A higher waist-hip ratio can distinguish between T2DM and no diabetes in a clinical setting better than any other measure that was assessed. A study on the Taiwanese population also showed the superiority of waist-hip-ratio over BMI as a marker forh T2DM, which supports this study’s findings.11 This is important clinically because the waist-hip ratio is easy to obtain and is not expensive.
The observed disparity in fat loss across different regions between females and males within this study shows gender-specific fat loss in the context of T2DM. One plausible explanation for this observation might be rooted in the gender-based variations in diabetes management and control. Previous research suggested that insulin sensitivity is higher and, that women have higher capacities for insulin secretion and incretin responses than men; although, these sex advantages all disappear when glucose tolerance deteriorates towards diabetes.12 Further, evidence suggests that gender significantly influences diabetes risk factors, progression, and outcomes, necessitating tailored, gender-specific approaches in both clinical interventions and research.13,14 Specifically, it is postulated that women might face unique challenges in diabetes management compared to their male counterparts, potentially influencing their commitment and adherence to treatment regimens. This is not to say that women exhibit lesser commitment, but rather their approach and responsiveness to treatment plans may differ due to a variety of factors, including physiological and psychosocial dimensions. Furthermore, women might possess distinct adaptability mechanisms when it comes to disease management, which could subsequently impact their fat distribution patterns in the context of T2DM. A scoping review support this finding; illness perception leads to medication adherence, which varies according to one’s knowledge of T2DM and gender.15 This study sheds light on this underexplored area, showing potential gender-specific adiposity changes in T2DM patients. By highlighting these findings, the necessity for greater understanding and development of a tailored and gender-sensitive approach to diabetes care and management is appreciated. Thispaves the way for future research endeavors aimed at unraveling the complexities of gender differences in T2DM management and their implications on adipose tissue distribution.
In this study fat composition was assessed by DEXA scans; these scans are capable of measuring both visceral and subcutaneous fat. The visceral adipose tissue (VAT) can be estimated from the total abdominal fat measured by DXA. Although DEXA is efficient and validated for general population visceral fat assessment, its potential for VAT overestimation is a noted limitation.18,19 Therefore, the role of visceral adipose tissue was not discussed in this study.
Since the waist-hip ratio considers waist circumference, the waist-hip ratio is an index of the abdominal subcutaneous fat level.20 The results in this study demonstrate that participants with T2DM had greater odds of having an abnormal waist-hip ratio, suggesting that abdominal subcutaneous fat has a role in T2DM. The role of abdominal subcutaneous fat in disease states has largely been, with conflicting evidence surrounding its role as a metabolic risk factor, with more studies suggesting that abdominal visceral fat is the more metabolically active fat that confers greater metabolic risk.21,20 However, emerging evidence supports the hypothesis of this study regarding the metabolic activity of abdominal subcutaneous fat, where some studies have shown that the waist-hip ratio is a better marker of risk.21 This suggests that despite the limitations in visceral fat estimation in this study, subcutaneous fat distribution is an important factor in T2DM, warranting further exploration.
The study had several strengths points. First, this study investigated the changes measured by three different measures: DEXA, BMI, and waist-hip ratio. Second, participants were stratified by gender to eliminate any physiological differences and adjusted for important: age and diet. Third, this study provides an ROC curve incorporating all the assessed markers to identify the best predictor of type 2 diabetes.
The study has some limitations. First, the cross-sectional sample in this study suffers from temporal ambiguity and selection bias, including volunteer bias. Second, the dataset lacked information about diabetes duration, drug use, and physical activity. Therefore, it was not possible to adjust for these variables. Participants’ physical activity is important for the fat distribution in both the primary and the secondary analyses, as indicated in the DAG. However, more information regarding physical activity was needed. Lastly, the data regarding the participants’ diet may not have been sufficient. Thus, for the diet variable, which is an important predictor for fat distribution, one question that assessed the number of fast-food per week was used, but more was needed to fully adjust for diet.
Conclusion
T2DM is associated with a lower average percentage of fat in the legs and, in females, while in males, this difference was seen in the region only. The odds of having an abnormal waist-hip ratio were increased in both genders with T2DM. The average BMI was higher in females with T2DM only. Out of all the markers assessed, the waist-hip ratio was the best discriminator for tT2DM. Waist to hip ratio can be used immediately in clinical practice as it is easy, relatively reliable, and economical. Further studies to assess why females with T2DM exhibit differential fat composition and loss of fat in more areas than males are recommended.
Acknowledgment
We acknowledge the data from the Qatar BioBank and support from the Population Medicine department, College of Medicine Qatar University, in the conduct of the study. We are grateful to all the participants of the study.
The abstract of this paper was presented at the 5th Palestinian Undergraduate Research Conference as a conference talk with interim findings. The abstract was published in Palstudent Scientific Research Journal: (https://dspace.alquds.edu/handle/20.500.12213/8669)
Funding
Open Access funding provided by the Qatar National Library.
Disclosure
The authors report no conflicts of interest in this work.
References
1. Khan MAB, Hashim MJ, King JK, Govender RD, Mustafa H, Al Kaabi J. Epidemiology of type 2 diabetes–global burden of disease and forecasted trends. J Epide Global Health. 2020;10(1):107. doi:10.2991/jegh.k.191028.001
2. Al Abdulla S, Hassan D, Mohammed A, Bevington J. SMART population screening and management in Qatar. Int J Diabetes Clin Res. 2019;6:99.
3. Migliaccio S, Greco EA, Aversa A, Lenzi A. Age-associated (cardio) metabolic diseases and cross-talk between adipose tissue and skeleton: endocrine aspects. Hormone Mol Biol Clin Invest. 2014;20(1):25–38. doi:10.1515/hmbci-2014-0030
4. Yi W, Kim K, Im M, et al. Association between visceral adipose tissue volume, measured using computed tomography, and cardio-metabolic risk factors. Sci Rep. 2022;12(1):1–8. doi:10.1038/s41598-021-99269-x
5. Borga M, West J, Bell JD, et al. Advanced body composition assessment: from body mass index to body composition profiling. J Invest Med. 2018;66(5):1–9. doi:10.1136/jim-2018-000722
6. Sears B, Perry M. The role of fatty acids in insulin resistance. Lipids Health Dis. 2015;14(1):1–9. doi:10.1186/s12944-015-0123-1
7. Amer Diabet A. Standards of medical care in diabetes-2013. Diabetes Care. 2013;36:S11–66.
8. McLaughlin J, Kipping R, Owen-Smith A, et al. What effect have NHS commissioners’ policies for body mass index had on access to knee replacement surgery in England?: an interrupted time series analysis from the national joint registry. PLoS One. 2022;17(6):e0270274. doi:10.1371/journal.pone.0270274
9. Baioumi AY. Comparing measures of obesity: waist circumference, waist-hip, and waist-height ratios. In: Nutrition in the Prevention and Treatment of Abdominal Obesity 2019 Jan 1. Academic Press;2024.29–40.
10. Organization WH. Waist Circumference and Waist-Hip Ratio: Report of a WHO Expert Consultation. Geneva; 2011.
11. Cheng C-H, C-C H, Yang C-F, Huang Y-C, Lai C-H, Liaw Y-P. Waist-to-Hip ratio is a better anthropometric index than body mass index for predicting the risk of type 2 diabetes in Taiwanese population. Nutr Res. 2010;30(9):585–593. doi:10.1016/j.nutres.2010.08.007
12. Tramunt B, Smati S, Grandgeorge N, et al. Sex differences in metabolic regulation and diabetes susceptibility. Diabetologia. 2020;63:453–461. doi:10.1007/s00125-019-05040-3
13. Vlassoff C. Gender differences in determinants and consequences of health and illness. J Health Popul Nutr. 2007;25(1):47.
14. Kautzky-Willer A, Leutner M, Harreiter J. Sex differences in type 2 diabetes. Diabetologia. 2023;66(6):986–1002. doi:10.1007/s00125-023-05891-x
15. Alharbi S, Alhofaian A, Alaamri MM. Illness perception and medication adherence among adult patients with type 2 diabetes mellitus: a scoping review. Clinics and Pract. 2023;13(1):71–83. doi:10.3390/clinpract13010007
16. K ML, H GJ, Punyanitya M, et al. Dual-energy X-ray performs as well as clinical computed tomography for the measurement of visceral fat. Obesity. 2012;20:1109–1114. doi:10.1038/oby.2011.367
17. Kaul S, P RM, M PD, et al. Dual-energy X-ray absorptiometry for quantification of visceral fat. Obesity. 2012;20:1313–1318. doi:10.1038/oby.2011.393
18. Bosy-Westphal A, Booke C-A, Blöcker T, et al. Measurement site for waist circumference affects its accuracy as an index of visceral and abdominal subcutaneous fat in a caucasian population. J Nutr. 2010;140(5):954–961. doi:10.3945/jn.109.118737
19. Fox CS, Massaro JM, Hoffmann U, et al. Abdominal visceral and subcutaneous adipose tissue compartments: association with metabolic risk factors in the Framingham heart study. Circulation. 2007;116(1):39–48. doi:10.1161/CIRCULATIONAHA.106.675355
20. Bray GA, Jablonski KA, Fujimoto WY, et al. Relation of central adiposity and body mass index to the development of diabetes in the diabetes prevention program. The American Journal of Clinical Nutrition. 2008;87(5):1212–1218. doi:10.1093/ajcn/87.5.1212
21. Yusuf S, Hawken S, Ounpuu S, et al. Obesity and the risk of myocardial infarction in 27 000 participants from 52 countries: a case-control study. Lancet. 2005;366(9497):1640–1649. doi:10.1016/S0140-6736(05)67663-5
 © 2024 The Author(s). This work is published and licensed by Dove Medical Press Limited. The full terms of this license are available at https://www.dovepress.com/terms.php and incorporate the Creative Commons Attribution - Non Commercial (unported, v3.0) License.
By accessing the work you hereby accept the Terms. Non-commercial uses of the work are permitted without any further permission from Dove Medical Press Limited, provided the work is properly attributed. For permission for commercial use of this work, please see paragraphs 4.2 and 5 of our Terms.
© 2024 The Author(s). This work is published and licensed by Dove Medical Press Limited. The full terms of this license are available at https://www.dovepress.com/terms.php and incorporate the Creative Commons Attribution - Non Commercial (unported, v3.0) License.
By accessing the work you hereby accept the Terms. Non-commercial uses of the work are permitted without any further permission from Dove Medical Press Limited, provided the work is properly attributed. For permission for commercial use of this work, please see paragraphs 4.2 and 5 of our Terms.