")
Back to Journals » Journal of Inflammation Research » Volume 17
Envoplakin Inhibits Macrophage Polarization by Altering the Inflammatory Tumor Microenvironment of Melanoma Through the RAS / ERK Signaling Pathway
Received 2 November 2023
Accepted for publication 29 February 2024
Published 15 March 2024 Volume 2024:17 Pages 1687—1706
DOI https://doi.org/10.2147/JIR.S447934
Checked for plagiarism Yes
Review by Single anonymous peer review
Peer reviewer comments 2
Editor who approved publication: Professor Ning Quan
Weilin Cai,1,2 Minliang Chen2
1Medical School of Chinese PLA, Beijing, People’s Republic of China; 2Senior Department of Burns and Plastic Surgery, the Fourth Medical Center of PLA General Hospital, Beijing, People’s Republic of China
Correspondence: Minliang Chen, Senior Department of Burns and Plastic Surgery, the Fourth Medical Center of PLA General Hospital, No. 51 Fucheng Road, Haidian District, Beijing, 100038, People’s Republic of China, Tel/Fax +86-010-66867304, Email [email protected]
Purpose: Tumor growth induces the tumor margin to become a transition zone rich in immune cells. EVPL is a potential prognostic biomarker for melanoma. Melanoma is difficult to cure because of its high metastasis, so it is urgent to find effective genes to inhibit tumor progression and regulate tumor microenvironment.
Methods: Firstly, differentially expressed genes (DEGs) among normal skin, nevus and melanoma samples in GSE3189 were screened. Bioinformatics was used to further explore the hub genes and enriched pathways closely related to the inflammatory response of DEGs in melanoma. We selected EVPL, which is associated with the Ras/Raf signaling pathway, for in vitro study. CCK-8, colony formation, wound healing, Transwell and flow cytometry assays were respectively used to evaluate the proliferation, migration, invasion, and apoptosis of cancer cells. Enzyme-linked immunosorbent assay was conducted for the monitoring of changes in the tumor microenvironment. To evaluate the effect of EVPL on macrophage recruitment, we established a co-culture system in a Transwell chamber. The polarization of macrophages was examined after treatment of cells with RAS/ERK signaling inhibitors SCH772984 and sh-EVPL. Additionally, changes in the expression of pathway proteins were measured by Western blot.
Results: Among the screened hub genes, EVPL was associated with the Ras/Raf pathway, a key signaling pathway in melanoma, and may be involved in regulating the inflammatory microenvironment of melanoma. Oe-EVPL was proved to suppress melanoma cell malignant progression. By inhibiting EVPL expression, the inhibitory effects on melanoma progression induced by the addition of SCH772984 were reversed. Furthermore, EVPL was found to inhibit the expression of chemokines, the recruitment of macrophages, and the polarization of macrophages through the Ras/Raf/ERK signaling pathway.
Conclusion: EVPL can inhibit the progression of melanoma through the RAS/ERK signaling pathway, change the inflammatory tumor microenvironment of melanoma, and inhibit the recruitment of macrophages.
Keywords: melanoma, inflammatory tumor microenvironment, EVPL, Ras/Raf/ERK signaling pathway, macrophages
Introduction
Melanoma, characterized by the uncontrolled melanocyte proliferation, is a highly malignant and invasive tumor with a poor prognosis.1 The prognosis of primary melanoma remains challenging despite the option to tailor resection ranges based on tumor thickness due to the high incidence of metastasis.2 The efficacy of targeted therapy, chemotherapy, and immunotherapy in treating metastatic melanoma is impeded by issues such as drug resistance and immune tolerance.3 The highly aggressive nature of melanoma results in a significant number of patients dying from its metastasis.4 Therefore, it is urgent to find effective treatment modalities and prognostic approaches to improve the survival outcomes for patients with melanoma.
Within the tumor microenvironment, macrophages constitute the predominant immune cell population. Tumor-associated macrophages exhibit remarkable plasticity and can be polarized in different directions under the influence of cytokines and growth factors, in contrast to their normal macrophage counterparts. In response to tissue or organ damage, macrophages will first polarize into pro-inflammatory M1 phenotype, releasing pro-inflammatory cytokines and exerting anti-tumor effects. However, the prevailing milieu within most tumor sites favors the pro-tumor anti-inflammatory M2 phenotype, which promotes angiogenesis, microenvironment remodeling, ectopic growth and immunosuppression by secreting anti-inflammatory cytokines to promote tumor progression.5,6 Currently, targeting M2 macrophages is recognized as a potential adjuvant approach in anti-cancer therapy, as inhibiting M2 macrophage polarization holds the potential to suppress tumor progression.7
In this study, we conducted weighted co-expression network analysis (WGCNA) and differential gene expression analysis on a GEO dataset to identify genes associated with melanoma. This was complemented by protein-protein interaction (PPI) and immune infiltration analyses. Our study revealed that Envoplakin (EVPL) is involved in the inflammatory responses in melanoma, with macrophages being the primary immune cell type associated with EVPL in the tumor microenvironment. EVPL, a member of the desmosome plaque protein family, exhibits connections with desmosome cadherins and keratin filaments.8 While prior research has acknowledged EVPL as a key gene in squamous cell carcinoma and its role in keratinocyte differentiation in metastatic melanoma,9,10 EVPL is also expected to be a novel biomarker for the treatment of metastatic melanoma.11 Its specific involvement in regulating the inflammatory tumor microenvironment of melanoma remains to be extensively studied. Based on the above basis, the molecular mechanism through which the inflammatory tumor microenvironment influences macrophage polarization is ready to be clarified.
Methods
Data Retrieval and Processing
The GSE3189 dataset, containing melanoma-related expression matrix, was downloaded. This dataset comprises seven normal skin samples (GSM71671-GSM71677), 18 benign nevus samples (GSM71678-GSM71695), and 45 melanoma samples (GSM71696-GSM71740). For the purpose of validation, the TCGA + GTEX dataset of melanoma was downloaded, including 470 cancer samples and 556 normal samples.
Identification of Differentially Expressed Genes (DEGs)
To identify DEGs between normal and melanoma samples, as well as between melanoma and nevus samples, Limma package was used for analysis in GSE3189. The screening criteria was | log2FC | > 2.0 and P < 0.05. Visualization of the results was completed using the pheatmap package (v 1.0.12). The identified DEGs were then intersected to obtain a set of common DEGs (co-DEGs).
Functional Enrichment Analysis and Annotation
To elucidate the functions of the co-DEGs, they were analyzed using the David database. The analysis encompassed Gene Ontology (GO), Kyoto Encyclopedia of Genes and Genomes (KEGG), Reactome and Wiki Pathways for metabolic pathway enrichment analysis. The top 20 key pathways were selected for presentation.
WGCNA
The GSE3189 dataset was subjected to WGCNA. Clustering analysis was performed on each sample, and outliers were subsequently removed. Calculation was made to obtain a suitable soft threshold for the correlation coefficient calculation, and the scale-free simulation coefficient R2 was obtained. Then, a co-expression network was constructed, and highly correlated gene expression patterns were divided into different modules. The module-trait relationship was detected to identify key modules. Key genes were selected based on Gene significance (GS) > 0.6 and module membership (MM) > 0.8. These key genes were plotted against the co-DEGs to obtain differential genes (referred to as “inflammatory-DEGs”) that were significantly associated with the inflammatory response in a Venn diagram.
PPI Network Construction
Based on the inflammatory-DEGs obtained above, a PPI network was constructed using the STRING database (https://string-db.org/). Subsequently, Cystoscope was used for module analysis and visualization of the constructed PPI network. The top three module genes (referred to as motif genes) were selected for GO, KEGG and Reactome enrichment analysis, conducted through the DAVID database.
Correlation Analysis of Immune Cell Infiltration of the Motif Genes
The number of different types of immune cells in the GSE3189 dataset was analyzed on the cibersortx website. We conducted a differential expression analysis of 22 immune cells in normal, nevus, and melanoma samples, and assessed the correlations among these immune cells using Pearson correlation analysis. Furthermore, the correlation between the mentioned 29 transcription factor genes and these immune cells was evaluated through correlation analysis.
Hub Gene Screening
The motif genes significantly associated with normal, nevus and melanoma samples were further analyzed using machine learning techniques, including the Random Forest (RF) model, the Support Vector Machine Recursive Feature Elimination (SVM-RFE) algorithm, and LASSO regression, for the screening of hub genes. The RF model was established using the random Forest package (v 4.7.1.1). The SVM-RFE algorithm was implemented using the e1071 package (v 1.7.13), while LASSO regression was conducted using the glmnet package (v 4.1.7). The final set of screened genes was intersected to obtain hub genes.
Validation of Hub Gene Expression
Hub gene expression was analyzed in the normal, nevus and melanoma samples from the GSE3189 dataset and the TCGA+GTEX dataset using the ggpubr package (v 0.6.0).
Immune Cell Infiltration Analysis and Single Gene Enrichment Analysis of Hub Genes
The six hub genes were subjected to CIBERSORT analysis using the cibersortx website, and also underwent single-gene enrichment pathway analysis. Pearson correlations between the 22 immunocytes and the six hub genes were calculated.
Cell Culture
A375, A2058, A875, and Sk-mel-28 (melanoma cells) were purchased from Procell Life Science & Technology Co., Ltd. HaCaT (normal cells) were procured from the Cell Bank of the Chinese Academy of Sciences (Shanghai, China). The cells were cultured in DMEM medium (Thermo Fisher, 10,564,011) supplemented with 10% fetal bovine serum (Vazyme, F102-01).12 The human monocyte line (THP-1) was purchased from the Cell Bank of the Chinese Academy of Sciences, cultured in RPMI1640 (Thermo Fisher, 11,875,119) supplemented with 10% fetal bovine serum, HEPES (10 MM) (Beyotime, C0215) and β-mercaptothion (0.05 mM) (Sigma, M6250), and treated with 25 nM PMA (Sigma, P8139) to induce the M0 macrophage phenotype.13
qRT-PCR
RNA was reverse transcribed into cDNA using HiScript III RT SuperMix for qPCR (Vazyme, R323-01). Following the manufacturer’s protocol (Vazyme, Q111-02), cDNA was added, and GAPDH and EVPL primers (Supplementary Table 1) (Sangon Biotech) were individually included in the mixing tube. The expression of EVPL was detected using the StepOneTM (Thermo Fisher).
Western Blot
20 μg of protein was added to SDS-PAGE as quantified. After protein separation, the membrane was transferred using activated PVDF membrane (Thermo Fisher, 22,860). The membrane was incubated with specific antibodies. Subsequently, the PVDF membrane was incubated with the HRP secondary antibody at room temperature. The antibodies used were as follows: Ras (abcam, ab180772), Raf (abcam, ab200653), Erk1/2 (Thr202/Tyr204) (Cell Signaling Technology, 9101S), p-ERK1/2 (Thr202, Tyr204) (Thermo Fisher, 14–9109-82) and GAPDH (Cell Signaling Technology, 2118). They were diluted according to the manufacturer’s instructions.
Immunocytochemical Staining
After planting cells at the appropriate density on the culture plate, they were cultured for a certain period of time until adherence to the wall. Subsequently, the cells were fixed with 4% paraformaldehyde (Beyotime, P0099), followed by the addition of a blocking solution. Antibodies included CD68 (abcam, ab213363), CD11c (abcam, ab254183), CD163 (abcam, ab182422) and EVPL (abcam, ab204237). After being washed with PBS, the corresponding secondary antibodies were incubated for 2 h. Finally, the slides were sealed with DAPI containing mounting solution, and pictures were taken with Zeiss.
Cell Treatment and Co-Culture
oe-EVPL and sh-EVPL plasmids (Gene Pharma) were designed and synthesized, Transfection reagents were prepared (Invitrogen, L3000001) and used after 15-minute incubation at room temperature. The cells were pre-treated with an inhibitor targeting the ERK signaling pathway, SCH772984 inhibitor (200 nM) (MedChemExpress, HY-50846).14 Co-cultures were established using Trans-well chambers, as described in the literature. M2 macrophages were inoculated into the upper chamber, while tumor cells were seeded in the lower chamber.15 After a certain period of incubation, migrated cells were fixed with 4% PFA and stained with crystal violet. The floating color was subsequently washed away with clean water, and the recruitment of macrophages was examined under a microscope.
CCK-8 Assay
After treatment, cells were seeded in 96-well plates at appropriate density, and cell proliferation was detected at 24 h, 48 h, 72 h, and 96 h, respectively. A mixture of CCK-8 solution and medium, in a 1: 9 ratio, was added as per the provided instructions. After incubation, the absorbance at 450 nm was measured using an enzyme marker (Thermo Fisher).
Colony Formation Experiment
The agarose gel and medium were mixed in a 1:1 volume ratio and carefully added to a six-well plate. The cells were digested into a single-cell suspension, supplemented with agarose gel and medium mixture, and then added to the aforementioned six-well plate. Following the solidification of the upper layer at room temperature, it was transferred to an incubator for incubation. After 14 days of incubation, the number of cell colonies was counted using crystal violet staining and photographed.16
Trans-Well Experiments
Matrigel was applied to coat the bottom of the Trans-well chambers, followed by incubation at 37 °C within a cell culture incubator. An artificial basement membrane formed by polymerizing Matrigel into a gel. After digestion, the cells were seeded into the Trans-well chamber. Subsequently, following an appropriate incubation period, the remaining cells on the chamber membrane were gently swabbed, fixed with 4% paraformaldehyde, and subsequently photographed and counted after crystal violet staining.
Migration Experiment
A special Transwell chamber (Corning, USA, Cat. No: 3422) was used for performing the scratch test. Following cell digestion, the cell suspension concentration was adjusted, and an appropriate amount of cell suspension was added to the chamber, ensuring complete coverage of cells after overnight culture. The chambers were vertically removed the next day, washed three times with PBS, and then cultured in serum-free medium. Cell migration was assessed by capturing images using a microscope, and the results were counted using Image J.
Flow Cytometry
Cells were digested and collected through centrifugation. Following resuspension with PBS, the cell supernatant was discarded after centrifugation. Annexin V-FITC was added for cell suspension, followed by the addition of another 5 μL of Annexin V-FITC, propidium iodide for light-proof incubation. Then, flow cytometry (Thermo Fisher) was used for detection.
Enzyme-Linked Immunosorbent Assay (ELISA)
We detected the secretion of CXCL5, CCL20, CCL2, IL10, IL-4 and TNF-α. The commercial ELISA kits were purchased from Thermo Fisher, and the procedures were carried out following the provided instructions.
Data Statistics
GraphPad Prism 8.0 was used for data visualization, with results presented as mean ± standard deviation. T test was used for comparisons between two groups, while variance analysis was performed for comparisons involving multiple groups. p<0.05, p<0.01, and p<0.001 were denoted as ** ** * *respectively.
Results
Screening of DEGs
Normal skin samples from GSM71671-GSM71677, benign nevus samples from GSM71678-GSM71695, and melanoma samples from GSM71696-GSM71740 were analyzed. A total of 1082 DEGs were identified between melanoma and normal samples, consisting of 383 up-regulated genes and 699 down-regulated genes (Figure 1A and B). Additionally, 492 DEGs were screened out between melanoma and nevus samples, including 113 up-regulated genes and 379 down-regulated genes (Figure 1C and D). The intersection of the above DEGs revealed a set of 366 co-DEGs (Figure 1E).
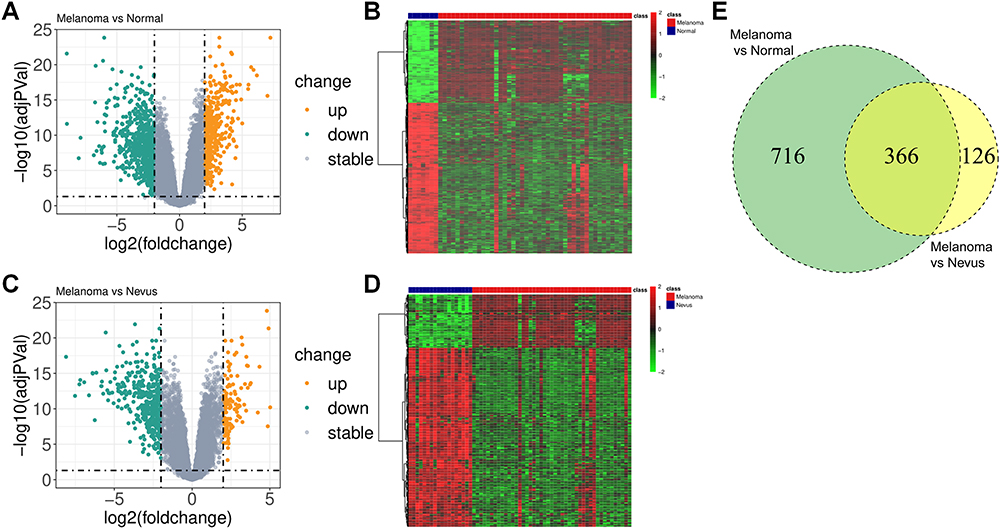 |
Figure 1 Screening of DEGs. (A) Volcano plot of the DEGs between melanoma and normal samples. (B) Heat map of the DEGs between melanoma and normal samples. (C) Volcano plot of the DEGs between melanoma and nevus samples. (D) Heat map of the DEGs between melanoma and nevus samples. (E) Venn diagram of the DEGs. |
Enrichment Analysis of Co-DEGs
GO analysis revealed enrichment of the co-DEGs mainly in cell adhesion, cell periphery and spatially complex binding (Figure 2A-C). KEGG analysis showed that co-DEGs were predominantly closely related to an ECM-receptor interaction (Figure 2D). Reactome analysis illustrated their enrichment in pathways such as Laminin interactions (Figure 2E). Wiki Pathways analysis demonstrated their primary enrichment in pathways including GPR143 in melanocytes and retinal pigment epithelium cells (Figure 2F).
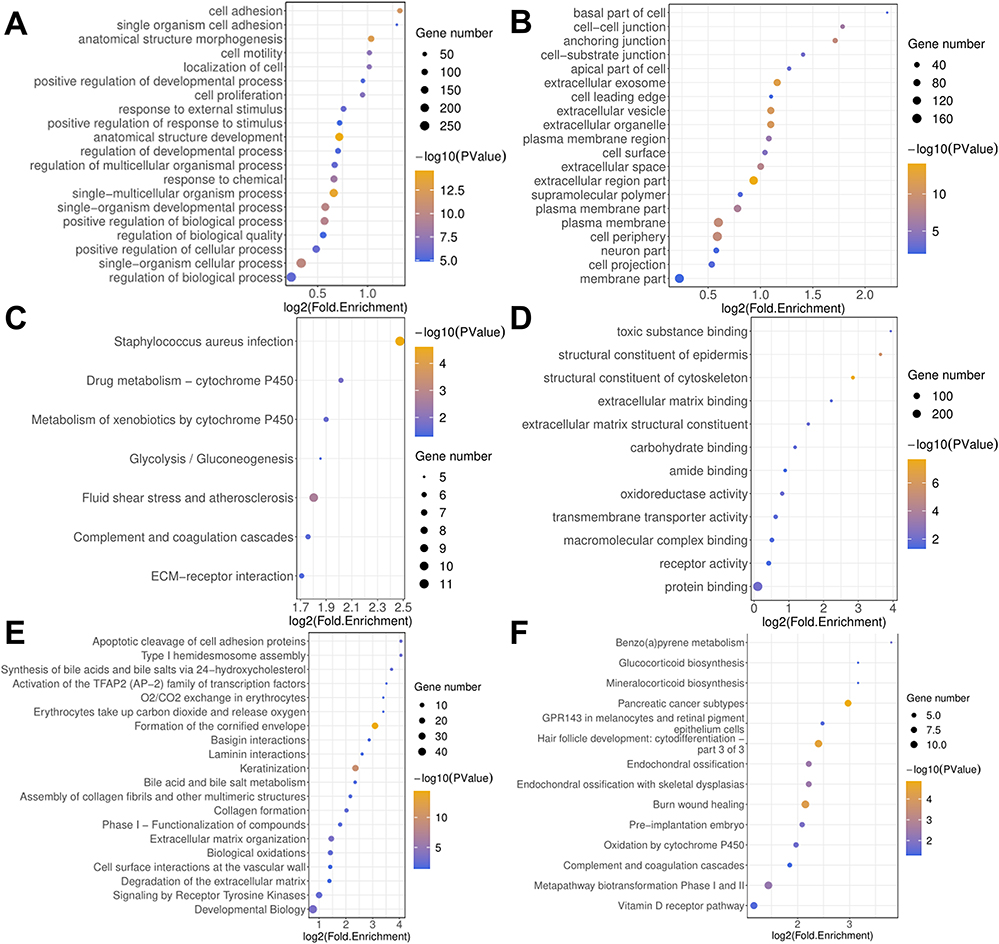 |
Figure 2 Enrichment analysis of co-DEGs. (A) Biological process, BP. (B) Cell component, CC (C) Molecular function, MF (D) KEGG pathway analysis. (E) Reactome pathway analysis (F) Wiki Pathways analysis. |
WGCNA Analysis and Related Key Module Identification
GSE3189 was also included in the analysis. Upon conducting WGCNA, no outlier samples were identified through sample clustering (Figure 3A). According to the clustering results, the soft threshold was selected as 12, the average connectivity approached the minimum value, and the scale-free fitting coefficient was 0.85 (Figure 3B). The merging of modules exhibited similar performance (Figure 3C). Furthermore, the correlation between gene co-expression modules and inflammatory responses was analyzed. Notably, the brown, green, turquoise, and yellow modules showed a significant correlation with inflammatory response (Figure 3D and E).
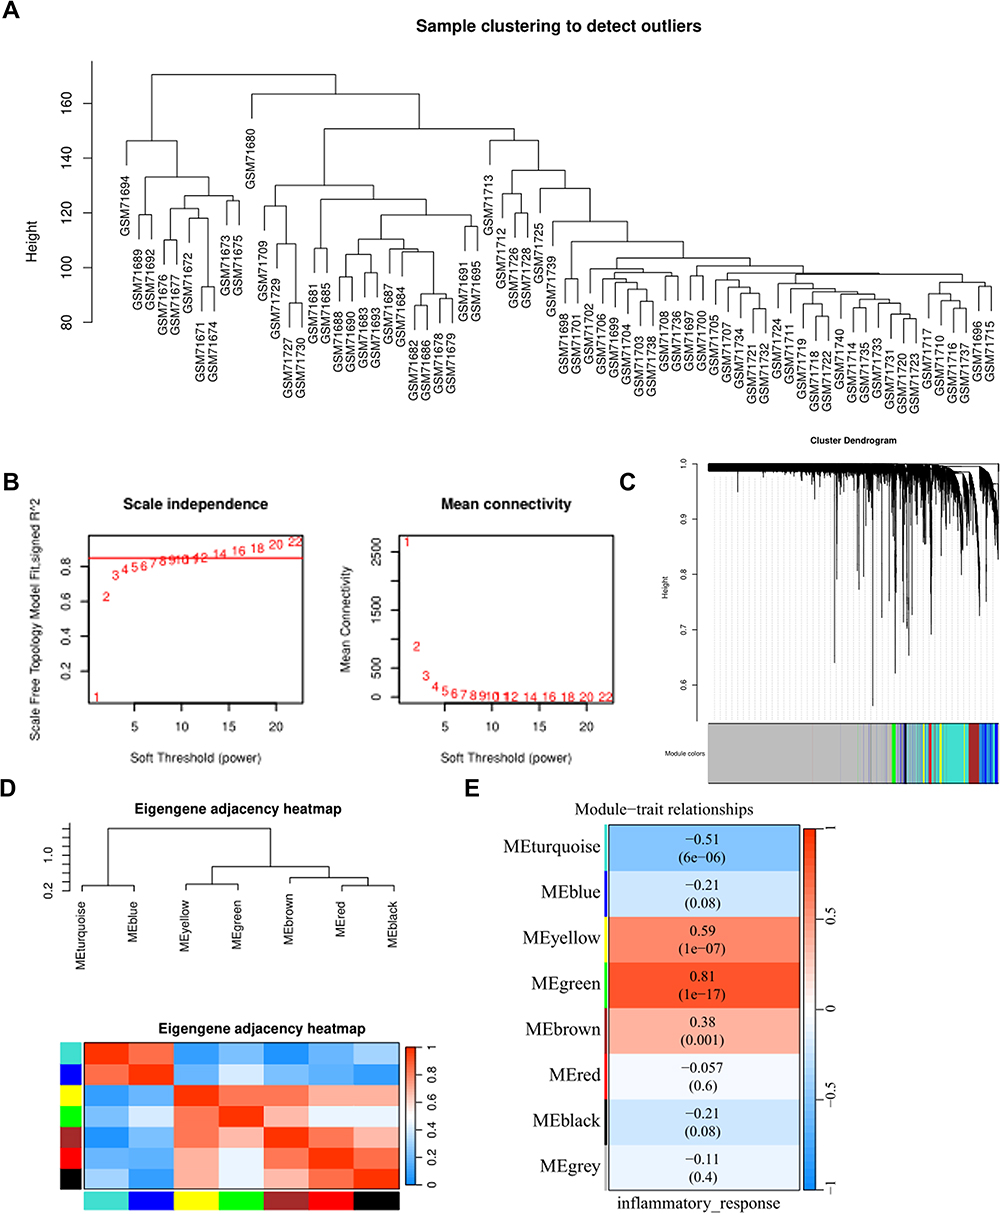 |
Figure 3 Identification of PM melanoma differential gene modules by WGCNA. (A) Dendrogram. (B) Network topology analysis under different soft threshold values; the soft threshold was selected as 12, and the scale-free fitting index R2 was 0.85. (C) Different colors under the gene tree indicate different gene modules. (D) Heat map of feature gene adjacency (E) Heat map of correlation between gene co-expression modules and inflammatory response, with correlation coefficients and p-values shown in each block. |
Screening of WGCNA Key Module Genes
To identify the key genes within the four modules and illustrate the correlation scatter plots of GS and MM, genes with an absolute correlation greater than 0.75 were filtered, consequently identifying 1642 genes with strong correlation (Figure 4A-D). Additionally, a Venn diagram was plotted that overlapped these genes with the co-DEGs, revealing 337 DEGs related to inflammatory (inflammatory -DEGs) (Figure 4E).
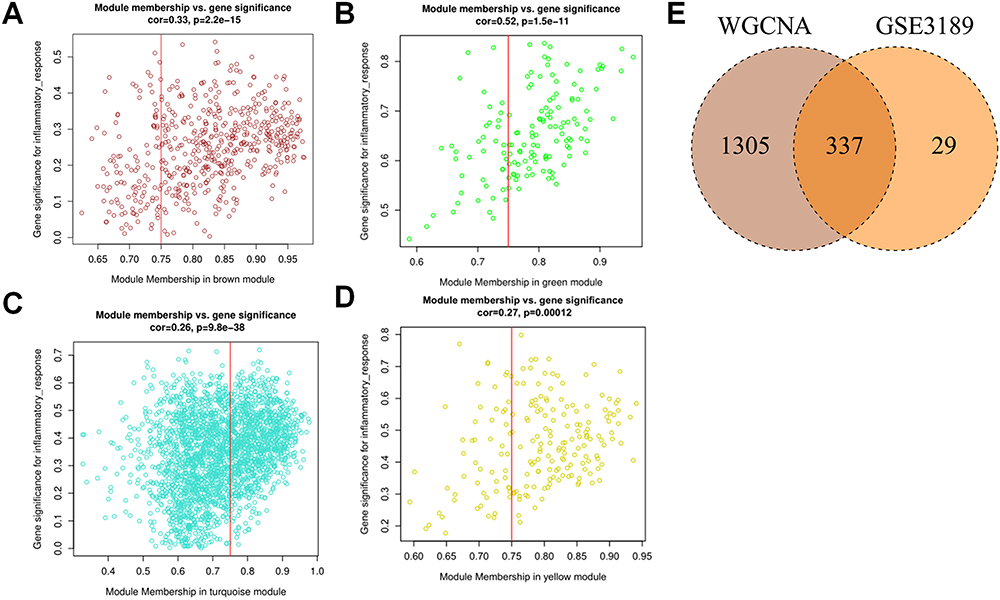 |
Figure 4 Screening of WGCNA key module genes. (A-D) Correlation scatter plots of GS and MM in MEbrown module, MEgreen module, MEturquoise module and MEyellow module. (E) The intersection gene of WGCNA key genes and co-DEGs. |
Construction of PPI Network to Obtain Key Motif Genes
A PPI network was constructed for the inflammatory-DEGs, from which the top three module genes (motif 1–3) were obtained (Figure 5A-D). Motif 1 was mainly enriched in pathways such as cell adhesion, single organism cell adhesion and immune system (Figure 5E). Motif 2 displayed primary enrichment in pathways such as cellular component organization and cell-cell organization (Figure 5F). Motif 3 demonstrated notable enrichment in pathways such as pigmentation and melanin biosynthesis (Figure 5G). Finally, 29 motif genes were obtained.
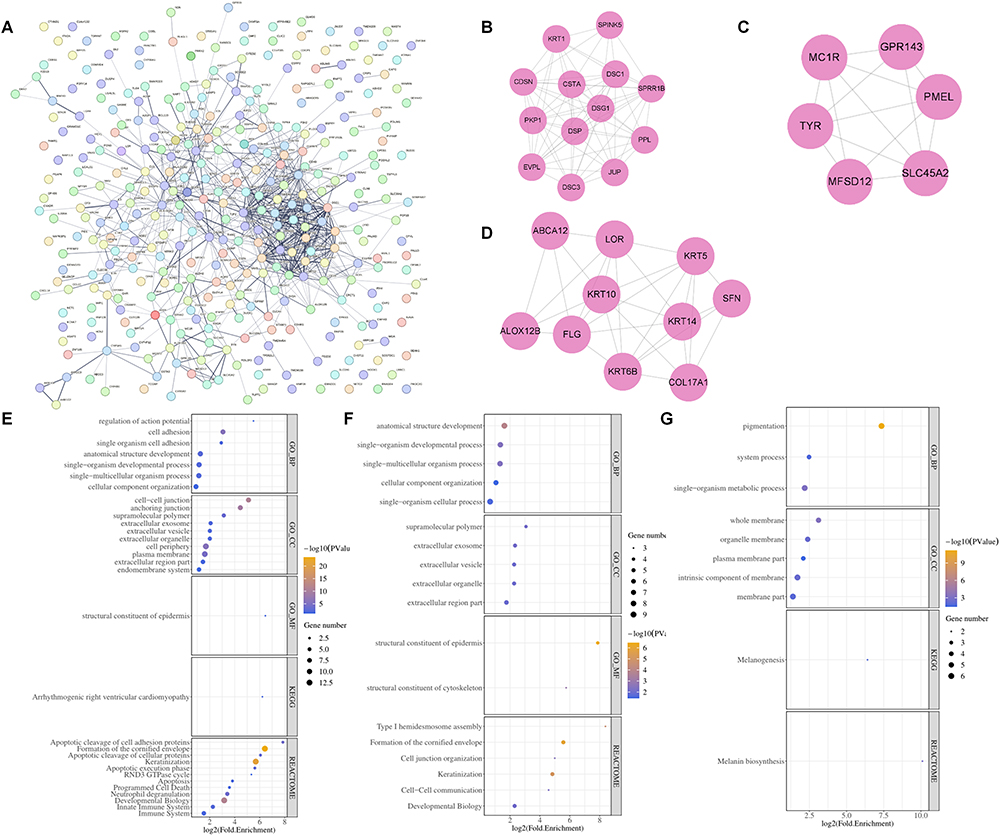 |
Figure 5 PPI network construction to obtain key motifs. (A-D) PPI network was constructed by the STRING software. (E-G) The top three motif gene-related enrichment pathways. |
Immune Correlation Analysis of Motif Genes
To further investigate the differences in the proportion of various immune cells in melanoma inflammatory tumor microenvironment compared to healthy tissue, the cibersortx database was used to estimate the infiltration of 22 types of immune cells in the GSE3189 dataset (Figure 6A). Macrophages M0 had the strongest positive correlation with the inflammatory tumor microenvironment of melanoma, while Macrophages M2 displayed the strongest negative correlation with the inflammatory tumor microenvironment of melanoma (Figure 6B). Additionally, most of these immune cells were correlated with each other (Figure 6C). All 29 motif genes were correlated with both Macrophages M0 and Macrophages M2 (p<0.001) (Figure 6D).
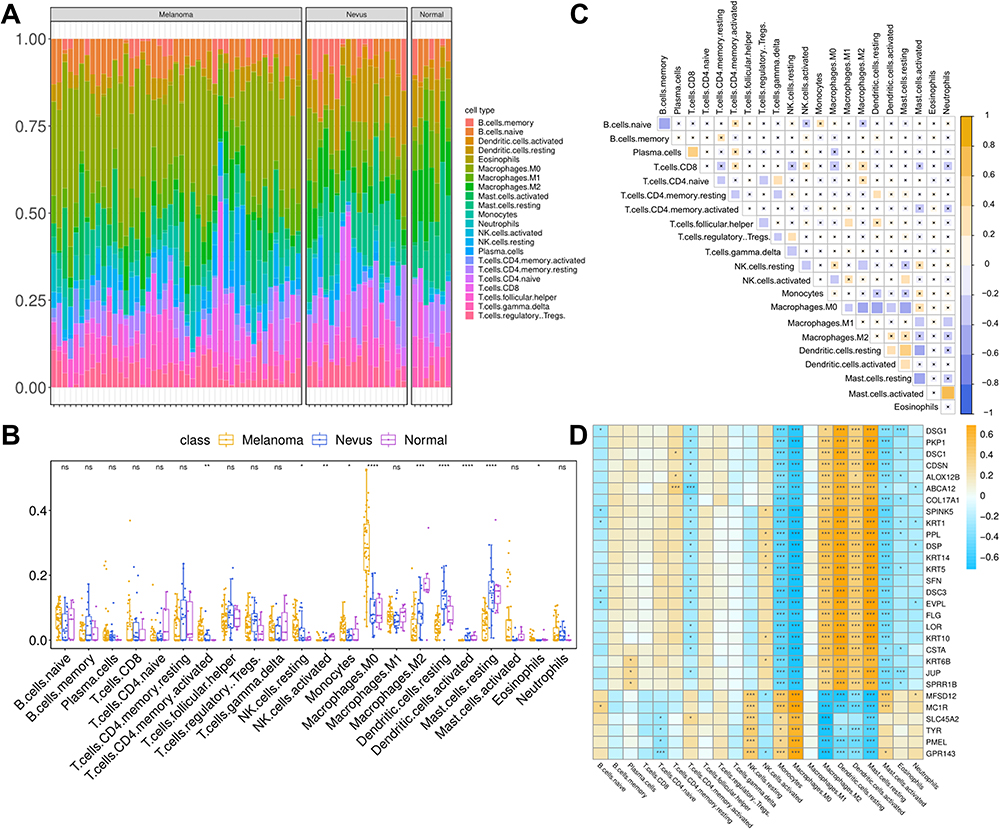 |
Figure 6 Correlation analysis of immune response-related key genes and immune cell infiltration. (A) Cibersort analysis of the GSE3189 dataset. (B) Calculation of the 22 cell infiltration scores of normal, nevus and melanoma samples via ggpubr. (C) Correlation analysis of the 22 immune cells in the GSE3189 dataset. (D) Pearson correlation analysis of the motif genes and the 22 immune cells. n.s. means no significant differences between two groups, * represents P< 0.05, ** represents P<0.01, *** represents P<0.001, **** represents P<0.0001. |
Identification of Hub Genes Associated with Inflammatory Tumor Microenvironment
The TCGA+GTEX dataset of melanoma was used as the validation set. A total of 29 motif genes were screened out using the RF model, with the lowest error rate observed when the number of genes was 29 (Figure 7A and B). 22 feature genes were identified via the SVM-RFE algorithm, with the lowest error rate when the number of feature gene was 22 (Figure 7C and D). Six genes were screened out by LASSO regression (Figure 7E and F). Finally, six hub genes, TYR, KRT10, PMEL, PPL, EVPL, and SPRR1B, were obtained after interesting the genes identified through the above three methods (Figure 7G).
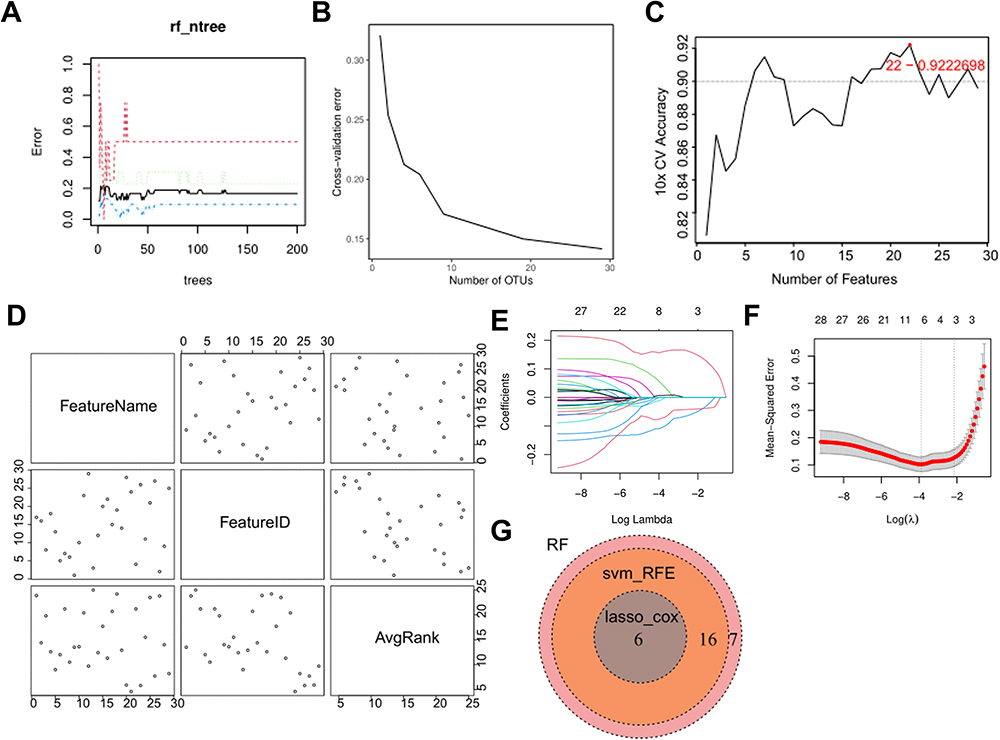 |
Figure 7 Identification of hub genes in the prognostic model. (A) RF model. (B) 10-fold cross-validation with 29 genes showed the lowest error rate. (C) Dynamic changes of error rate in SVM-RFE algorithm when the number of genes was increased. (D) The name, serial number and importance of each gene. (E) Dynamic changes of coefficients following the selection of log (Lambda). (F) LASSO-COX regression. (G) Six intersection genes. |
Validation of Hub Gene Expression
In the GSE3189 dataset, the expression levels of EVPL, KRT10, PPL and SPRRIB were down-regulated in the melanoma group compared to the normal and nevus groups, while the expression levels of PMEL and TYR were up-regulated (Figure 8A). In the TCGA + GTEX dataset, a similar expression pattern was observed, with EVPL, KRT10, PPL and SPRRIB being down-regulated in the cancer group, and PMEL and TYR being up-regulated in the cancer group compared to the normal group (Figure 8B).
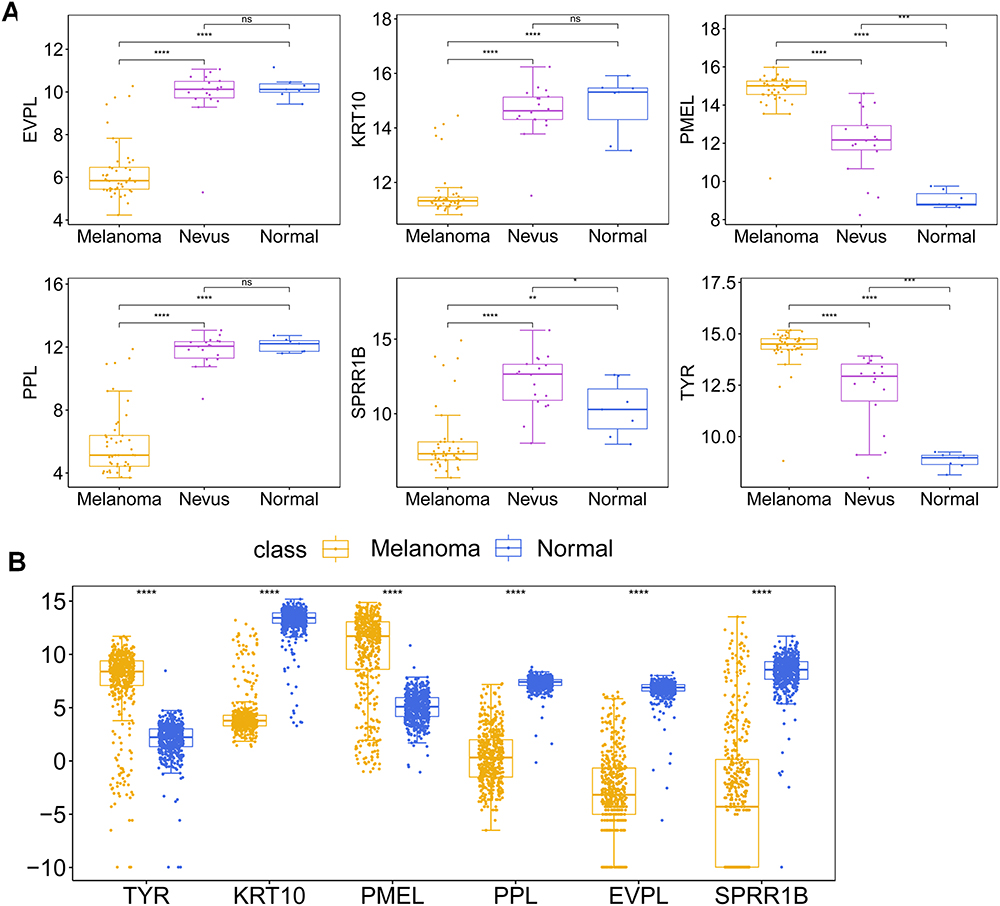 |
Figure 8 Validation of hub gene expression. (A) Box plot of the expression changes of the six hub genes in the normal, nevus and melanoma groups in the GSE3189 dataset. (B) Box plot of the expression changes of the six hub genes in the normal and cancer groups in the TCGA + GTEX dataset. n.s. means no significant differences between two groups, * Represents P< 0.05, ** Represents P<0.01, *** Represents P<0.001, **** Represents P<0.0001. |
Immune Cell Infiltration Analysis of the Hub Genes
The cibersortx database was used to analyze the correlation between the six hub genes and the 22 types of immune cells. EVPL, KRT10 and PPL exhibited significant positive correlations with Macrophages M2 (p<0.001), while demonstrating a significant negative correlation with Macrophages M0 (p<0.001) (Figure 9A-C). Conversely, PMEL and TYR were significantly positively correlated with Macrophages M0 (p<0.001), but significantly negatively correlated with Macrophages M2 (p<0.001) (Figure 9D and E). Furthermore, SPRR1B was positively correlated with Mast cells resting (p<0.001), but negatively correlated with Macrophages M0 (p<0.001) (Figure 9F).
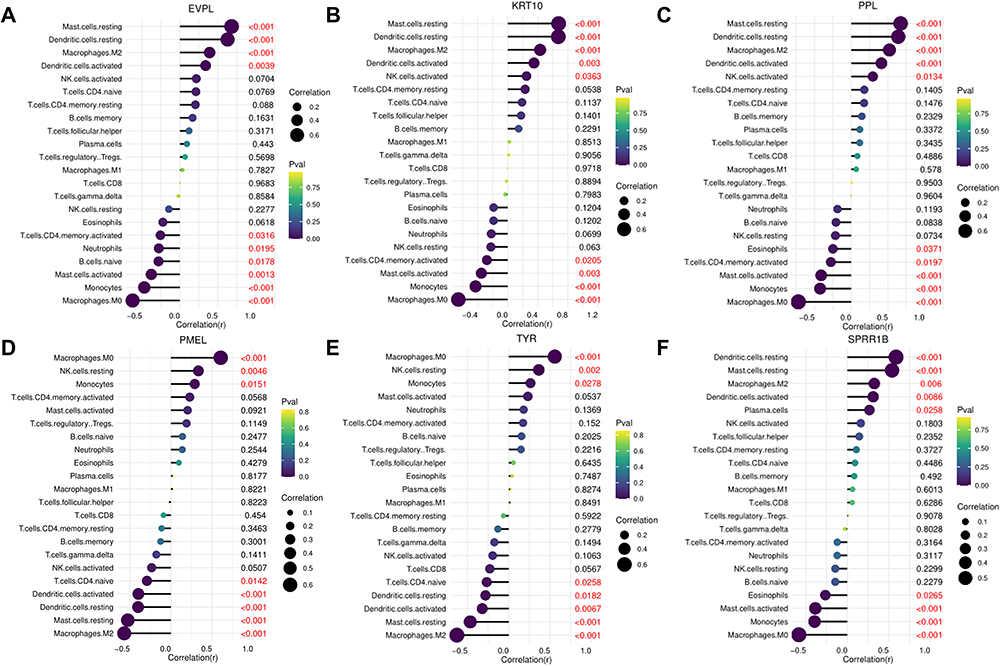 |
Figure 9 Immune cell infiltration analysis of the hub genes. (A-F) Correlation analysis between the six hub genes and the 22 types of immune cells. |
Hub Gene Enrichment Analysis
Single-gene GSEA revealed association of specific hub genes with distinct signaling pathways. As revealed, EVPL was related to the Ras signaling pathway (Figure 10A); KRT10 was related to the Coronavirus-COVID-19 signaling pathway (Figure 10B); PMEL and TYR were associated with the Cytokine receptor interaction signaling pathway (Figure 10C and F); PPL was associated with the Coronavirus disease-COVID-19 signaling pathway (Figure 10D); and SPRR1B was related to the Staphylococcus aureus infection signaling pathway (Figure 10E).
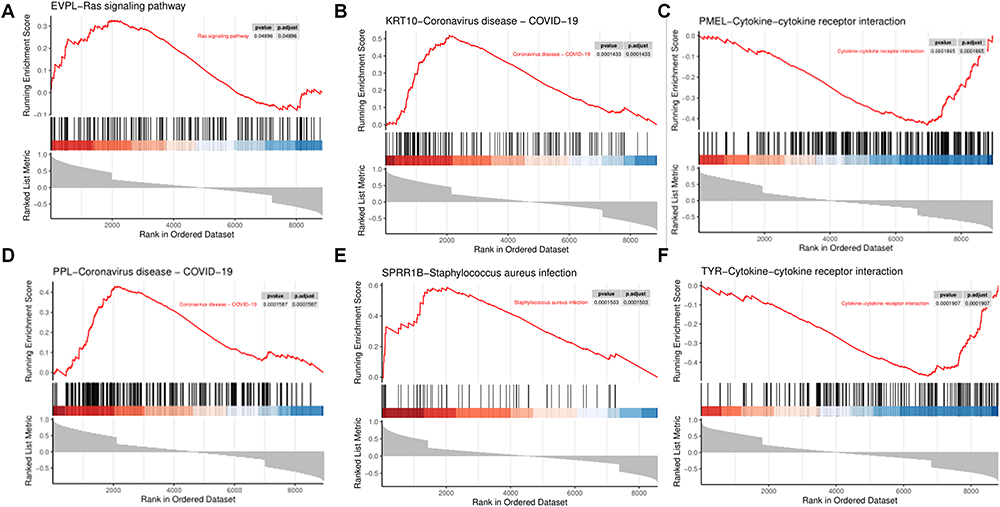 |
Figure 10 Hub gene enrichment analysis. (A-F) Single-gene enrichment analysis of the hub genes. |
EVPL is Lowly Expressed in Melanoma
Studies have highlighted the critical role of the Ras/Raf/ERK signaling in melanoma development.17 In this study, bioinformatics analysis revealed main enrichment of EVPL at the Ras/Raf/ERK pathway. Therefore, EVPL was identified as a key gene regulating the occurrence and development of melanoma, and was thus selected for further investigation. Subsequent analyses involved the assessment of EVPL expression in five cell lines12 through qRT-PCR and Western blot experiments. A noticeable decrease in EVPL expression was observed in A375, A2058, A875 and Sk-Mel-28 cells compared to HaCaT cells. Specifically, A375 and A2058 cell lines exhibited the lowest EVPL expression levels (Figure 11A-C). The results of cell immunofluorescence staining showed reduced EVPL expression in A375 and A2058 cells as compared with HaCaT cells (Figure 11D and E).
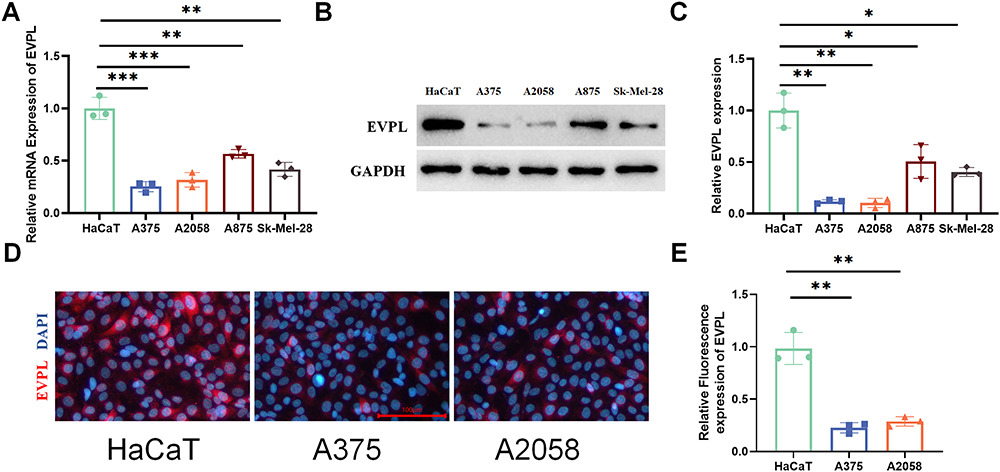 |
Figure 11 EVPL is lowly expressed in melanoma. (A) qRT-PCR analysis of EVPL expression changes in different melanoma cells, n=3. (B and C) The expression of EVPL in different cells detected by Western blotting, n=3. (D and E) The expression of EVPL in different cells detected by cell immunofluorescence staining, with red denoting EVPL, and blue denoting nucleus, n=3. The data in the figures represent the mean±SD. * Represents P< 0.05, ** Represents P<0.01, *** Represents P<0.001. |
EVPL Regulates the Malignant Progression of Melanoma and Its Inflammatory Tumor Microenvironment
In vitro experiments were designed to investigate the biological functions of EVPL and its potential role in regulating the inflammatory tumor microenvironment. Following EVPL plasmid transfection in A375 and A2058 cells, the oe-EVPL group showed highly expressed EVPL compared with oe-NC (Figure 12A). The results of CCK-8 and colony formation experiments showed that overexpression of EVPL in A375 and in A2058 cells led to a marked inhibition of cell viability (Figure 12B-D). Wound-healing and Trans-well assays revealed that EVPL overexpression inhibited cell invasion and migration (Figure 12E-H). Flow cytometry results indicated that EVPL overexpression promoted apoptosis (Figure 12I and J). ELISA results illustrated that EVPL overexpression down-regulated the expression of tumor immune-related chemokines, including CXCL5, CCL20, CCL2, IL-10, IL-4 and TNF-α (Figure 12K and L). Based on the aforementioned results, we propose that overexpression of EVPL inhibits the malignant progression of melanoma cells in vitro, and regulates the inflammatory tumor microenvironment of melanoma.
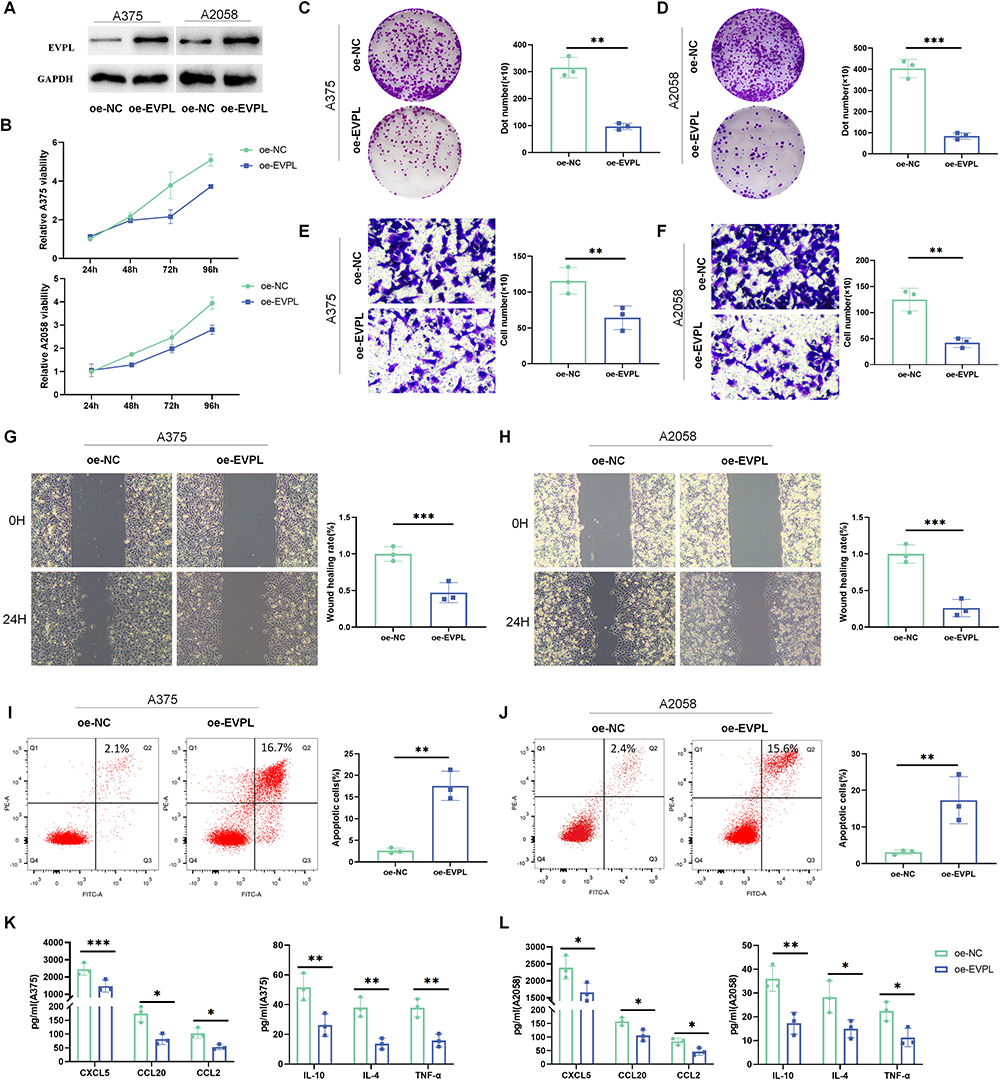 |
Figure 12 EVPL regulates the malignant progression of melanoma and the inflammatory tumor microenvironment of melanoma. (A) Expression changes of EVPL were detected by Western blot, n=3. (B) CCK-8 assay was used to detect the viability of A375 and A2058 cells, n = 3. (C and D) Colony formation assay was used to detect the proliferation of A375 and A2058 cells, n=3. (E and F) Trans-well invasion assay was used to detect the invasion of A375 and A2058 cells, n = 3. (G and H) Wound-healing assay was used to detect the migration of A375 and A2058 cells, n=3. (I and J) Flow cytometry was used to detect the apoptosis rate of A375 and A2058 cells, n=3. (K and L) ELISA was used to detect the expression of tumor immune-related chemokines and inflammatory factors in the cell supernatant, n=3. The data in the figures represent the mean±SD. * Represents P< 0.05, ** Represents P<0.01, *** Represents P<0.001. |
EVPL Inhibits Macrophage Recruitment by Regulating the Inflammatory Tumor Microenvironment of Melanoma
To investigate the impact of EVPL on macrophage polarization and recruitment within the inflammatory tumor microenvironment, an in vitro co-culture model was constructed.5 Trans-well assay results showed that oe-EVPL effectively reduced the recruitment of macrophages compared with the oe-NC group (Figure 13A). qRT-PCR results demonstrated an increase in the expression of M1 macrophage markers (IL-1b and CD11c) and a decrease in the expression of M2 macrophage markers (CD163 and IL-10) in the oe-EVPL group (Figure 13B). Flow cytometry analyses revealed that CD68/CD11c was increased and CD68/CD163 was decreased (Figure 13C). Immunofluorescence staining showed that, compared with the oe-NC group, the oe-EVPL group demonstrated reduced expression of M2 polarization marker CD68/CD163 and increased expression of M1 polarization marker CD68/CD11c (Figure 13D and E).
 |
Figure 13 EVPL inhibits macrophage recruitment by regulating the inflammatory tumor microenvironment of melanoma. (A) Trans-well assay was used to detect the recruitment of EVPL overexpression to macrophages, n=3. (B) The expression changes of M1 and M2 macrophage markers were detected by qRT-PCR, n=3. (C) Flow cytometry was used to detect the expression of CD68, CD11c and CD163, n=3. (D and E) Immunofluorescence staining was used to detect the expression changes of CD68, CD163 and CD11c, n=3. The data in the figures represent the mean±SD. * Represents P< 0.05, **Represents P<0.01, ***Represents P<0.001. |
EVPL affects the inflammatory tumor microenvironment and macrophage recruitment in melanoma through the RAS/ERK signaling pathway.
Compared with oe-NC, oe-EVPL down-regulated p-ERK1/2/ERK1/2, with a concomitant decrease in Ras and Raf protein expression (Figure 14A). Transfection with sh-EVPL revealed that inhibition of EVPL expression led to the activation of p-ERK1/2 in the signaling pathway (Figure 14B). To further elucidate the underlying mechanism of EVPL in regulating the inflammatory tumor microenvironment of melanoma, we introduced SCH772984 to study the changes of EVPL-related pathways. In comparison to the Control group, the SCH772984 group inhibited the development of melanoma. In contrast, when compared with the SCH772984 + sh-NC group, the SCH772984 + sh-EVPL group promoted tumor cell proliferation, migration and invasion (Figure 14C-G). Compared with the Control group, the addition of SCH772984 inhibited the expression of chemokines, while the expression of chemokines increased when sh-EVPL was transfected simultaneously with the addition of SCH772984 (Figure 14H).
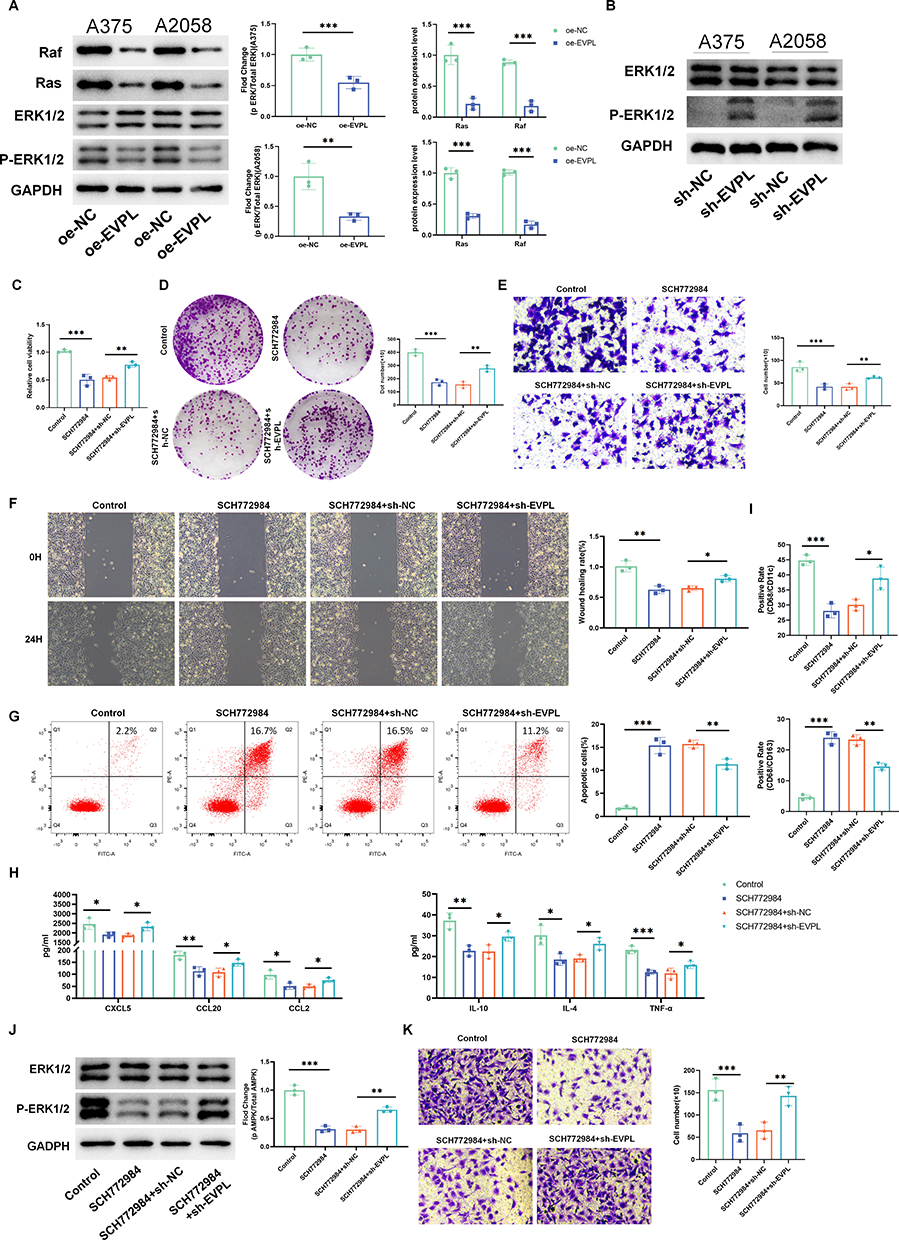 |
Figure 14 EVPL affects the inflammatory tumor microenvironment and macrophage recruitment of melanoma through the RAS / ERK signaling pathway. (A) Raf, Ras, p-ERK1/2 and ERK1/2 were detected by Western blot, n=3. (B) Expression changes of p-ERK1/2 was detected by Western blot, n=3. (C) Cell viability was detected by CCK-8 assay, n=3. (D) Degree of cell proliferation measured by colony formation assay, n=3. (E) Trans-well assay was used to detect cell invasion, n=3. (F) Wound healing assay to detect cell migration, n=3. (G) Cell apoptosis rate was detected by flow cytometry, n=3. (H) Expression changes of tumor immune-related chemokines detected by ELISA, n=3. (I) The proportion of M1 and M2 phenotype macrophages was detected by flow cytometry, n=3. (J) Expression changes of p-ERK were detected by Western blot, n=3. (K) Trans-well co-culture system to detect macrophage recruitment, n=3. The data in the figures represent the mean±SD. *Represents P< 0.05, **Represents P<0.01, ***Represents P<0.001. |
Flow cytometry results showed that the SCH772984 group had increased M1-type and decreased M2-type macrophages compared to the Control group. Conversely, the SCH772984 group showed decreased M1-type and increased M2-type macrophages when compared to the SCH772984 + sh-EVPL group (Figure 14I). Similarly, due to the addition of SCH772984, the Ras/Raf / ERK signaling pathway was inhibited, leading to a decrease in the p-ERK1/2. Simultaneous transfection of sh-EVPL with SCH772984 increased the p-ERK1/2 compared to the addition of SCH772984 alone (Figure 14J). In the co-culture model, the addition of SCH772984 inhibited macrophage recruitment compared with the Control group, and the number of macrophages increased in the SCH772984 group compared with the SCH772984+sh-EVPL group (Figure 14K). Thus, we propose that EVPL affects the inflammatory tumor microenvironment of melanoma through the Ras/ERK signaling pathway.
Discussion
Melanoma is a highly aggressive skin cancer. Nonetheless, the prognosis of patients, commonly determined by prognostic indicators such as tumor thickness and infiltration degree, remains uncertain due to the potential risks of progression and metastasis, thus complicating the cure of melanoma.16 As is known, elucidating the interaction between chronic inflammation and tumor microenvironment is of paramount significance.18 The tumor microenvironment hosts a diverse array of inflammatory and immune cells, including T lymphocytes, natural killer cells, monocytes, and macrophages.19 Such inflammatory tumor immune microenvironment plays a vital role in tumor progression, with tumor cells releasing various cytokines and chemokines to regulate the immune microenvironment.20
Based on the comprehensive analysis of the GEO dataset and the four key modules related to melanoma and immune response in WGCNA, we screened out six hub genes (EVPL, KRT10, PPL, SPRRIB, PMEL and TYR) that are most relevant to melanoma by combining immune infiltration analysis and machine learning. Notably, previous research has associated EVPL mutations with the occurrence and development of sporadic esophageal squamous cell carcinoma.21 The Ras/Raf/MEK/ERK signaling pathway is frequently activated in cutaneous melanomas, which is involved in the progression of melanoma.17 Prior studies have suggested EVPL’s potential as a prognostic marker for melanoma.11 This study, for the first time, uncovers EVPL’s role as a tumor suppressor by activating the Ras/Raf/ERK signaling pathway through single gene enrichment. A series of in vitro cell function experiments demonstrated EVPL’s capacity to inhibit the malignant progression of melanoma, alter the expression of chemokines, and ultimately induce changes in the inflammatory tumor microenvironment. The above compelling evidence suggests that EVPL may effectively change the inflammatory tumor microenvironment in melanoma.
EVPL, a member of the plakin protein family, has been the subject of investigation in studies related to skin-blistering diseases.22 Typically expressed in skin and other epithelial tissues, EVPL plays a vital role in maintaining the structure and stability of glial cells.23,24 EVPL has shown association with chronic inflammation and immune responses, notably with CD4 T cell infiltration in the dermatitis studies,25 indicating its potential role in regulating skin inflammation through immune regulation.26 A diverse array of cytokines, growth factors, chemokines and inflammatory mediators can be secreted in the tumor microenvironment to promote tumor immunosuppression and accelerate tumor progression.27 In this study, a correlation was observed between EVPL and the infiltration of Macrophages, Mast cells resting, and Dendritic cells resting. Macrophages are a type of plastic cells that can be influenced by chemokines and cell-cell interactions within the tumor microenvironment, enabling them to exert either anti-tumor or tumor-promoting activities.28 Macrophages are key cells involved in melanoma progression,29 and are essential for immune response.30 Our findings suggest that overexpression of EVPL regulates macrophage recruitment and polarization by regulating chemokines and inflammatory factors in the inflammatory tumor microenvironment in vitro.
In summary, our findings collectively demonstrate that EVPL inhibits melanoma cell proliferation, migration and invasion, and also regulates macrophage polarization by altering the inflammatory tumor microenvironment. Nevertheless, it’s essential to acknowledge the limitations of this study. Although the in vitro experiments in this study aim to simulate the real physiological conditions, the validation of our conclusions warrants further in vivo investigations. Our subsequent investigations will incorporate the design of in vivo experiments to prove the robustness of our research findings.
Abbreviations
WGCNA, weighted co-expression network analysis; PPI, protein-protein interaction; EVPL, Envoplakin; DEGs, differentially expressed genes; GO, Gene Ontology; KEGG, Kyoto Encyclopedia of Genes and Genomes; GS, Gene significance; MM, module membership; RF, Random Forest; SVM-RFE, Support Vector Machine Recursive Feature Elimination.
Data Sharing Statement
Data can be obtained from the corresponding author on a reasonable request.
Ethics Approval
Based on our local norms, this study is exempt from approval from the Institutional Review Board (IRB) or local ethics review board, for there was no conduction of human experiments in this study, and the data analyzed were obtained from publicly available datasets.
Author Contributions
All authors made a significant contribution to the work reported, whether that is in the conception, study design, execution, acquisition of data, analysis and interpretation, or in all these areas; took part in drafting, revising or critically reviewing the article; gave final approval of the version to be published; have agreed on the journal to which the article has been submitted; and agree to be accountable for all aspects of the work.
Funding
There is no funding to report.
Disclosure
The authors declared no competing interests in this work.
References
1. Mao L, Qi Z, Zhang L, Guo J, Si L. Immunotherapy in Acral and Mucosal Melanoma: current Status and Future Directions. Front Immunol. 2021;12:680407. doi:10.3389/fimmu.2021.680407
2. Akbani R, Akdemir K, Aksoy B. Genomic Classification of Cutaneous Melanoma. Cell. 2015;161(7):1681–1696. doi:10.1016/j.cell.2015.05.044
3. McKean MA, Amaria RN. Multidisciplinary treatment strategies in high-risk resectable melanoma: role of adjuvant and neoadjuvant therapy. Cancer Treat Rev. 2018;70:144–153. doi:10.1016/j.ctrv.2018.08.011
4. Chambers AF, Groom AC, MacDonald IC. Dissemination and growth of cancer cells in metastatic sites. Nat Rev Cancer. 2002;2(8):563–572. doi:10.1038/nrc865
5. Liu L, Zhou X, Cheng S, et al. RNA-binding protein DHX9 promotes glioma growth and tumor-associated macrophages infiltration via TCF12. CNS Neurosci Ther. 2023;29(4):988–999. doi:10.1111/cns.14031
6. Gajewski TF, Schreiber H, Fu YX. Innate and adaptive immune cells in the tumor microenvironment. Nat Immunol. 2013;14(10):1014–1022. doi:10.1038/ni.2703
7. Xu F, Cui WQ, Wei Y, et al. Astragaloside IV inhibits lung cancer progression and metastasis by modulating macrophage polarization through AMPK signaling. J Exp Clin Cancer Res. 2018;37(1):207. doi:10.1186/s13046-018-0878-0
8. Iwaya T, Maesawa C, Kimura T, et al. Infrequent mutation of the human envoplakin gene is closely linked to the tylosis oesophageal cancer locus in sporadic oesophageal squamous cell carcinomas. Oncol Rep. 2005;13(4):703–707.
9. Zhao Q, Zhang Y, Zhang X, Sun Y, Lin Z. Mining of gene modules and identification of key genes in head and neck squamous cell carcinoma based on gene co-expression network analysis. Medicine. 2020;99(49):e22655. doi:10.1097/MD.0000000000022655
10. Li K, Guo S, Tong S, et al. Identification of Keratinocyte Differentiation-Involved Genes for Metastatic Melanoma by Gene Expression Profiles. Comput Math Methods Med. 2021;2021:9652768. doi:10.1155/2021/9652768
11. Sheng Z, Han W, Huang B, Shen G. Screening and identification of potential prognostic biomarkers in metastatic skin cutaneous melanoma by bioinformatics analysis. J Cell & Mol Med. 2020;24(19):11613–11618. doi:10.1111/jcmm.15822
12. Wei CY, Zhu MX, Lu NH, et al. Circular RNA circ_0020710 drives tumor progression and immune evasion by regulating the miR-370-3p/CXCL12 axis in melanoma. Mol Cancer. 2020;19(1):84. doi:10.1186/s12943-020-01191-9
13. Wu Z, Bai X, Lu Z, Liu S, Jiang H. LINC01094/SPI1/CCL7 Axis Promotes Macrophage Accumulation in Lung Adenocarcinoma and Tumor Cell Dissemination. J Immunol Res. 2022;2022:6450721. doi:10.1155/2022/6450721
14. Qi Y, Zou H, Zhao X, et al. Inhibition of colon cancer K-Ras(G13D) mutation reduces cancer cell proliferation but promotes stemness and inflammation via RAS/ERK pathway. Front Pharmacol. 2022;13:996053. doi:10.3389/fphar.2022.996053
15. Mu X, Shi W, Xu Y, et al. Tumor-derived lactate induces M2 macrophage polarization via the activation of the ERK/STAT3 signaling pathway in breast cancer. Cell Cycle. 2018;17(4):428–438. doi:10.1080/15384101.2018.1444305
16. Haass NK, Smalley KS. Melanoma biomarkers: current status and utility in diagnosis, prognosis, and response to therapy. Molecular Diagnosis & Therapy. 2009;13(5):283–296. doi:10.1007/BF03256334
17. Riverso M, Montagnani V, Stecca B. KLF4 is regulated by RAS/RAF/MEK/ERK signaling through E2F1 and promotes melanoma cell growth. Oncogene. 2017;36(23):3322–3333. doi:10.1038/onc.2016.481
18. Rihawi K, Ricci AD, Rizzo A, et al. Tumor-Associated Macrophages and Inflammatory Microenvironment in Gastric Cancer: novel Translational Implications. Int J Mol Sci. 2021;22(8):3805. doi:10.3390/ijms22083805
19. Khandia R, Munjal A. Interplay between inflammation and cancer. Adv Protein Chem Structural Biol. 2020;119:199–245.
20. Qin R, Ren W, Ya G, et al. Role of chemokines in the crosstalk between tumor and tumor-associated macrophages. Clin Exp Med. 2023;23(5):1359–1373. doi:10.1007/s10238-022-00888-z
21. Risk JM, Ruhrberg C, Hennies H, et al. Envoplakin, a possible candidate gene for focal NEPPK/esophageal cancer (TOC): the integration of genetic and physical maps of the TOC region on 17q25. Genomics. 1999;59(2):234–242. doi:10.1006/geno.1999.5857
22. Wesley T, Berzins S, Kannourakis G, Ahmed N. The attributes of plakins in cancer and disease: perspectives on ovarian cancer progression, chemoresistance and recurrence. Cell commun signaling. 2021;19(1):55. doi:10.1186/s12964-021-00726-x
23. Määttä A, Ruhrberg C, Watt FM. Structure and regulation of the envoplakin gene. J Biol Chem. 2000;275(26):19857–19865. doi:10.1074/jbc.M001028200
24. DiColandrea T, Karashima T, Määttä A, Watt FM. Subcellular distribution of envoplakin and periplakin: insights into their role as precursors of the epidermal cornified envelope. J Cell Biol. 2000;151(3):573–586. doi:10.1083/jcb.151.3.573
25. Vorn R, Edwards KA, Hentig J, et al. A Pilot Study of Whole-Blood Transcriptomic Analysis to Identify Genes Associated with Repetitive Low-Level Blast Exposure in Career Breachers. Biomedicines. 2022;10(3):690. doi:10.3390/biomedicines10030690
26. Huang P, Tang L, Zhang L, et al. Identification of Biomarkers Associated With CD4(+) T-Cell Infiltration With Gene Coexpression Network in Dermatomyositis. Front Immunol. 2022;13:854848. doi:10.3389/fimmu.2022.854848
27. Cassetta L, Pollard JW. Targeting macrophages: therapeutic approaches in cancer. Nat Rev Drug Discov. 2018;17(12):887–904. doi:10.1038/nrd.2018.169
28. Wang H, Yang L, Wang D, Zhang Q, Zhang L. Pro-tumor activities of macrophages in the progression of melanoma. Hum Vaccines Immunother. 2017;13(7):1556–1562. doi:10.1080/21645515.2017.1312043
29. Bardi GT, Smith MA, Hood JL. Melanoma exosomes promote mixed M1 and M2 macrophage polarization. Cytokine. 2018;105:63–72. doi:10.1016/j.cyto.2018.02.002
30. Shamaei M, Mirsaeidi M. Nontuberculous Mycobacteria, Macrophages, and Host Innate Immune Response. Infect Immun. 2021;89(8):e0081220. doi:10.1128/IAI.00812-20
 © 2024 The Author(s). This work is published and licensed by Dove Medical Press Limited. The full terms of this license are available at https://www.dovepress.com/terms.php and incorporate the Creative Commons Attribution - Non Commercial (unported, v3.0) License.
By accessing the work you hereby accept the Terms. Non-commercial uses of the work are permitted without any further permission from Dove Medical Press Limited, provided the work is properly attributed. For permission for commercial use of this work, please see paragraphs 4.2 and 5 of our Terms.
© 2024 The Author(s). This work is published and licensed by Dove Medical Press Limited. The full terms of this license are available at https://www.dovepress.com/terms.php and incorporate the Creative Commons Attribution - Non Commercial (unported, v3.0) License.
By accessing the work you hereby accept the Terms. Non-commercial uses of the work are permitted without any further permission from Dove Medical Press Limited, provided the work is properly attributed. For permission for commercial use of this work, please see paragraphs 4.2 and 5 of our Terms.