")
Back to Journals » Infection and Drug Resistance » Volume 17
Comparison of Computed Tomography and Clinical Features Between Patients Infected with the SARS‐CoV‐2 Omicron Variant and the Original Strain
Authors Zhang Y, Li Q, Xiang JL, Li XH, Li J
Received 2 December 2023
Accepted for publication 20 February 2024
Published 5 March 2024 Volume 2024:17 Pages 807—818
DOI https://doi.org/10.2147/IDR.S448713
Checked for plagiarism Yes
Review by Single anonymous peer review
Peer reviewer comments 2
Editor who approved publication: Prof. Dr. Héctor Mora-Montes
Yue Zhang,1,* Qi Li,1,* Jiang-Lin Xiang,2 Xing-Hua Li,1 Jing Li3
1Department of Radiology, the First Affiliated Hospital of Chongqing Medical University, Chongqing, 400016, People’s Republic of China; 2Department of Infectious Disease, Chongqing University Three Gorges Hospital, Chongqing, 404000, People’s Republic of China; 3Medical Department, Liangjiang New Area Renhe Community Health Service Center, Chongqing, 401147, People’s Republic of China
*These authors contributed equally to this work
Correspondence: Jing Li, Medical Department, Liangjiang New Area Renhe Community Health Service center, Chongqing, 401147, People’s Republic of China, Tel +86 18716469389, Email [email protected] Xing-Hua Li, Tel +86 18584603726, Email [email protected]
Purpose: To investigate potential differences in clinical and computed tomography (CT) features between patients with the SARS‐CoV‐2 Omicron variant and the original strain.
Patients and Methods: This retrospective study included 69 hospitalized patients infected with Omicron variant from November to December 2022, and 96 hospitalized patients infected with the original strain from February to March 2020 in Chongqing, China. The clinical features, CT manifestations, degrees of lung involvement in different stages on CT, and imaging changes after the reverse-transcription polymerase chain reaction (RT-PCR) results turned negative were compared between the two groups.
Results: For clinical features, patients with Omicron were predominantly old people and females, without manifestation of any clinical symptoms, who had low serum levels of C-reactive protein and procalcitonin. Shorter interval from symptoms onset to initial CT scan was observed in Omicron patients compared to patients with the original strain (all P < 0.05). For CT features, patients with Omicron were more likely to present with round-like opacities and tree-in-bud pattern (all P < 0.05), but less likely to exhibit a diffuse distribution, patchy and linear opacities, as well as vascular enlargement pattern (all P < 0.05). The Omicron group was more susceptible to exhibiting lower CT involvement scores in each stage (all P < 0.05) and imaging progression after the RT-PCR results turned negative (P < 0.001).
Conclusion: Patients infected with the Omicron variant exhibited less severe changes on chest CT compared to those infected with the original strain. Furthermore, imaging progression under low viral load conditions was more common in patients with Omicron than in those with the original strain.
Keywords: severe acute respiratory syndrome coronavirus-2, pneumonia, computed tomography
Introduction
Since December 2019, many cases of unknown pneumonia have been reported in China, which were primarily caused by a novel coronavirus designated by the International Committee on Taxonomy of Viruses as severe acute respiratory syndrome coronavirus 2 (SARS-CoV-2). SARS-CoV-2, which is the seventh family member in the β-coronaviruses, was found to induce dyspnea in more than half of the patients infected with the disease, subsequently progressing to the development of acute respiratory distress syndrome or even multiple-organ failure, leading to death.1 The original strain mutations during viral replication and also many other variants had been previously reported during the pandemic worldwide. Among them, the Omicron variant has attracted significant attention due to its high transmissibility and prevalence in most countries by 2022.2 A previous study demonstrated that patients infected with the Omicron variant had lower hospitalization rates and less severe symptoms than those infected with other strains.3 The original SARS-CoV-2 and the Omicron variant were the two most prevalent strains in China, a fact which triggered researchers to observe certain significant differences between these two strains in clinical settings. A few studies have compared the clinical and imaging characteristics between Omicron and the original strains;4,5 however, some differential features have not yet been comprehensively established. For example, an interesting phenomenon of imaging progression after the reverse transcription polymerase chain reaction (RT-PCR) results turned negative was frequently observed in patients with Omicron in clinical practice. Therefore, the present study aimed to further explore the differences in clinical and computed tomography (CT) characteristics between the Omicron and the original strains.
Materials and Methods
Patients
We retrospectively collected data from 96 patients infected with the original strain, who were admitted to a large referral center from February to March 2020, and 69 patients infected with the Omicron variant, who were admitted to the same center from November to December 2022, respectively. The inclusion criteria were as follows: 1) patients were diagnosed with a positive test for SARS-CoV-2 using pharyngeal swabs and were not infected with other viral types of pneumonia; 2) patients received regular nucleic acid testing for SARS-CoV-2 per 1–3 days during hospitalization; 3) patients underwent chest CT scans within 24 h before or after admission. The exclusion criteria were as follows: 1) patients had negative findings on initial CT; 2) patients had poor quality images due to obvious respiratory motion artifacts. This study was conducted according to the principles of the Declaration of Helsinki. It was approved by the Ethics Committee of Chongqing University Three Gorges Hospital, and informed consent was obtained from all individual participants included in the present study.
Computed Tomography Protocols
All chest CT scans were unenhanced and followed standard protocols in our center. CT scans of patients with the original strain were performed using an Emotion 16 scanner (Siemens Healthcare), while those of patients with Omicron were performed using a uCT960+ scanner (United Imaging Healthcare). All patients were examined in the supine position. The scanning parameters were as follows: tube voltage, 110–120 kVp; tube current, 50–250 mAs (automatic tube current modulation technology); scanning slice thickness/interval, 5 mm/5 mm. Images were reconstructed with a thickness of 1 mm.
Computed Tomography Image Analysis
The following features of initial CT scans after symptom onset were analyzed and recorded: 1) lobar involvement: single lobe or multiple lobes; 2) distribution: peripheral, central, or diffuse; 3) density of lesions: only ground-glass opacity (GGO), mixed GGO, or only consolidation; 4) morphology: round-like, patchy, or linear opacities; 5) crazy-paving pattern: thickened interlobular septa and intralobular lines with superimposition on a GGO background, resembling irregular paving stones; 6) vascular enlargement pattern: increased vascular diameter compared with other vessels of the same grade in identical or other lung lobes, or compared with the same vessel on follow-up CT images; 7) bronchodilation; 8) interlobular septal thickening; 9) tree-in-bud pattern: centrilobular branching structures resembling a budding tree; 10) pleural effusion; 11) thoracic lymphadenopathy: mediastinal or hilar lymphadenopathy greater than 10 mm in the short axis; 12) classification of CT appearances: all CT images were divided into three categories according to radiological society of North America (RSNA) Expert Consensus:6 typical appearance, indeterminate appearance, and atypical appearance (Table S1); 13) evaluation of CT involvement score: a semi-quantitative scoring method was used to assess the extent of lung involvement, and the scoring criteria were as follows: each lung lobe was scored on a scale of 0–5, where 0, 1, 2, 3, 4, and 5 represented no involvement, less than 5% involvement, less than 25% involvement, less than 50%, less than 75% involvement, and more than 75% involvement, respectively.7 The total CT scores were obtained by adding the scores of individual lobes, which may range between 0 and 25. Imaging progression was defined as an increase in the total involvement score in follow-up CT compared with the previous one.
All images were reviewed and assessed by two cardiothoracic radiologists with more than 10 years of experience, who were blinded to clinical outcomes and nucleic acid test results. A consensus was reached in cases of discrepancies. All CT images were reviewed at a lung window width and level of 1600 HU and −600 HU, respectively.
Reverse Transcription Polymerase Chain Reaction and Variant Status
After collecting nucleic acid samples using a pharyngeal swab for each patient, the viral RNA was extracted by a detection kit especially designed for SARS-CoV-2 nucleic acid detection (BioGerm, Shanghai, China and Mdeasy, Wuhan, China). Consequently, amplification of N and ORF1ab genes was performed using RT-PCR. The results were regarded as positive when the Cycle threshold (Ct) values were lower than 40 for both target genes. When the Ct values of both N and ORF1ab genes were greater than 35, the viral load was considered to be low level.
Clinical Warning Indicators of Disease Aggravation
The course of the disease might deteriorate when patients met any of the following criteria:8 1) peripheral blood lymphocytes progressively decreased; 2) peripheral inflammatory factors, such as interleukin-6 and C-reactive protein, progressively increased; 3) lactic acid progressively increased; and 4) clinical symptoms, such as fever and respiratory tract symptoms, progressively aggravated.
Statistical Analysis
All statistical analyses were performed using the Statistical Product and Service Software (v.26.0, IBM). Continuous variables were expressed as medians (25% and 75% quartiles) and analyzed by the Mann–Whitney test or the two independent sample t-test. Categorical variables were depicted as numbers and percentages and were analyzed by the Chi-squared test. A P value less than 0.05 was considered to be significantly different.
Results
Comparison of Clinical Characteristics Between the Two Groups
A total of 178 patients satisfying the inclusion criteria were initially included in the present study, of which eight with negative findings on initial CT and five with poor quality images were excluded. Finally, 165 patients were included, comprising 69 patients with Omicron [21 males and 48 females; median age, 53.00 (49.00, 63.50) years] and 96 patients with original strain [53 males and 43 females; median age, 45.00 (38.25, 54.00) years] (Figure 1). Pertaining to clinical features, patients with Omicron were predominantly old people and females, without manifestation of any clinical symptoms, who had lower serum levels of C-reactive protein and procalcitonin and shorter interval from symptoms onset to initial CT scan compared to patients with the original strain (all P < 0.05). However, no significant differences were observed in comorbidities, leukocyte count, neutrophil count, lymphocyte count, serum concentration of interleukin-6, and D-dimer level between the two groups (all P > 0.05) (Table 1). Moreover, among all 69 patients infected with Omicron, 67 (97.10%) have been vaccinated.
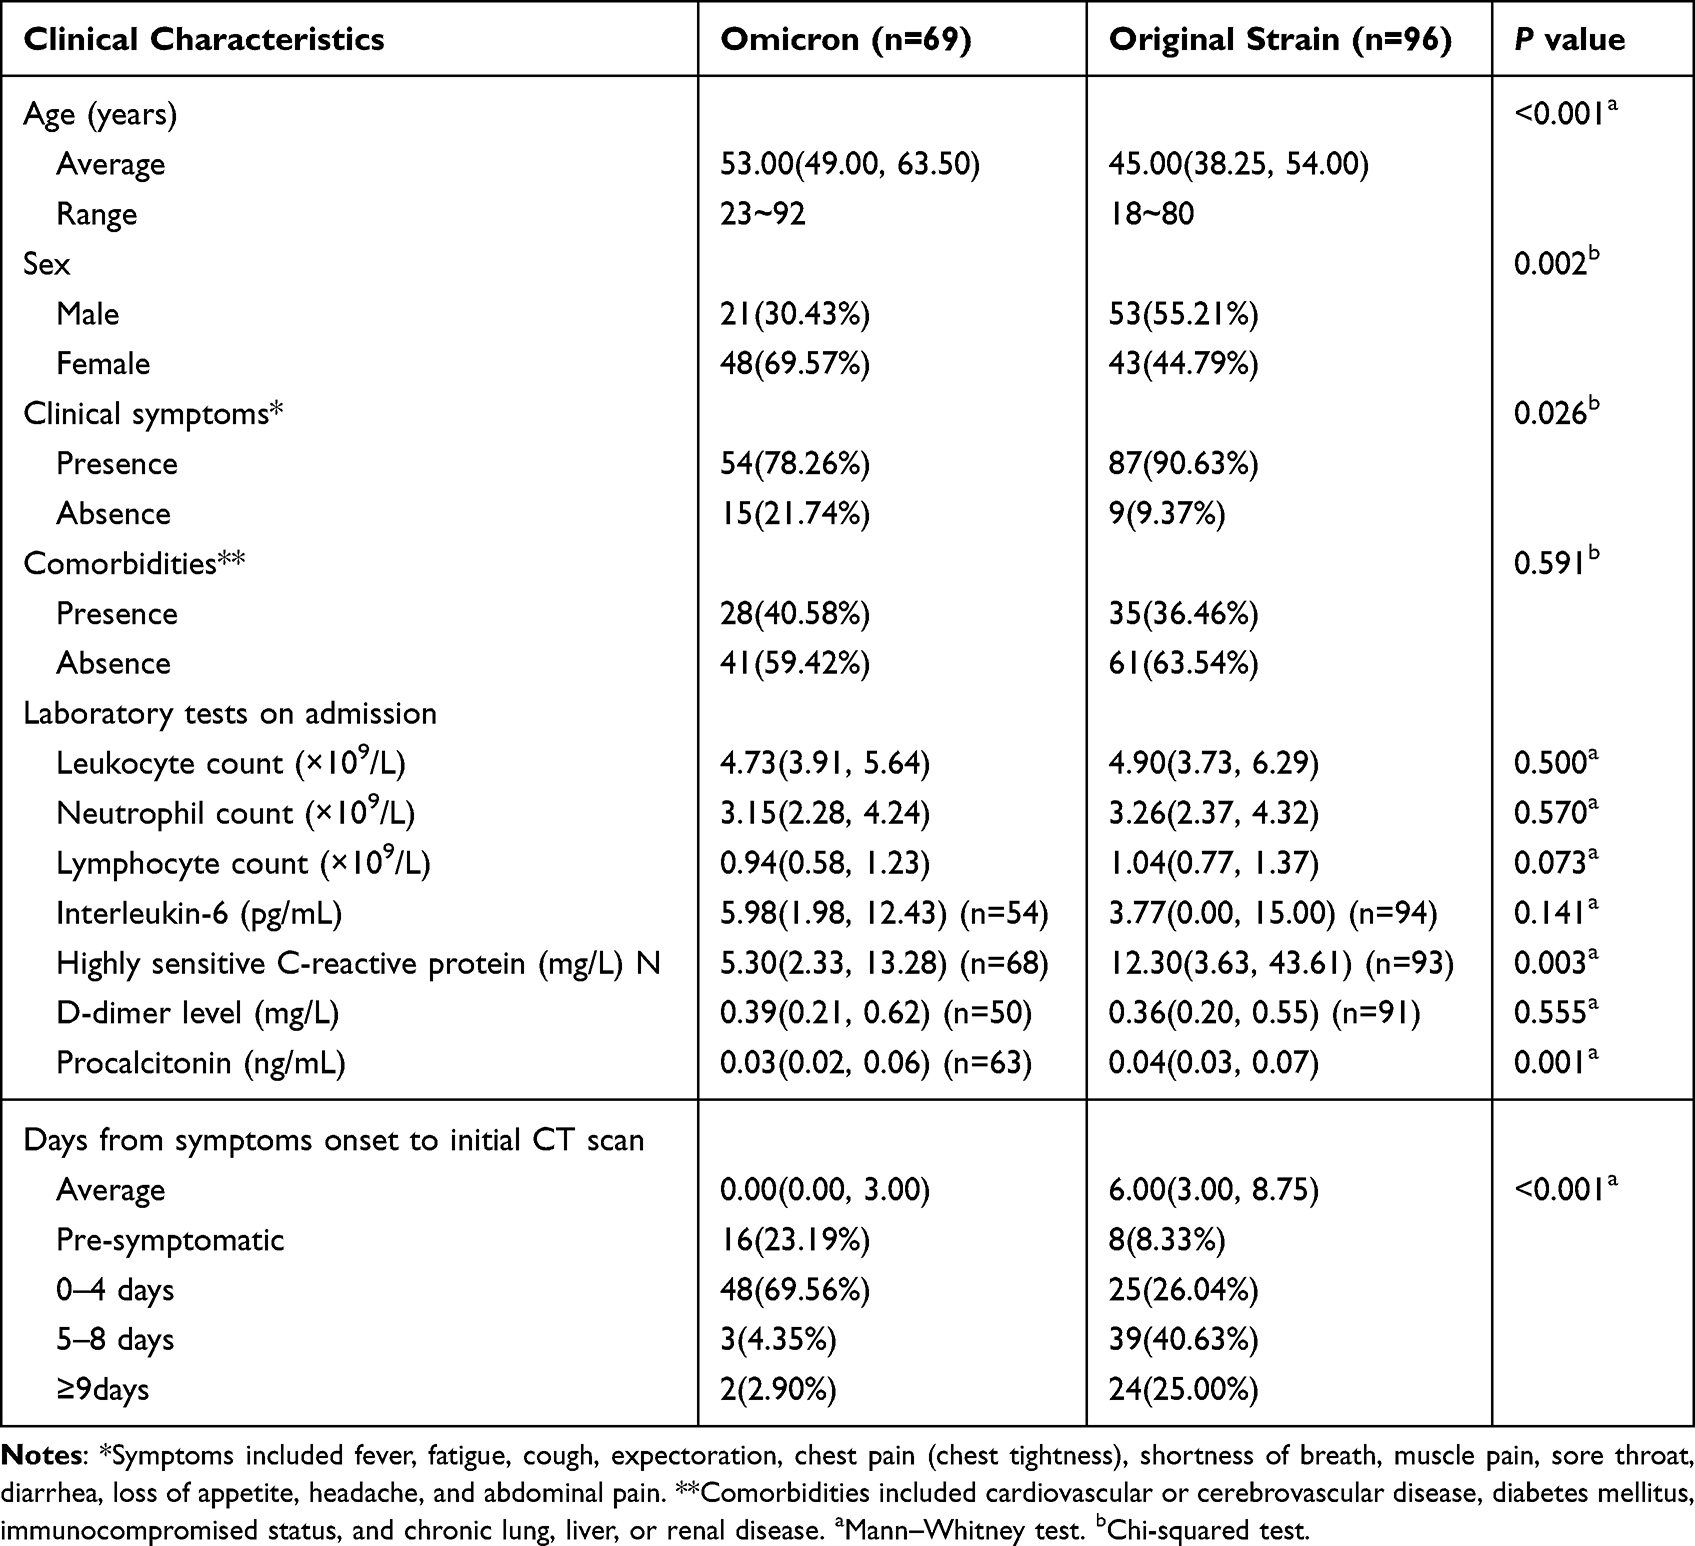 |
Table 1 Comparison of Clinical Characteristics Between the Two Groups |
 |
Figure 1 Flow diagram for patient selection in this study. |
Comparison of Computed Tomography Features Between the Two Groups
For CT features, patients with Omicron were more likely to present with round-like opacities and tree-in-bud pattern (all P < 0.05) (Figures 2 and 3), but less likely to exhibit a diffuse distribution, patchy and linear opacities, and vascular enlargement pattern (all P < 0.05) (Figures 4 and 5). The CT involvement scores at each stage in the Omicron group were lower than those in the original strain group (all P < 0.05). However, no significant differences were found with respect to lobar involvement, peripheral distribution, diffuse distribution, density of lesions, crazy-paving pattern, bronchodilation, interlobular septal thickening, pleural effusion, thoracic lymphadenopathy, and classification of CT appearances between the two groups (P > 0.05) (Table 2).
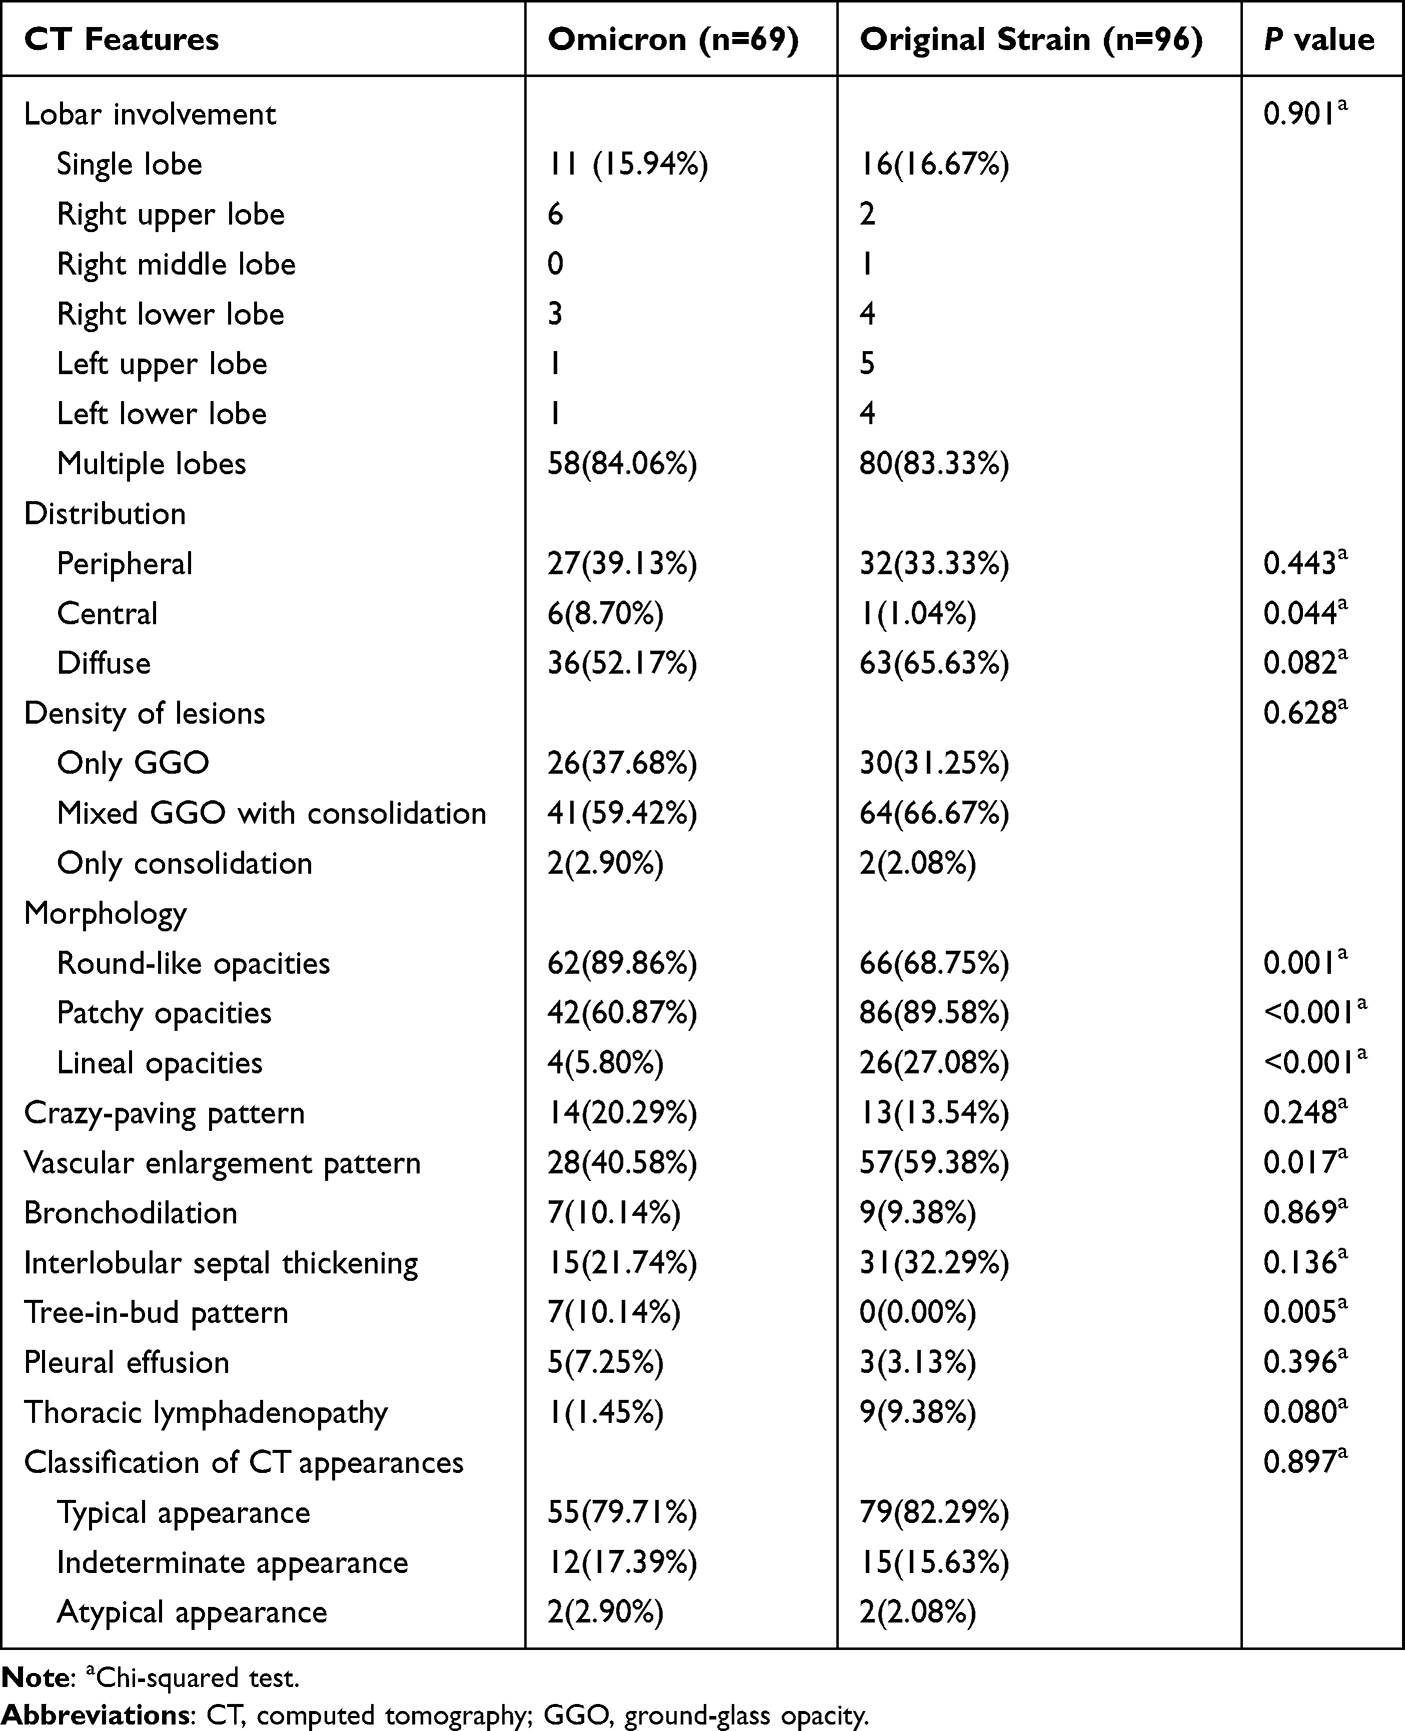 |
Table 2 Comparison of CT Features Between the Two Groups |
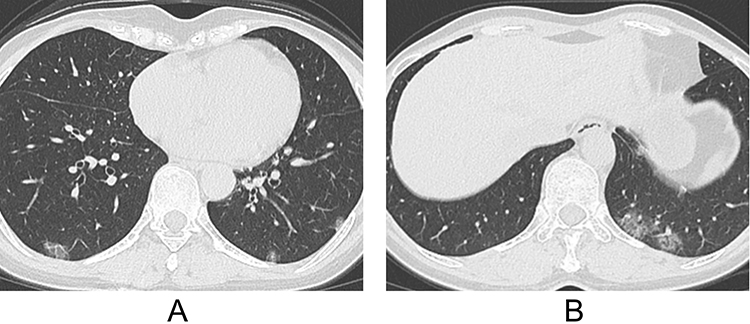 |
Figure 2 A 52-year-old female patient infected with Omicron strain. (A and B) Axial computed tomography (CT) images show multiple round-like ground-glass opacities (GGOs) distributed peripherally in both lungs. |
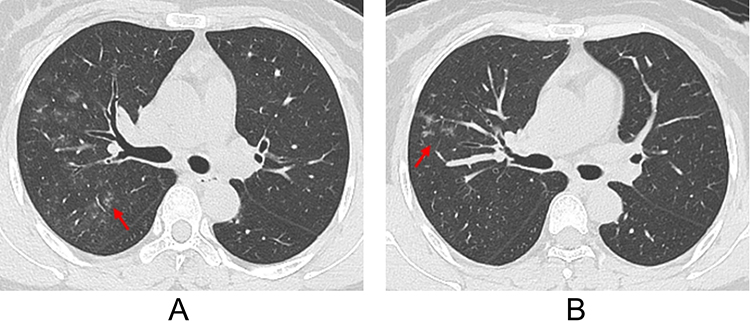 |
Figure 3 A 47-year-old female patient infected with the Omicron variant. (A and B) Axial computed tomography (CT) images exhibit a tree-in-bud pattern (red arrow) and patchy ground-glass opacities (GGOs) in the right upper lobe. |
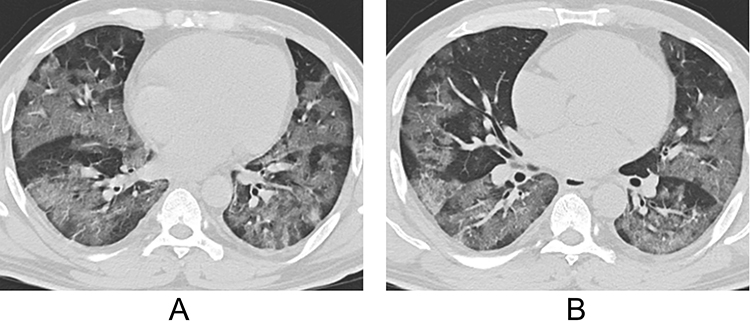 |
Figure 4 A 44-year-old male patient infected with the original strain. (A and B) Axial computed tomography (CT) images show patchy ground-glass opacities (GGOs) distributed peripherally of both lungs. |
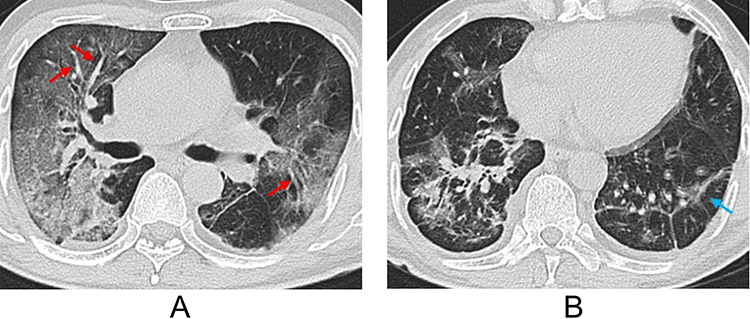 |
Figure 5 A 60-year-old male patient infected with the original strain. (A and B) Axial computed tomography (CT) images show linear opacities (blue arrow) and multiple subpleural ground-glass opacities (GGOs) in both lungs with a vascular enlargement pattern (red arrow). |
Comparison of Computed Tomography Involvement Scores Between the Two Groups
The time of CT scans was divided into three stages on the basis of days since disease onset as follows: stage 1 (≤7 days, 220 scans), stage 2 (8~13 days, 209 scans), and stage 3 (≥14 days, 195 scans). A total of 215 CT scans were performed for patients with Omicron, including 113 scans in stage 1, 76 scans in stage 2, and 26 scans in stage 3. In contrast, a total of 409 CT scans were performed for patients with original strain, including 107 scans in stage 1, 133 scans in stage 2, and 169 scans in stage 3. The lower lobes in bilateral lungs were more likely to be involved in each stage. The CT involvement scores for both lungs and each lobe among all three stages in patients with Omicron were significantly lower than those in patients with the original strain (all P < 0.05) (Table 3).
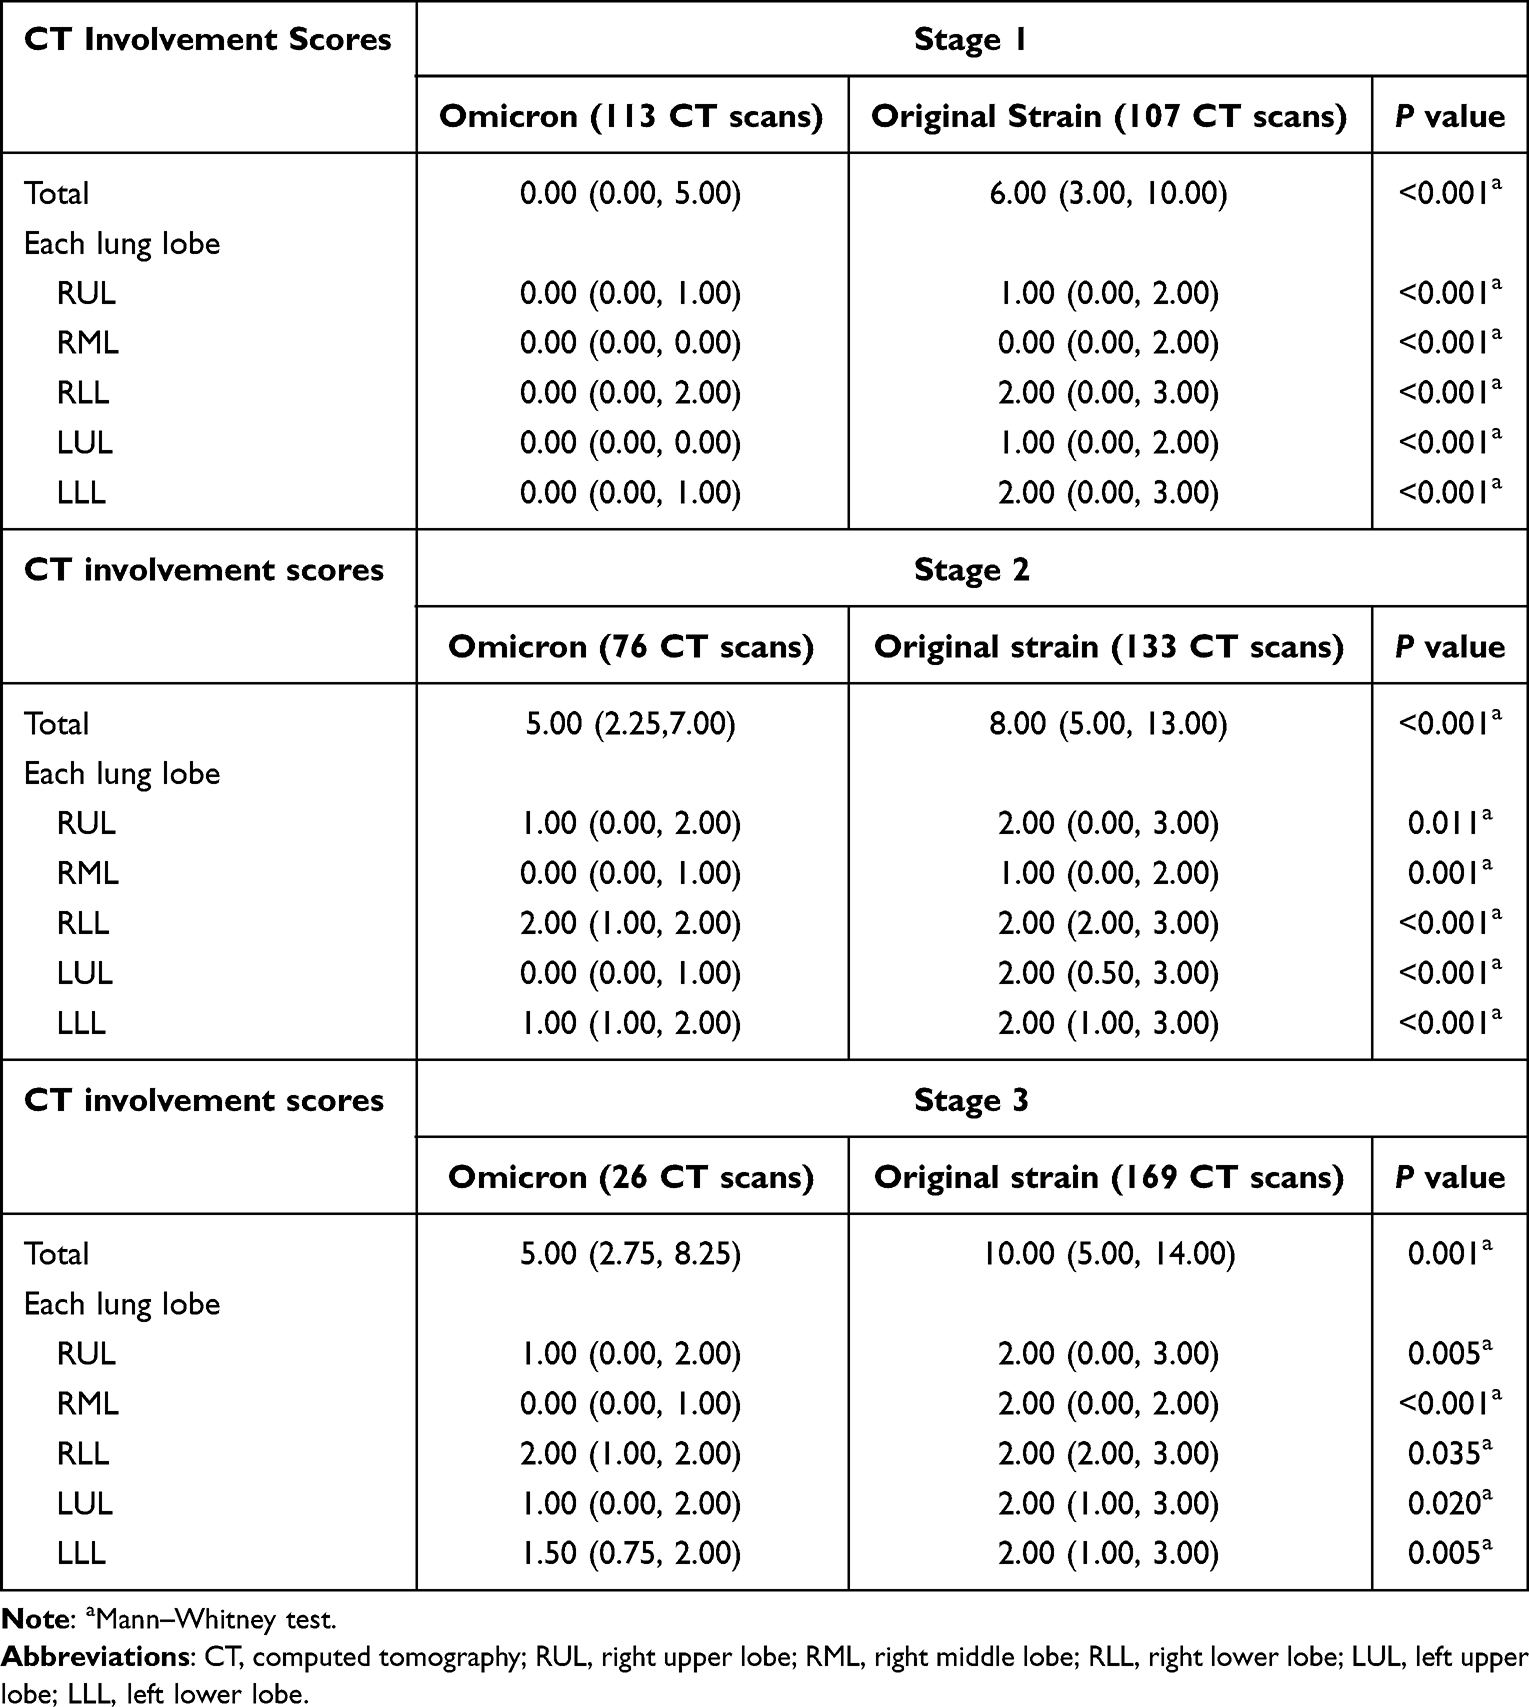 |
Table 3 Comparison of CT Involvement Scores Between the Two Groups |
Imaging Changes After Negative Reverse Transcription Polymerase Chain Reaction results
All 69 patients with Omicron showed positive RT-PCR results for SARS-CoV-2 on the first test, and a total of 632 RT-PCR tests were performed with an interval of 1–3 days. Among them, 62 underwent regular RT-PCR tests and follow-up CT scans during hospitalization. The average interval from disease onset to the time of two consecutive negative RT-PCR results with an interval of more than 24 h was 10 days, ranging from 3 to 18 days. When the RT-PCR results turned negative, 20 patients showed imaging absorption or stabilization, whereas 42 showed imaging progression.
Furthermore, all 96 patients with the original strain showed positive RT-PCR results for SARS-CoV-2 on the first test, and a total of 381 RT-PCR tests were performed with an interval of 1–19 days. Among them, 20 underwent regular RT-PCR tests and follow-up CT scans during hospitalization. The average interval from disease onset to the time of two consecutive negative RT-PCR results with an interval of more than 24 h was 16 days, ranging from 2 to 37 days. When the RT-PCR results turned negative, 18 showed imaging absorption or stabilization, whereas 2 showed imaging progression.
Compared to patients with the original strain (2/20, 10.00%), a greater number of patients with the Omicron variant showed imaging progression (42/62, 67.74%) when the RT-PCR results turned negative (P < 0.001). For the 42 patients with the Omicron variant, who had been diagnosed with disease progression, 39 (39/42, 92.86%) did not have any clinical warning indicators of disease aggravation with absorption of lung abnormalities on follow-up CTs, and only three (3/42, 7.14%) had clinical warning indicators with further progression on follow-up CTs (Figure 6). However, for the 2 patients with original strain who had imaging progression, both (2/2, 100.00%) had clinical warning indicators with further progression on follow-up CTs.
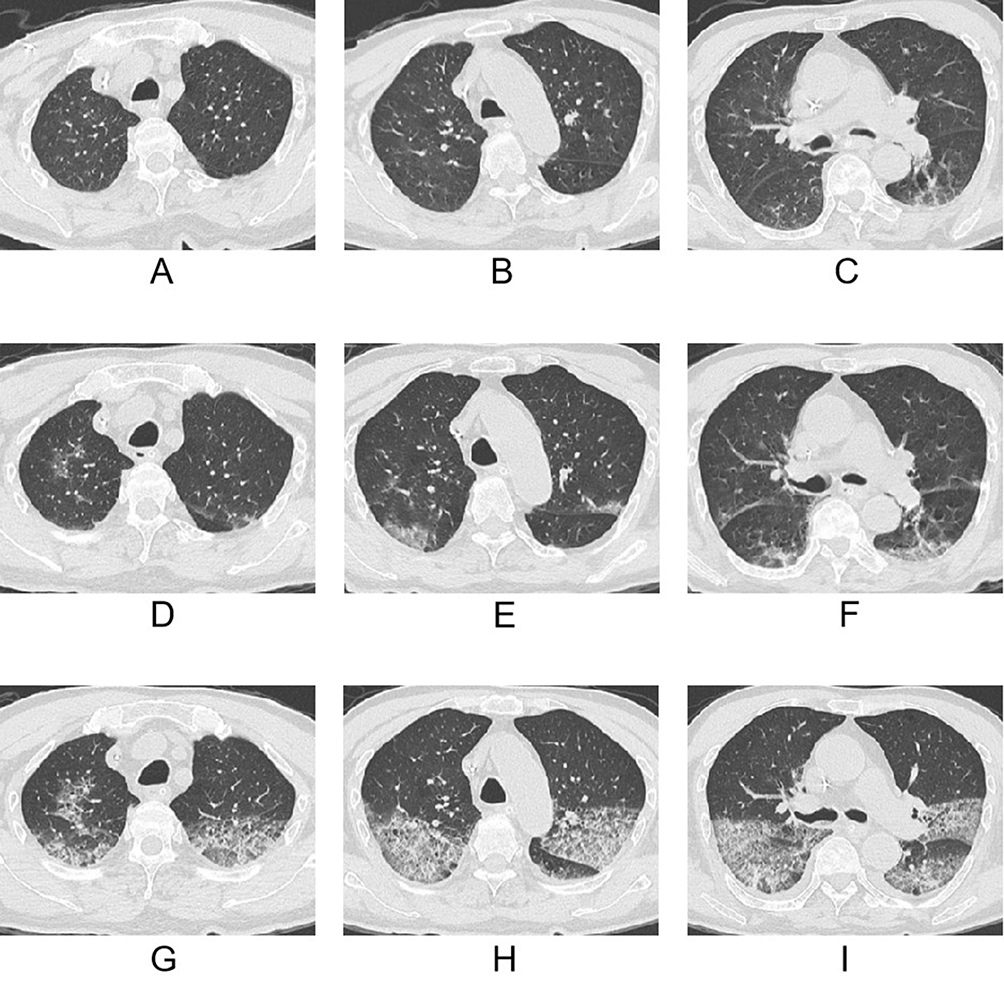 |
Figure 6 An 80-year-old male patient infected with the Omicron variant. (A–C) Initial computed tomography (CT) images revealed a few patchy ground-glass opacities (GGOs) in both lungs. (D–F) Four days later, this patient’s RT-PCR results turned negative, but his respiratory tract symptoms were aggravated with a progressive increase in the levels of interleukin-6. Follow-up CT images showed imaging progress with increased GGOs in both lungs. (G–I) Eight days later, follow-up CT images showed that GGOs were further increased in both lungs, accompanied by a crazy-paving pattern and small pleural effusion. |
Discussion
Throughout the SARS-CoV-2 pandemic in China, a significant portion of the population was diagnosed with either the original strain or the Omicron variant. RT-PCR and CT scans were routinely performed in clinical settings to assess potential changes in patients’ condition, to ensure optimal treatment and control the pandemic spread as soon as possible. In this retrospective study, we compared the clinical characteristics, CT manifestations, lung involvement scores, and imaging changes after the RT-PCR results turned negative between patients with the Omicron variant and the original strain. There were several major findings from this study.
With regard to clinical characteristics, our results revealed that old patients and females were more frequently observed in Omicron group than those in original strain group, which is consistent with the findings of previous studies.9,10 Patients with the original strain were more likely to exhibit SARS-CoV-2-related symptoms and a higher serum level of highly sensitive C-reactive protein and procalcitonin. C-reactive protein is an acute-phase protein that plays a key role in host antagonism against pathogens and inflammation,11 and its concentrations reflect disease severity in patients infected with SARS-CoV-2.12 Procalcitonin is the precursor of calcitonin, whose levels positively correlates with the severity of SARS-CoV-2 as well.13,14 These findings are in agreement with the reduced severity of Omicron, probably due to its lower replication competence in human lungs.15
In terms of CT features, our results showed that pulmonary lesions infected with Omicron variant were more likely to have a central distribution and round-like opacities, which were in line with the findings of Yoon et al.9 We found that vascular enlargement patterns were more common in patients with the original strain. The coronavirus-induced direct cytopathic effects and virus-triggered host immune reactions accompanied by massive accumulation of pro-inflammatory factors in the lung may lead to endothelial cell damage and an increase in vascular permeability, causing vascular dilation.16 Previous studies showed that vascular changes correlated with the severity of pneumonia.17,18 Moreover, some scholars indicated that Omicron was less virulent and exhibited fewer severe changes on CT,19 therefore, vascular enlargement patterns were less frequently observed in Omicron lesions. Our results demonstrated that tree-in-bud pattern was more common among patients infected with the Omicron variant, which is consistent with the findings of Liu et al,20 suggesting that Omicron was more likely to invade the bronchiole compared to the original strain. The ex-vivo research of Hui et al,15 indicating that Omicron replicates better in the bronchi compared to the original strain, may also support our findings. We also found that there was no difference in CT classification of appearances between both groups, which was in consistent with the result of Balacchi et al,21 but contradicted that of Han et al.4 The different outcomes reported in the literature might be attributed to different sample size and study design. Furthermore, the present study identified that the degree of parenchymal involvement on CT in patients infected with the Omicron variant (in all three stages) was less severe than that shown by patients infected with the original strain, suggesting that the pathogenicity of Omicron is attenuated, which is consistent with other reports.22–24 Some scholars believed that the reduced pathogenicity of Omicron conforms to the evolution principle,25 indicating in turn that newer variants of SARS-CoV-2 may be weaker and weaker.26 In addition, despite the fact that low-level infections may persist, a pandemic outbreak is improbable.
Moreover, the current study revealed a less reported phenomenon, ie, patients infected with Omicron tended to demonstrate imaging progression after the RT-PCR results turned negative for SARS‐CoV‐2; however, this phenomenon was less frequently observed in patients infected with the original strain. Among the 42 Omicron patients with imaging progression under a low virus load, most of them (39/42, 92.86%) did not present any clinical warning indicators of disease aggravation. We speculated that the inconsistency between imaging and clinical findings might be associated with the slow absorption speed of pneumonia caused by Omicron. There were only three patients (3/42,7.14%) associated with disease aggravation, and we believed that the immune-mediated lung injury due to immune dysregulation might be attributable to this phenomenon.27 After SARS-CoV-2 infection, a series of immune changes against this virus will be induced.28 Some previous studies identified an increase in virus‐specific IgM and IgA in the acute phase, followed by an increase in virus‐specific IgG at later phases, in the course of SARS-CoV-2 infection.29 The host humoral response against SARS-CoV-2 resembles a double-edged arrow. On the one hand, it can neutralize the viruses, while on the other hand, it may cause immune-mediated lung injury due to immune dysregulation.30 We speculated that the direct damage caused by the viral invasion might play a key role in lung injury at the early stage of the disease when the virus load is high. However, as the virus‐specific IgM begins to develop against the virus, the viral load will gradually decline. Afterward, with the increase in the virus-specific IgG level, the immune-mediated inflammatory diseases might lead to exacerbations at low virus load conditions. Therefore, it is important to seriously consider clinical warning indicators of disease aggravation after a negative nucleic acid result. If patients do not have any clinical warning indicators, there is no need to worry about progression on CT images; otherwise, close follow-up CTs might be necessary. Some scholars31,32 have reported that almost 45% patients with SARS-CoV-2 developed bacterial and fungal co-infections and superinfections more than 48–72h after admission, which could be another possible explanation for imaging progression after RT-PCR results turned negative. In consideration of the secondary pulmonary infection after several days of hospitalization, we only included the patients undergoing chest CT scans within 24 h before or after admission. Additionally, other complications, such as pulmonary embolism, may also help explain disease deterioration under a low viral load.
There are several limitations in our study. First, our study was a retrospective study conducted in a single center, which might have introduced selection bias. Second, given that some scholars have already compared the clinical and imaging features between Omicron and non-Omicron variants, our aim was to determine the differential features between Omicron and the original stain. Third, artificial intelligence has been widely used in the diagnosis of SARS-CoV-2 based on chest imaging and has presented excellent performance,33 thus we are planning to compare the differences between Omicron and original strain using deep learning method in the future study.
In conclusion, pneumonia caused by the Omicron variant was less severe on CT compared to that by the original strain. In addition, imaging progression after the RT-PCR results turned negative was more common in patients infected with Omicron than in those with the original strain.
Abbreviations
Ct, cycle threshold; GGO, ground-glass opacity; Ig, immunoglobulin; N, nucleocapsid; ORF1ab, open reading frame 1ab; RdRp, RNA-dependent RNA polymerase; RT-PCR, reverse-transcription polymerase chain reaction; SARS-CoV-2, severe acute respiratory syndrome coronavirus-2.
Ethics Approval and Informed Consent
Chongqing University Three Gorges Hospital’s institutional review board approved this study, and informed consent was obtained from all individual participants included in the study. This retrospective study complies with the Declaration of Helsinki and abides by the principle of confidentiality, ensuring non-disclosure of patient privacy.
Consent for Publication
The details of any images, recordings, and figures can be published, and the persons providing consent have been shown the article contents to be published.
Acknowledgments
Yue Zhang and Qi Li are co-first authors for this study.
Funding
This study was supported by Chongqing medical scientific research project (Joint project of Chongqing Health Commission and Science and Technology Bureau) (2022MSXM147) and Chongqing Health Commission (Chongqing Talent Program-Innovation leading Talent Research Project) (CQYC20210303348) of China.
Disclosure
The authors report no conflicts of interest in this work.
References
1. Cheng Z, Lu Y, Cao Q, et al. Clinical Features and Chest CT Manifestations of Coronavirus Disease 2019 (COVID-19) in a Single-Center Study in Shanghai, China. AJR Am J Roentgenol. 2020;215(1):121–126. doi:10.2214/AJR.20.22959
2. El-Shabasy RM, Nayel MA, Taher MM, Abdelmonem R, Shoueir KR, Kenawy ER. Three waves changes, new variant strains, and vaccination effect against COVID-19 pandemic. Int J Biol Macromol. 2022;204:161–168. doi:10.1016/j.ijbiomac.2022.01.118
3. Wolter N, Jassat W, Walaza S, et al. Early assessment of the clinical severity of the SARS-CoV-2 omicron variant in South Africa: a data linkage study. Lancet. 2022;399(10323):437–446. doi:10.1016/S0140-6736(22)00017-4
4. Han X, Chen J, Chen L, et al. Comparative Analysis of Clinical and CT Findings in Patients with SARS-CoV-2 Original Strain, Delta and Omicron Variants. Biomedicines. 2023;11(3). doi:10.3390/biomedicines11030901
5. Pingping Z, Yanyu Z, Xuri S, Qiming H, Yi W, Guoliang T. Comparison between original SARS-CoV-2 strain and omicron variant on thin-section chest CT imaging of COVID-19 pneumonia. Die Radiologie. 2023;63(S2):55–63. doi:10.1007/s00117-023-01147-2
6. Simpson S, Kay FU, Abbara S, et al. Radiological Society of North America Expert Consensus Document on Reporting Chest CT Findings Related to COVID-19: endorsed by the Society of Thoracic Radiology. Am Coll Radiol RSNA Radiol. 2020;2(2). doi:10.1148/ryct.2020200152
7. Liu J, Chen T, Yang H, et al. Clinical and radiological changes of hospitalised patients with COVID-19 pneumonia from disease onset to acute exacerbation: a multicentre paired cohort study. Eur Radiol. 2020;30(10):5702–5708. doi:10.1007/s00330-020-06916-4
8. Xu Y, Chen Y, Tang X. Guidelines for the diagnosis and treatment of coronavirus disease 2019 (COVID-19) in China. Global Health & Medicine. 2020;2(2):66–72. doi:10.35772/ghm.2020.01015
9. Yoon SH, Lee JH, Kim B-N. Chest CT Findings in Hospitalized Patients with SARS-CoV-2: delta versus Omicron Variants. Radiology. 2023;306(1):252–260. doi:10.1148/radiol.220676
10. Zhou S, Zhu T, Wang Y, Xia L. Imaging features and evolution on CT in 100 COVID-19 pneumonia patients in Wuhan, China. Eur Radiol. 2020;30(10):5446–5454. doi:10.1007/s00330-020-06879-6
11. Wu Y, Potempa LA, El Kebir D, Filep JG. C-reactive protein and inflammation: conformational changes affect function. Biol Chem. 2015;396(11):1181–1197. doi:10.1515/hsz-2015-0149
12. Smilowitz NR, Kunichoff D, Garshick M, et al. C-reactive protein and clinical outcomes in patients with COVID-19. Eur Heart J. 2021;42(23):2270–2279. doi:10.1093/eurheartj/ehaa1103
13. Huang C, Wang Y, Li X, et al. Clinical features of patients infected with 2019 novel coronavirus in Wuhan, China. Lancet. 2020;395(10223):497–506. doi:10.1016/S0140-6736(20)30183-5
14. Guan W-J, Z-Y N, Hu Y, et al. Clinical Characteristics of Coronavirus Disease 2019 in China. N Engl J Med. 2020;382(18):1708–1720. doi:10.1056/NEJMoa2002032
15. Hui KPY, Jcw H, Cheung MC, et al. SARS-CoV-2 Omicron variant replication in human bronchus and lung ex vivo. Nature. 2022;603(7902):715–720. doi:10.1038/s41586-022-04479-6
16. Liu J, Zheng X, Tong Q, et al. Overlapping and discrete aspects of the pathology and pathogenesis of the emerging human pathogenic coronaviruses SARS-CoV, MERS-CoV, and 2019-nCoV. J Med Virol. 2020;92(5):491–494. doi:10.1002/jmv.25709
17. Aoki R, Iwasawa T, Hagiwara E, Komatsu S, Utsunomiya D, Ogura T. Pulmonary vascular enlargement and lesion extent on computed tomography are correlated with COVID-19 disease severity. Jpn J Radiol. 2021;39(5):451–458. doi:10.1007/s11604-020-01085-2
18. Li Q, Huang XT, Li CH, Liu D, Lv FJ. CT features of coronavirus disease 2019 (COVID-19) with an emphasis on the vascular enlargement pattern. Eur J Radiol. 2021;134:109442. doi:10.1016/j.ejrad.2020.109442
19. Tsakok MT, Watson RA, Saujani SJ, et al. Reduction in Chest CT Severity and Improved Hospital Outcomes in SARS-CoV-2 Omicron Compared with Delta Variant Infection. Radiology. 2023;306(1):261–269. doi:10.1148/radiol.220533
20. Liu M, Zeng W, Wen Y, Zheng Y, Lv F, Xiao K. COVID-19 pneumonia: CT findings of 122 patients and differentiation from influenza pneumonia. Eur Radiol. 2020;30(10):5463–5469. doi:10.1007/s00330-020-06928-0
21. Balacchi C, Brandi N, Ciccarese F, et al. Comparing the first and the second waves of COVID-19 in Italy: differences in epidemiological features and CT findings using a semi-quantitative score. Emerg Radiol. 2021;28(6):1055–1061. doi:10.1007/s10140-021-01937-y
22. Halfmann PJ, Iida S, Iwatsuki-Horimoto K, et al. SARS-CoV-2 Omicron virus causes attenuated disease in mice and hamsters. Nature. 2022;603(7902):687–692. doi:10.1038/s41586-022-04441-6
23. Fan Y, Li X, Zhang L, Wan S, Zhang L, Zhou F. SARS-CoV-2 Omicron variant: recent progress and future perspectives. Signal Transduct Target Ther. 2022;7(1):141. doi:10.1038/s41392-022-00997-x
24. Vitiello A, Ferrara F, Auti AM, Di Domenico M, Boccellino M. Advances in the Omicron variant development. J Intern Med. 2022;292(1):81–90. doi:10.1111/joim.13478
25. Zheng L, Liu S, Lu F. Impact of National Omicron Outbreak at the end of 2022 on the future outlook of COVID-19 in China. Emerg Microbes Infect. 2023;12(1):2191738. doi:10.1080/22221751.2023.2191738
26. Das S, Samanta S, Banerjee J, et al. Is Omicron the end of pandemic or start of a new innings? Travel Med Infect Dis. 2022;48:102332. doi:10.1016/j.tmaid.2022.102332
27. Yang L, Liu S, Liu J, et al. COVID-19: immunopathogenesis and Immunotherapeutics. Signal Transduct Target The. 2020;5(1). doi:10.1038/s41392-020-00243-2
28. Yan C, Chen J, Ding Y, et al. The Crucial Role of PPARgamma-Egr-1-Pro-Inflammatory Mediators Axis in IgG Immune Complex-Induced Acute Lung Injury. Front Immunol. 2021;12:634889. doi:10.3389/fimmu.2021.634889
29. Azkur AK, Akdis M, Azkur D, et al. Immune response to SARS-CoV-2 and mechanisms of immunopathological changes in COVID-19. Allergy. 2020;75(7):1564–1581. doi:10.1111/all.14364
30. Li Q, Wang Y, Sun Q, et al. Immune response in COVID-19: what is next? Cell Death Differ. 2022;29(6):1107–1122. doi:10.1038/s41418-022-01015-x
31. Brandi N, Ciccarese F, Balacchi C, et al. Co-Infections and Superinfections in COVID-19 Critically Ill Patients Are Associated with CT Imaging Abnormalities and the Worst Outcomes. Diagnostics. 2022;12(7). doi:10.3390/diagnostics12071617
32. Grasselli G, Scaravilli V, Mangioni D, et al. Hospital-Acquired Infections in Critically Ill Patients With COVID-19. Chest. 2021;160(2):454–465. doi:10.1016/j.chest.2021.04.002
33. Khan SH, Alahmadi TJ, Alsahfi T, et al. COVID-19 infection analysis framework using novel boosted CNNs and radiological images. Sci Rep. 2023;13(1):21837. doi:10.1038/s41598-023-49218-7
 © 2024 The Author(s). This work is published and licensed by Dove Medical Press Limited. The full terms of this license are available at https://www.dovepress.com/terms.php and incorporate the Creative Commons Attribution - Non Commercial (unported, v3.0) License.
By accessing the work you hereby accept the Terms. Non-commercial uses of the work are permitted without any further permission from Dove Medical Press Limited, provided the work is properly attributed. For permission for commercial use of this work, please see paragraphs 4.2 and 5 of our Terms.
© 2024 The Author(s). This work is published and licensed by Dove Medical Press Limited. The full terms of this license are available at https://www.dovepress.com/terms.php and incorporate the Creative Commons Attribution - Non Commercial (unported, v3.0) License.
By accessing the work you hereby accept the Terms. Non-commercial uses of the work are permitted without any further permission from Dove Medical Press Limited, provided the work is properly attributed. For permission for commercial use of this work, please see paragraphs 4.2 and 5 of our Terms.