")
Back to Journals » ClinicoEconomics and Outcomes Research » Volume 16
Challenges with Estimating Long-Term Overall Survival in Extensive Stage Small-Cell Lung Cancer: A Validation-Based Case Study
Authors Johal S, Brannman L, Genestier V, Cawston H
Received 1 December 2023
Accepted for publication 12 February 2024
Published 28 February 2024 Volume 2024:16 Pages 97—109
DOI https://doi.org/10.2147/CEOR.S448975
Checked for plagiarism Yes
Review by Single anonymous peer review
Peer reviewer comments 2
Editor who approved publication: Dr Samer Hamidi
Sukhvinder Johal,1 Lance Brannman,2 Victor Genestier,3 Hélène Cawston4
1Oncology Market Access and Pricing, AstraZeneca, Cambridge, UK; 2Oncology Market Access and Pricing, AstraZeneca, Gaithersburg, MD, USA; 3Health Economic and Outcomes Research, Amaris Consulting, Toronto, Ontario, Canada; 4Health Economic Outcomes Research, Amaris Consulting, Paris, France
Correspondence: Sukhvinder Johal, Oncology Market Access and Pricing, AstraZeneca, Cambridge, UK, Tel +44 7384 905033, Email [email protected]
Objective: The study aimed to explore methods and highlight the challenges of extrapolating the overall survival (OS) of immunotherapy-based treatment in first-line extensive stage small-cell lung cancer (ES-SCLC).
Methods: Standard parametric survival models, spline models, landmark models, mixture and non-mixture cure models, and Markov models were fitted to 2-year data of the CASPIAN Phase 3 randomised trial of PD-L1 inhibitor durvalumab added to platinum-based chemotherapy (NCT03043872). Extrapolations were compared with updated 3-year data from the same trial and the plausibility of long-term estimates assessed.
Results: All models used provided a reasonable fit to the observed Kaplan–Meier (K-M) survival data. The model which provided the best fit to the updated CASPIAN data was the mixture cure model. In contrast, the landmark analysis provided the least accurate fit to model survival. Estimated mean OS differed substantially across models and ranged from (in years) 1.41 (landmark model) to 4.81 (mixture cure model) for durvalumab plus etoposide and platinum and from 1.01 (landmark model) to 2.00 (mixture cure model) for etoposide and platinum.
Conclusion: While most models may provide a good fit to K-M data, it is crucial to assess beyond the statistical goodness-of-fit and consider the clinical plausibility of the long-term predictions. The more complex cure models demonstrated the best predictive ability at 3 years, potentially providing a better representation of the underlying method of action of immunotherapy; however, consideration of the models’ clinical plausibility and cure assumptions need further research and validation. Our findings underscore the significance of adopting a clinical perspective when selecting the most appropriate approach to model long-term survival, particularly when considering the use of more complex models.
Keywords: survival analysis, parametric extrapolation, spline model, cure models, landmark model, extensive stage small-cell lung cancer
Introduction
Treatment strategies presented to healthcare payers can be assessed in terms of their long-term costs and benefits. This assessment is achieved through decision analytical modeling, which requires projecting outcomes after the follow-up period of the clinical trial, often over a lifetime horizon. In oncology, cost-effectiveness analyses are usually based on partitioned survival models or semi-Markov models, details of which have been described in the literature.1,2 Assumptions are often needed in the models to extrapolate long-term survival data from clinical trials when treatments are evaluated beyond clinical trial horizons.
Statistical models, which often rely on clinical assumptions, are used to extrapolate survival data. Fitting parametric models to clinical data is the standard approach taken to estimate long-term survival data. However, standard parametric extrapolation models present some limitations. They generally estimate the survival of the entire population and may not adequately capture heterogeneity within trial populations such as differences across response status at different time points, long-term response, and whether patients can be regarded as long-term benefiters of the therapy.1,2 On the other hand, semi-Markov models capture health outcomes using health states and use transition probabilities to estimate the movement from one health state to another.3 These models are similarly limited and may not adequately account for competing risks in certain decision problems.
Recently, the National Institute for Health and Care Excellence Decision Support Unit (NICE DSU) published guidelines to support researchers in the selection of the most appropriate extrapolation method (NICE DSU 14 and NICE DSU 21).1,2 These guidelines suggest that researchers should consider all relevant approaches and compare the generated extrapolations of long-term survival among different approaches and the literature, especially in the disease area of oncology.
These recommendations are particularly relevant in the context of immunotherapies, where the usual parametric distributions present additional limitations as they may not reflect their mechanism of action.1,2 In this regard, fitting models to trial data is challenging since long-term responders to treatment can drive the tails of survival curves to a “plateau” – a situation where some patients do not experience the event (not progressing nor dying) over time.4 Such plateaus may appear when immunotherapies are used to treat lung cancer, yet they may not be reflected in the functional forms of standard parametric distributions.5 In addition, long-term extrapolations may be too optimistic (with the plateau occurring earlier) or pessimistic (with the plateau occurring later), and different hazard functions shapes may appear when using immunotherapies (especially increasing followed by decreasing shapes).
Consequently, limitations with current standard approaches have led to the consideration of more flexible, and in many cases more complex models such as spline models, cure models, and landmark models that can model complex hazard functions and changes in the slopes of survival curves, which can be applied in the context of immunotherapies. However, there is still uncertainty on how to define the best approach to modelling long-term survival, and whether adding complexity to these approaches improves long-term survival predictions. Therefore, the objective of this study was to highlight the challenges that are present when modeling survival beyond the clinical trial by assessing the performance of different approaches to estimating long-term survival rates of patients with extensive stage small-cell lung cancer (ES-SCLC) treated with immunotherapies. For this purpose, we used individual patient-level data from CASPIAN (NCT03043872), a previously published clinical trial of PD-L1 inhibitor durvalumab added to first-line standard platinum-based chemotherapy in patients with previously untreated ES-SCLC.
Small-cell lung cancer (SCLC) is characterized by aggressive disease progression and accounts for 15% of lung cancer cases.6 Patients with ES-SCLC have traditionally been treated with the chemotherapeutic agents etoposide and platinum (EP) as first-line therapy. While patients with ES-SCLC initially respond to first-line EP therapy, patients often experience relapse; thus, identifying effective treatment options that induce durable disease control has been a challenge.7 However, recent clinical trials adding immunotherapy (eg, atezolizumab, durvalumab, pembrolizumab, or nivolumab) to EP have shown promising results in prolonging overall survival (OS), which has resulted in immunotherapy plus EP becoming the standard of care in many countries, including the United States and Europe.8–12 CASPIAN is a phase 3, randomized clinical trial comparing durvalumab with or without tremelimumab plus EP to EP alone for first-line treatment of patients with ES-SCLC. The trial had 2-year and 3-year data cuts, occurring in January 2020 (referred hereafter as 2-year data, with a median follow-up of 25.1 months) and March 2021 (referred hereafter as 3-year data, with a median follow-up of 39.4 months), respectively.11,13 In the 2-year data, patients treated with durvalumab plus EP showed significant improvement in OS compared to those treated with EP.13 At 24 months, the OS rate was 22.6% in the durvalumab plus EP arm, compared to 13.5% in the EP arm alone. In the 3-year data, durvalumab plus EP continued to show superior effect compared to EP alone, with a 36-month OS rate of 17.6% for durvalumab plus EP compared to 5.8% for EP alone.11 The primary endpoint of OS for durvalumab plus EP vs EP alone was met in CASPIAN, while durvalumab plus tremelimumab plus EP continued to numerically improve OS vs EP alone.11
As the treatment landscape for ES-SCLC is rapidly evolving, there is a need to understand – from both clinical and payer/reimbursement perspectives – the extrapolation method that is likely to be the most accurate in estimating long-term survival rates of different treatments, especially immunotherapies. Since CASPIAN is the only phase 3 study to publish 2- and 3-year follow-up data in this setting, we used the 2-year data from CASPIAN10 to compare different approaches to estimating long-term survival rates of patients with ES-SCLC in durvalumab plus EP and EP alone treatment arms, and compared our findings to the 3-year data from the same trial11 to identify the method that most accurately estimates short-term follow-up survival while also considering the clinical plausibility of the longer-term predictions.
Methods
Modelling Approaches
The following approaches were used to model the long-term OS using the 2-year data: (1) standard parametric survival models; (2) spline models;2 (3) cure models;14,15 (4) landmark models;16 and (5) Markov models,17 with all of them having been described previously. The approaches were chosen based on clinical opinion, the NICE DSU 21 guidelines,2 and the recent algorithm for selecting flexible survival models for cancer immunotherapies by Palmer et al.15 Each parametric distribution is associated with underlying hazard and survival function assumptions, which were carefully reviewed for their clinical validity.2 A limitation of standard parametric distributions is that heterogeneity in the modeled population is not directly considered. Spline, cure, and landmark models have additional assumptions that allow more flexibility in modeling complex trends. A semi-Markov model approach obtains OS indirectly based on probabilities calculated from other states. Clinical assumptions, strengths, and limitations of all approaches used are summarized in Table 1.
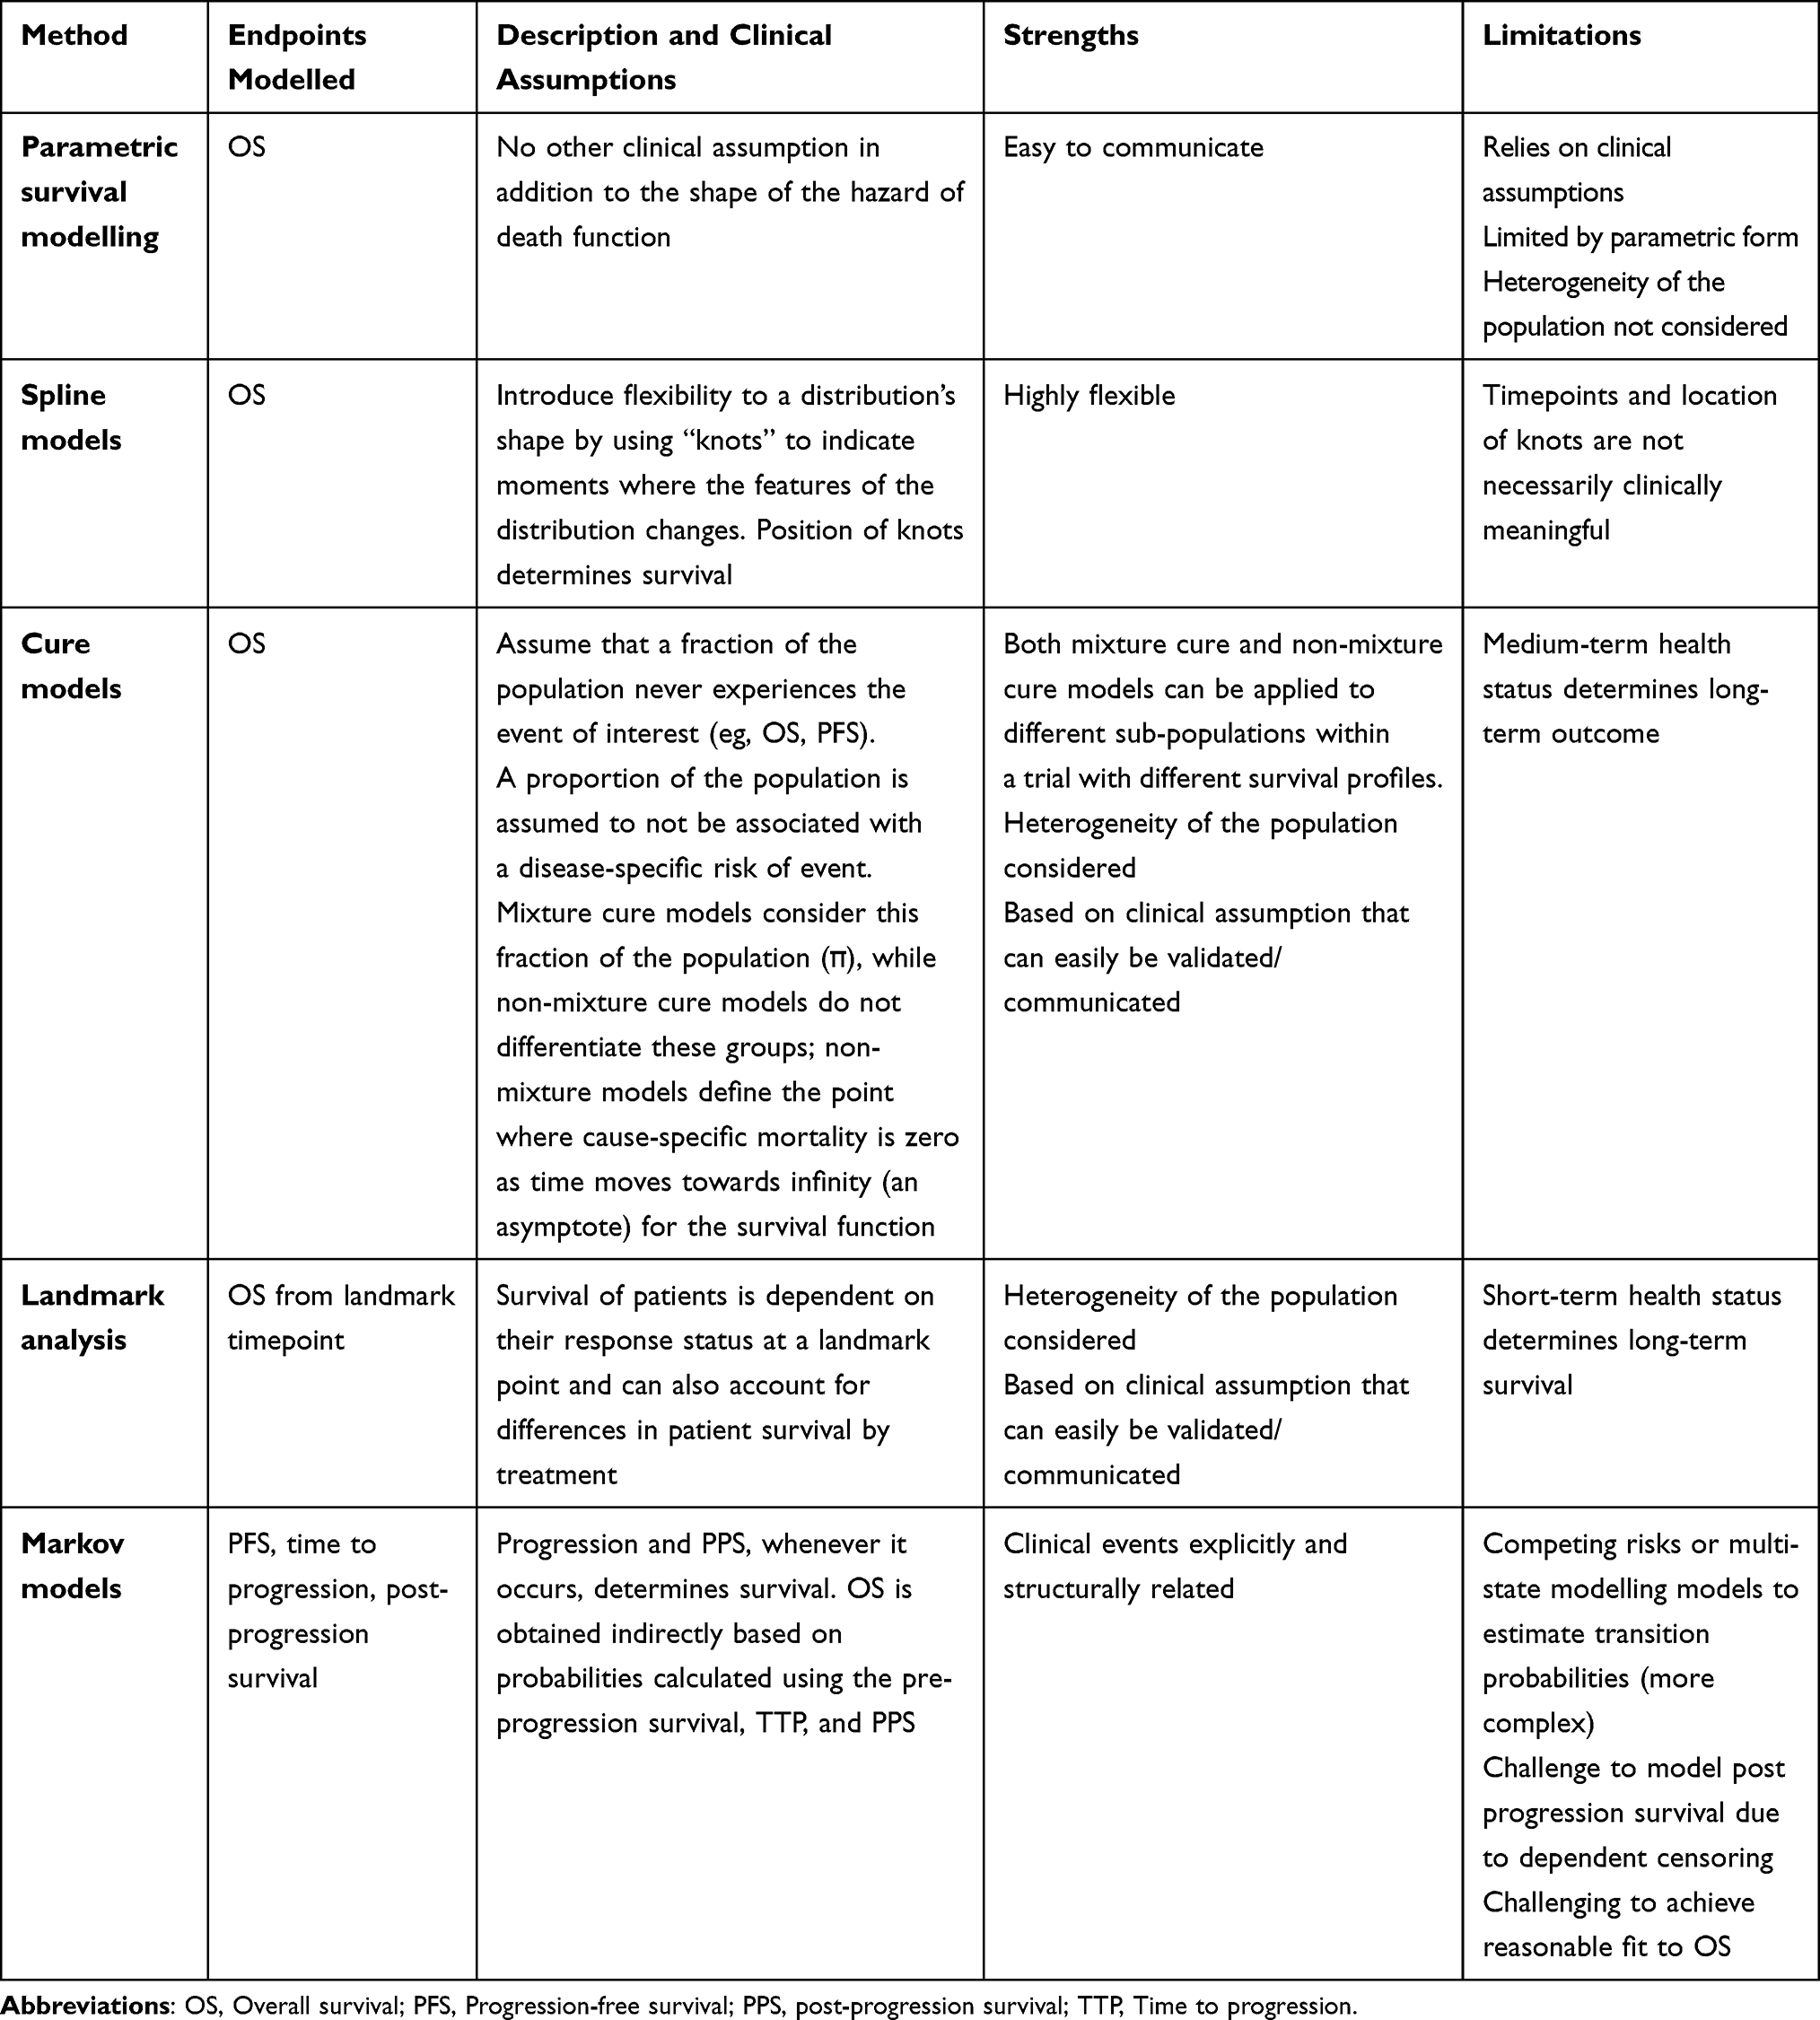 |
Table 1 Comparison of Selected Extrapolation Methods |
Analyses
In order to derive the life expectancy associated with the selected parametric, spline, cure, and landmark survival models, the mean area under the survival curves was estimated. Following the NICE DSU guidelines,1 the parametric distributions considered were as follows: Exponential, Weibull, Gamma, Gompertz, log-logistic, log normal, and Generalised Gamma. For the spline approach, the following models were considered: spline odds, spline inverse normal, and spine hazard, with a maximum of three knots considered.
Mixture cure and non-mixture cure models were estimated by adding the covariates collected in the trial18 (age, gender, race, ethnic group, body mass index, smoking status, treatment with platinum-based chemotherapy, performance status, lactate dehydrogenase levels, presence of brain metastases, and presence of liver metastases) and the general population’s mortality to better estimate the cured fraction and long-term survival. Survival of the general population for the mixture cure model was available in country life tables (United Kingdom [UK] for the current analyses). CASPIAN was a multinational trial, and the general population’s mortality likely is different across countries in the trial. To reflect this, we included sensitivity analyses with general population survival estimates for countries in the CASPIAN trial with the worst (Ukraine) and the best (Japan) life expectancies; they did not significantly affect the results (not reported).
For the landmark analysis, we assessed tumor response at the 12-week landmark point, which coincided with one of the time points of response measurement and the end of the induction period in the CASPIAN trial (12 weeks).19 We followed the Response Evaluation Criteria In Solid Tumors (RECIST) criteria, where any complete response (CR) or partial response (PR) was considered to be a response, while stable disease (SD) or progressive disease (PD) were considered to be non-responders.20
OS curves were derived for the following groups: durvalumab plus EP responders, EP responders, durvalumab plus EP non-responders, and EP non-responders. Before the response assessment, the risk of death of all patients (responders and non-responders) was estimated based on the observed OS for CASPIAN’s intention-to-treat (ITT) population. A weighted extrapolation for survival was performed based on each response group for both treatment arms at 12 weeks using the formula:
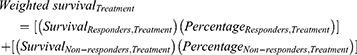
Visual inspection was conducted to ensure that the selected responder and non-responder curves did not cross each other.
For each method, the best fitting estimated survival curve was chosen based on the Akaike information criterion (AIC) and the Bayesian information criterion (BIC). The chosen models were also evaluated based on visual inspection (comparisons of the extrapolations and the Kaplan–Meier [KM] curves), and external information (literature). Results from all methods were compared to the 3-year data presented in the CASPIAN trial11 to determine the approach whose results aligned with the observed data in the trial. Further validation of longer-term data was conducted using data from real-world evidence (RWE) estimates. Mean OS – over a 30-year time horizon – estimated by each method was also included. The selected lifetime horizon reflects the conventional approach used in cost-effectiveness analyses. Additionally, the selected time horizon was a sufficient length to account for methods that yield optimistic long-term results.
Sensitivity Analyses
Sensitivity analysis was performed for each of the approaches, including distributions for all the different standard parametric curves, spline models, and cure models, as well as complementary results for the landmark analysis using the 20-week timepoint. As the cure models consider the general population mortality in its prediction, different countries’ mortalities were tested. As noted above, the countries with the best and worst life expectancies (Japan and Ukraine, respectively, compared to the UK in the base case) from the CASPIAN trial were tested and included as a sensitivity analysis. The 12-week timepoint represented the completion of induction chemotherapy in CASPIAN, whilst providing enough follow-up data to derive survival beyond the landmark point, whereas, the 20-week timepoint will have fewer patients.
Results
Overall, all the proposed approaches had similar hazard shapes, as expected for immunotherapies, as shown in Figure 1. The hazard curves showed an increase until 12–18 months, followed by a decrease in the hazard function. For the cure models in particular, the hazard functions started to increase again after five years due to the inclusion of the general population’s mortality.
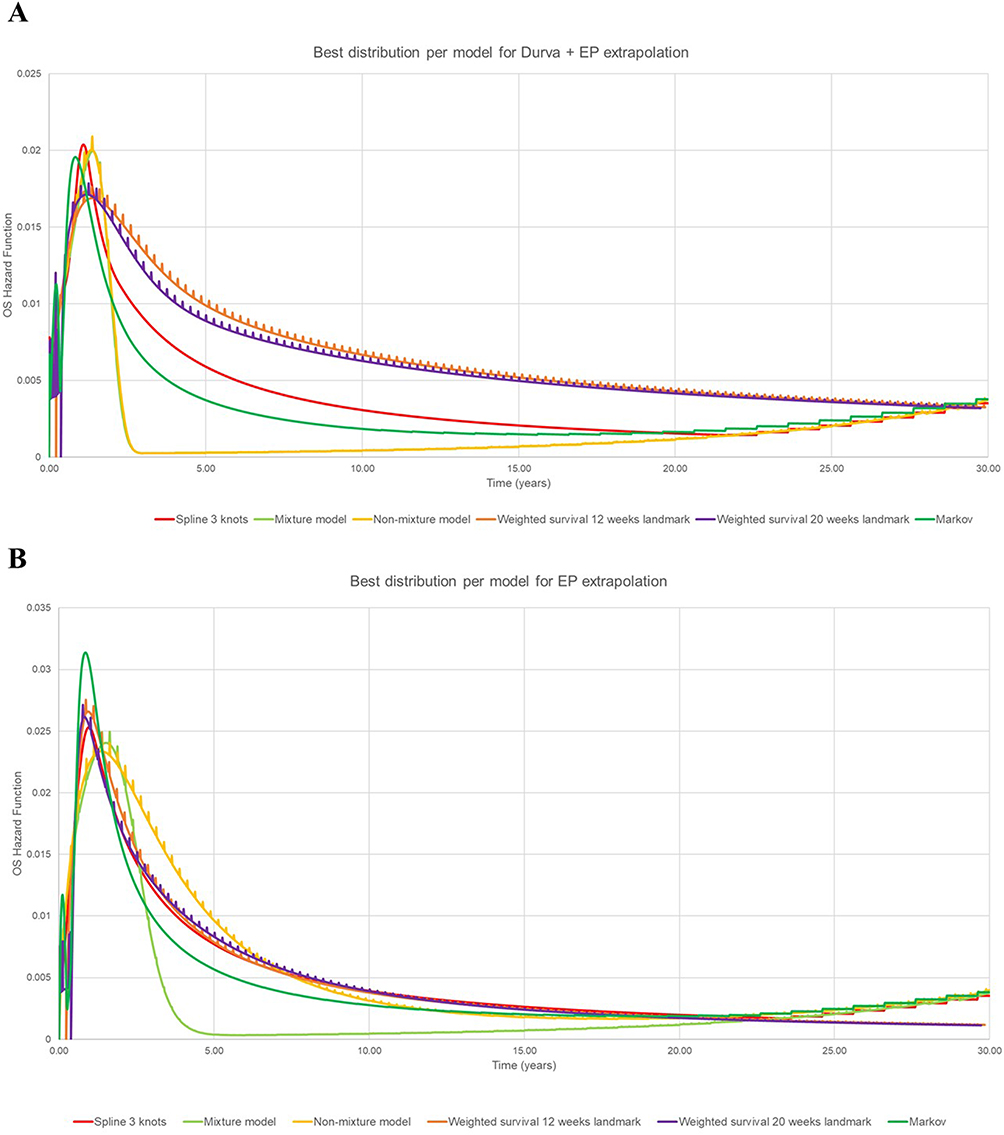 |
Figure 1 Hazard plots for proposed approaches. (A) Durvalumab plus etoposide and platinum; (B) etoposide and platinum. Abbreviations: Durva, Durvalumab; EP, Etoposide and platinum. |
We selected the following distributions for each approach: log-logistic for both treatment arms in the standard parametric approach; spline-odds 3 knots for the splines approach; log-normal and Weibull for the responders and non-responders, respectively, for the durvalumab plus EP landmark model, while the EP arm had the generalized gamma and exponential distributions; Gompertz and Weibull for the durvalumab plus EP arm and EP arm, respectively, in the mixture cure model approach; and Gompertz and log-logistic for the durvalumab plus EP arm and EP arm, respectively, in the non-mixture cure model approach. Detailed justifications for the selection of the best distribution for OS extrapolation of the 2-year data for each model per treatment arm are provided in Table 2.
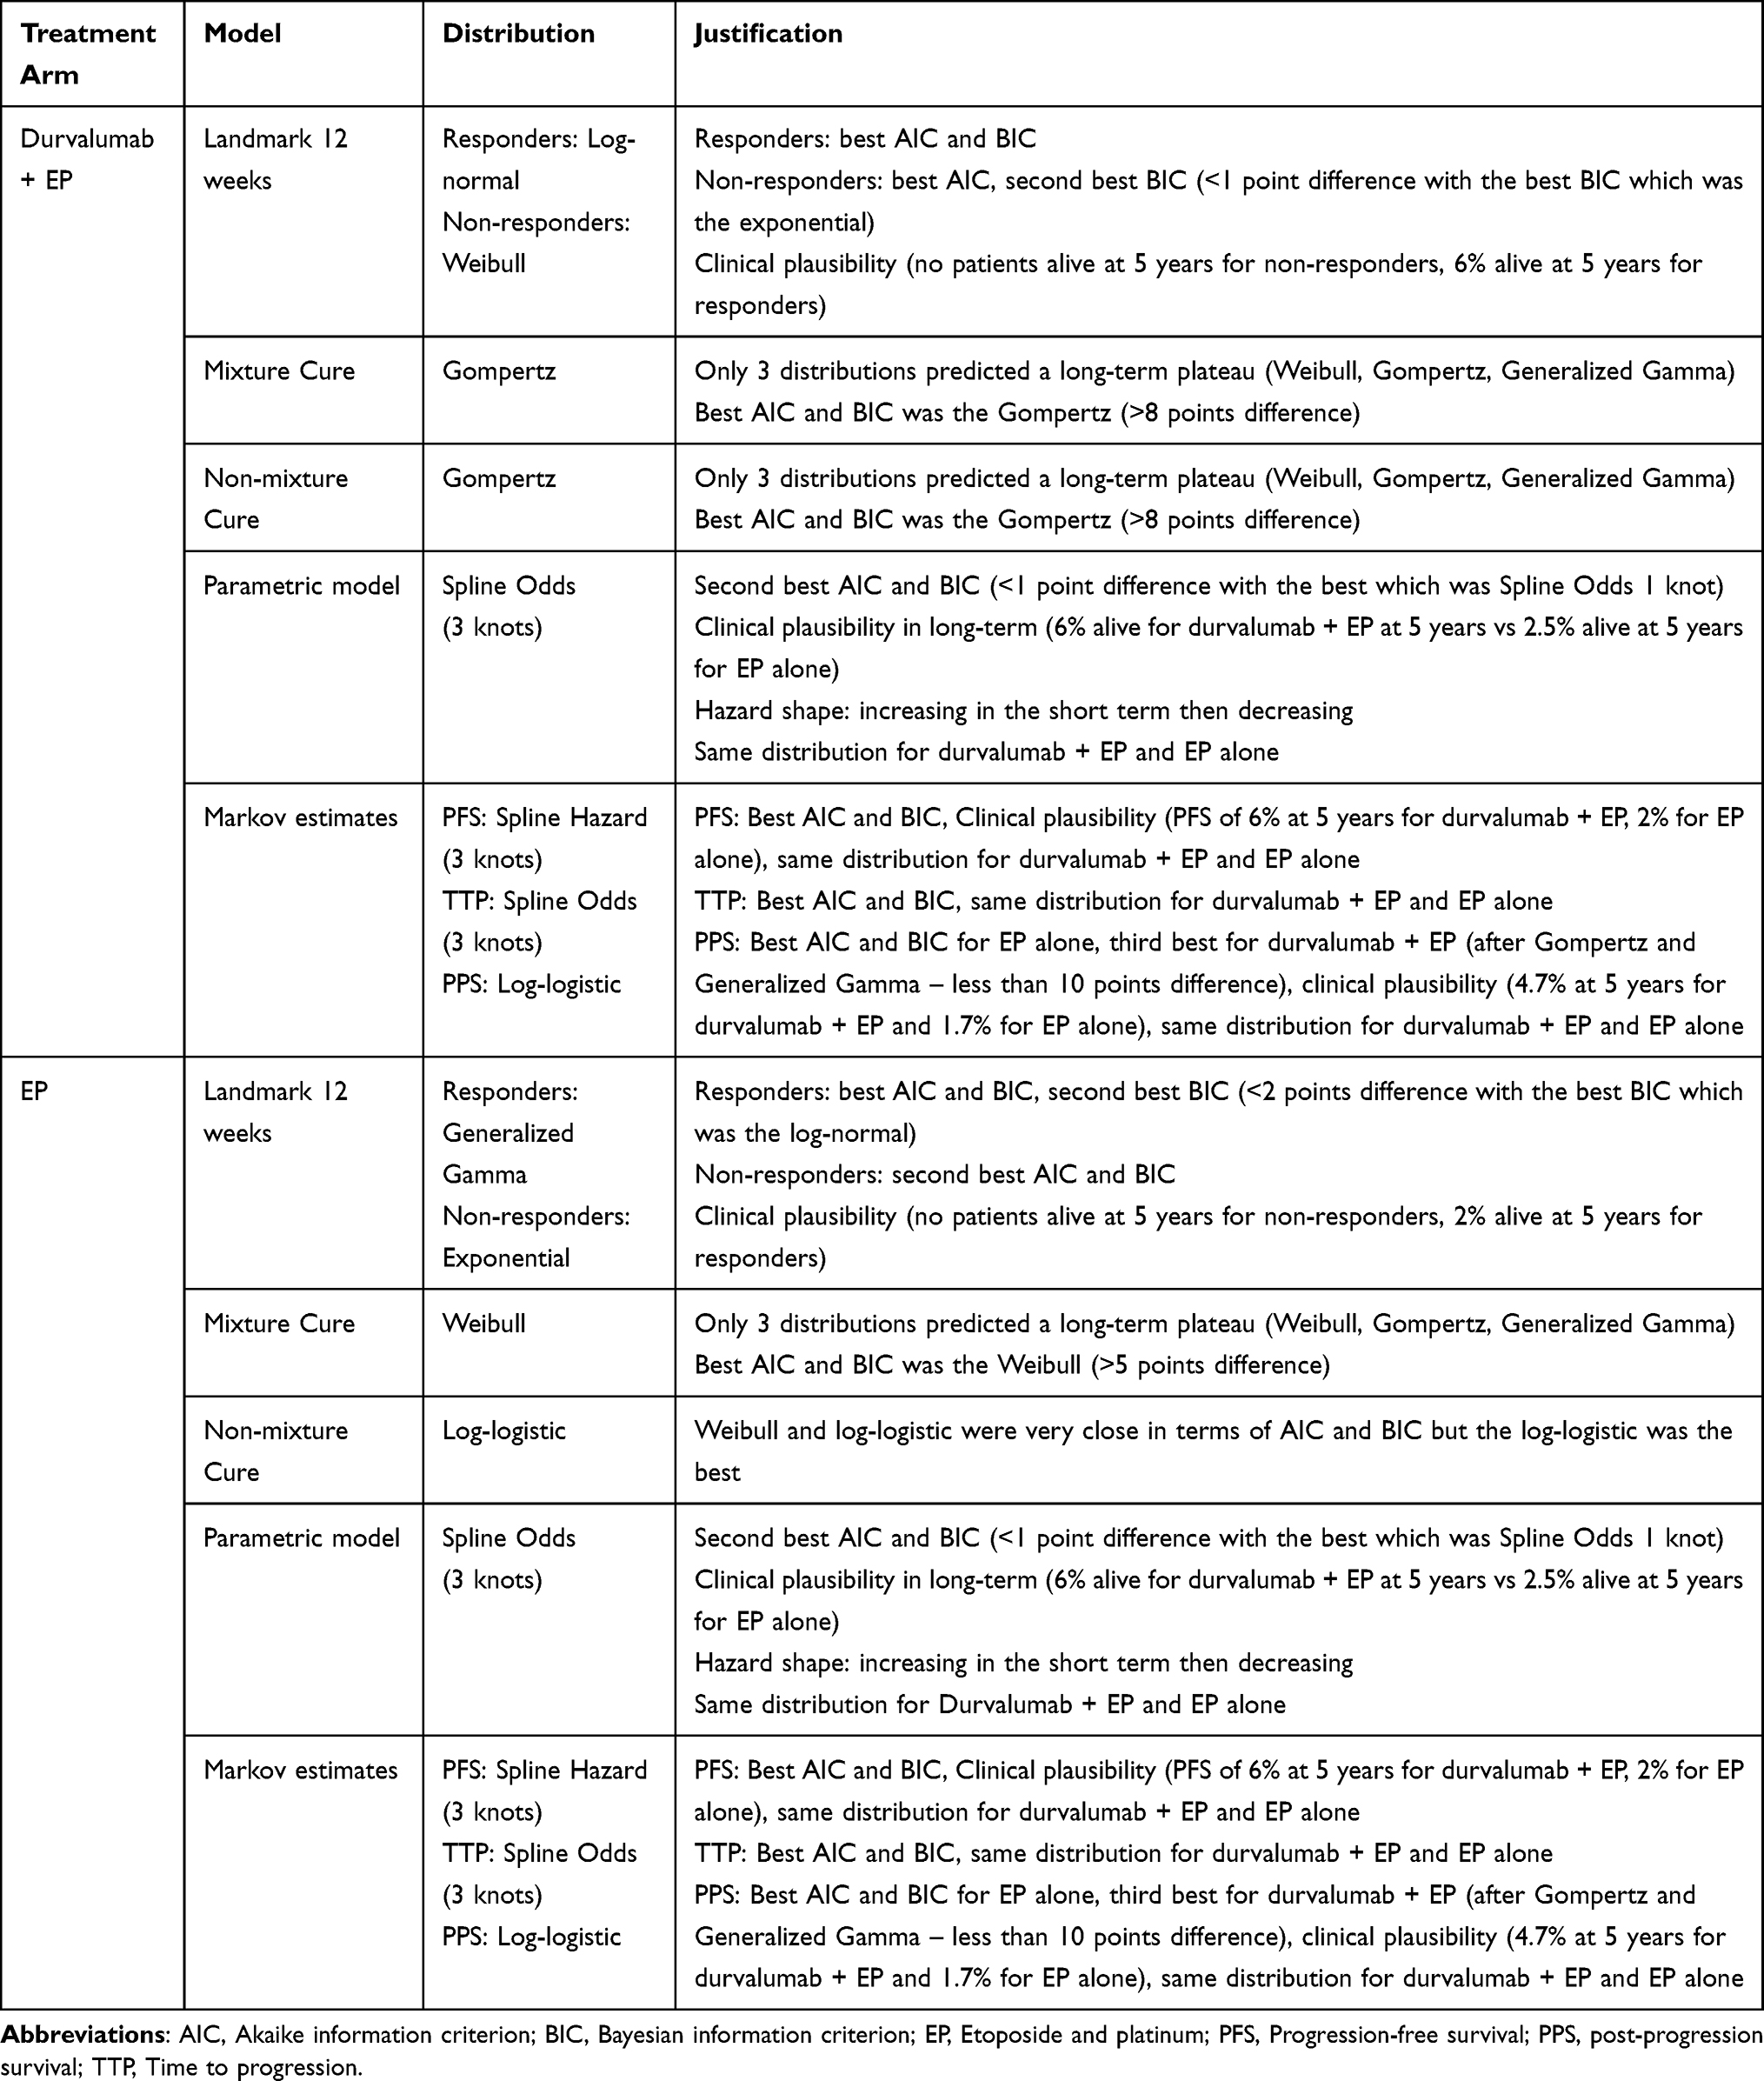 |
Table 2 Distribution Selection and Justification for All Approaches |
Modelling Long-Term OS in the Durvalumab Plus EP Arm
The 3- and 5-year survival estimates obtained through each modeling approach are presented in Table 3 and visual fits for all approaches are presented in Figure 2, including the KM OS survival data from the CASPIAN trial.
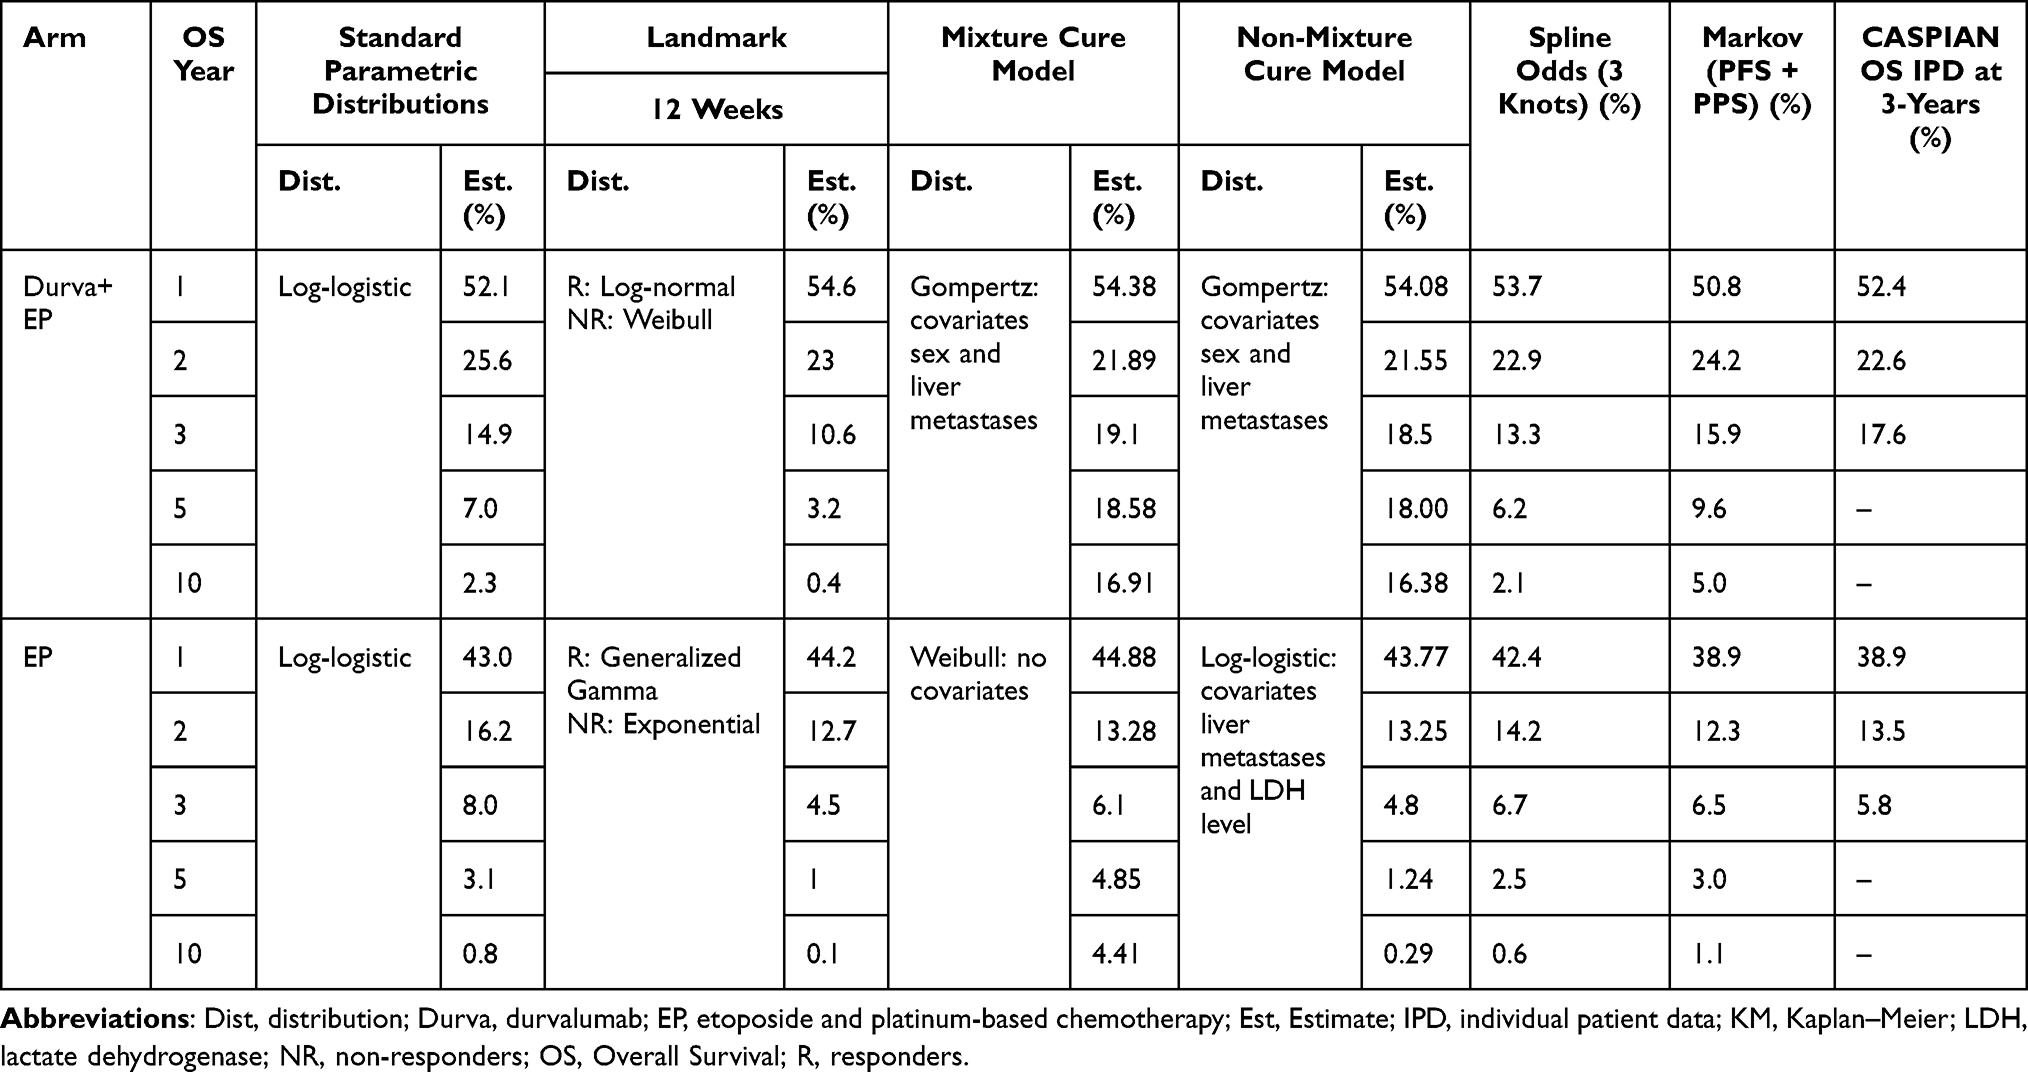 |
Table 3 Overall Survival Extrapolation Estimates Compared to 3-Year Data from the CASPIAN Trial |
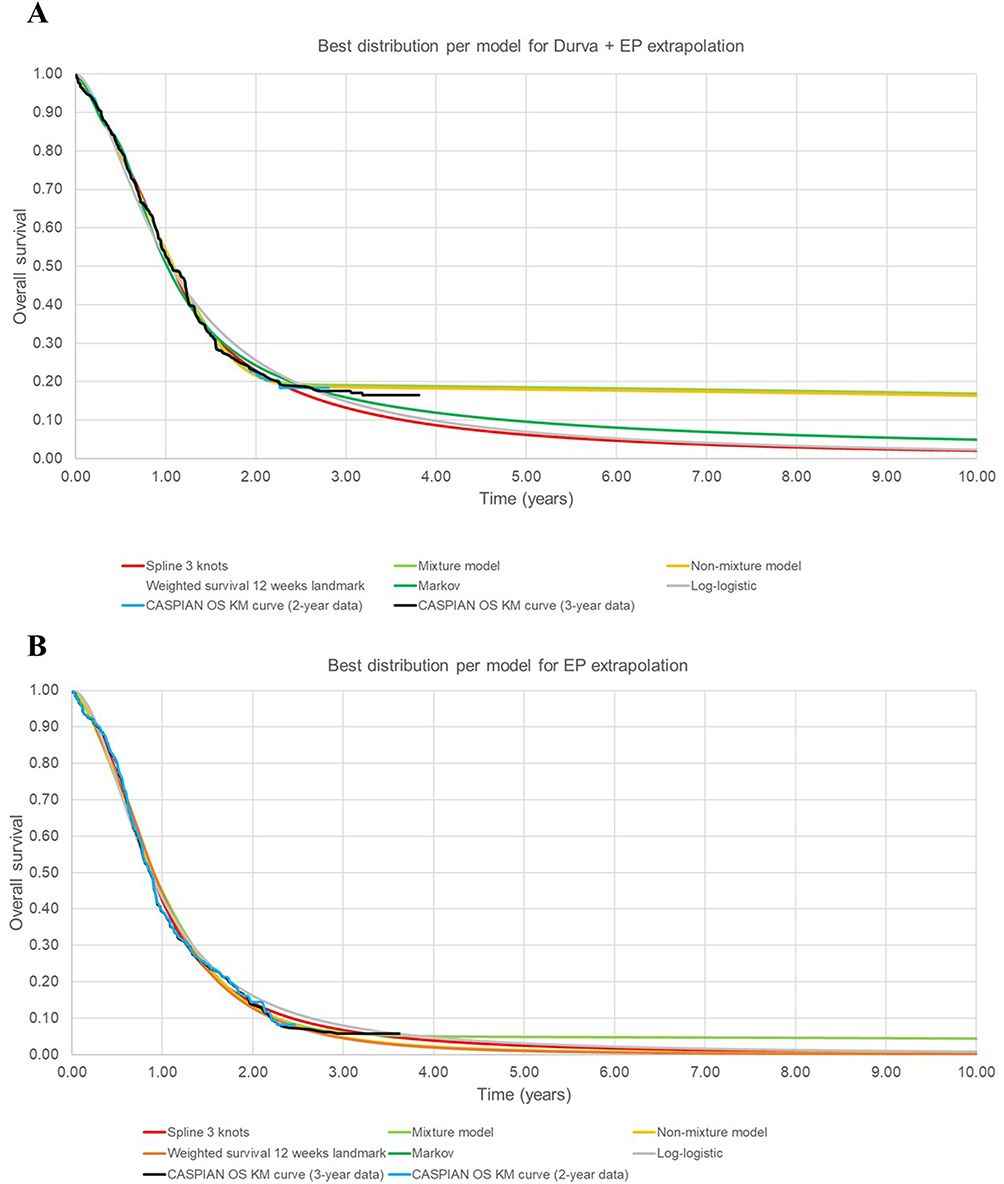 |
Figure 2 Best distribution for each approach. (A) Durvalumab plus etoposide and platinum overall survival and (B) etoposide and platinum overall survival. Abbreviations: KM, Kaplan–Meier; OS, Overall Survival. |
The 3- and 5-year OS estimates for the durvalumab plus EP arm for the standard parametric distribution (log-logistic) are 14.9% and 7.0%, respectively. For the Markov model in the same treatment arm, 3- and 5-year OS estimates were 15.9% and 9.6%, respectively.
Among the more flexible approaches, there were general trends for the durvalumab plus EP arm, although the models underestimated survival at three years, which was 17.6% in the CASPIAN trial.11 For the landmark analysis at 12 weeks, the 3-year estimate was 10.6%, while the spline model (spline odds with 3-knots) 3-year estimate was 13.3%.
On the other hand, the mixture and non-mixture cure models returned 3-year estimates for the durvalumab plus EP arm of 19.1% and 18.5%, respectively. At 5-years, those models return estimates of 18.6% and 18.0% for durvalumab plus EP. In this case, the cure models reflected the real data from the CASPIAN trial better because these models account for the plateau in survival at the tail of the distribution.
Finally, the mean OS for durvalumab plus EP ranged between 1.41 years (landmark 12-week analysis) and 4.81 years (mixture cure model) (Table 4). Restricted mean overall survival at 2 and 3 years are provided in Supplementary Table 1.
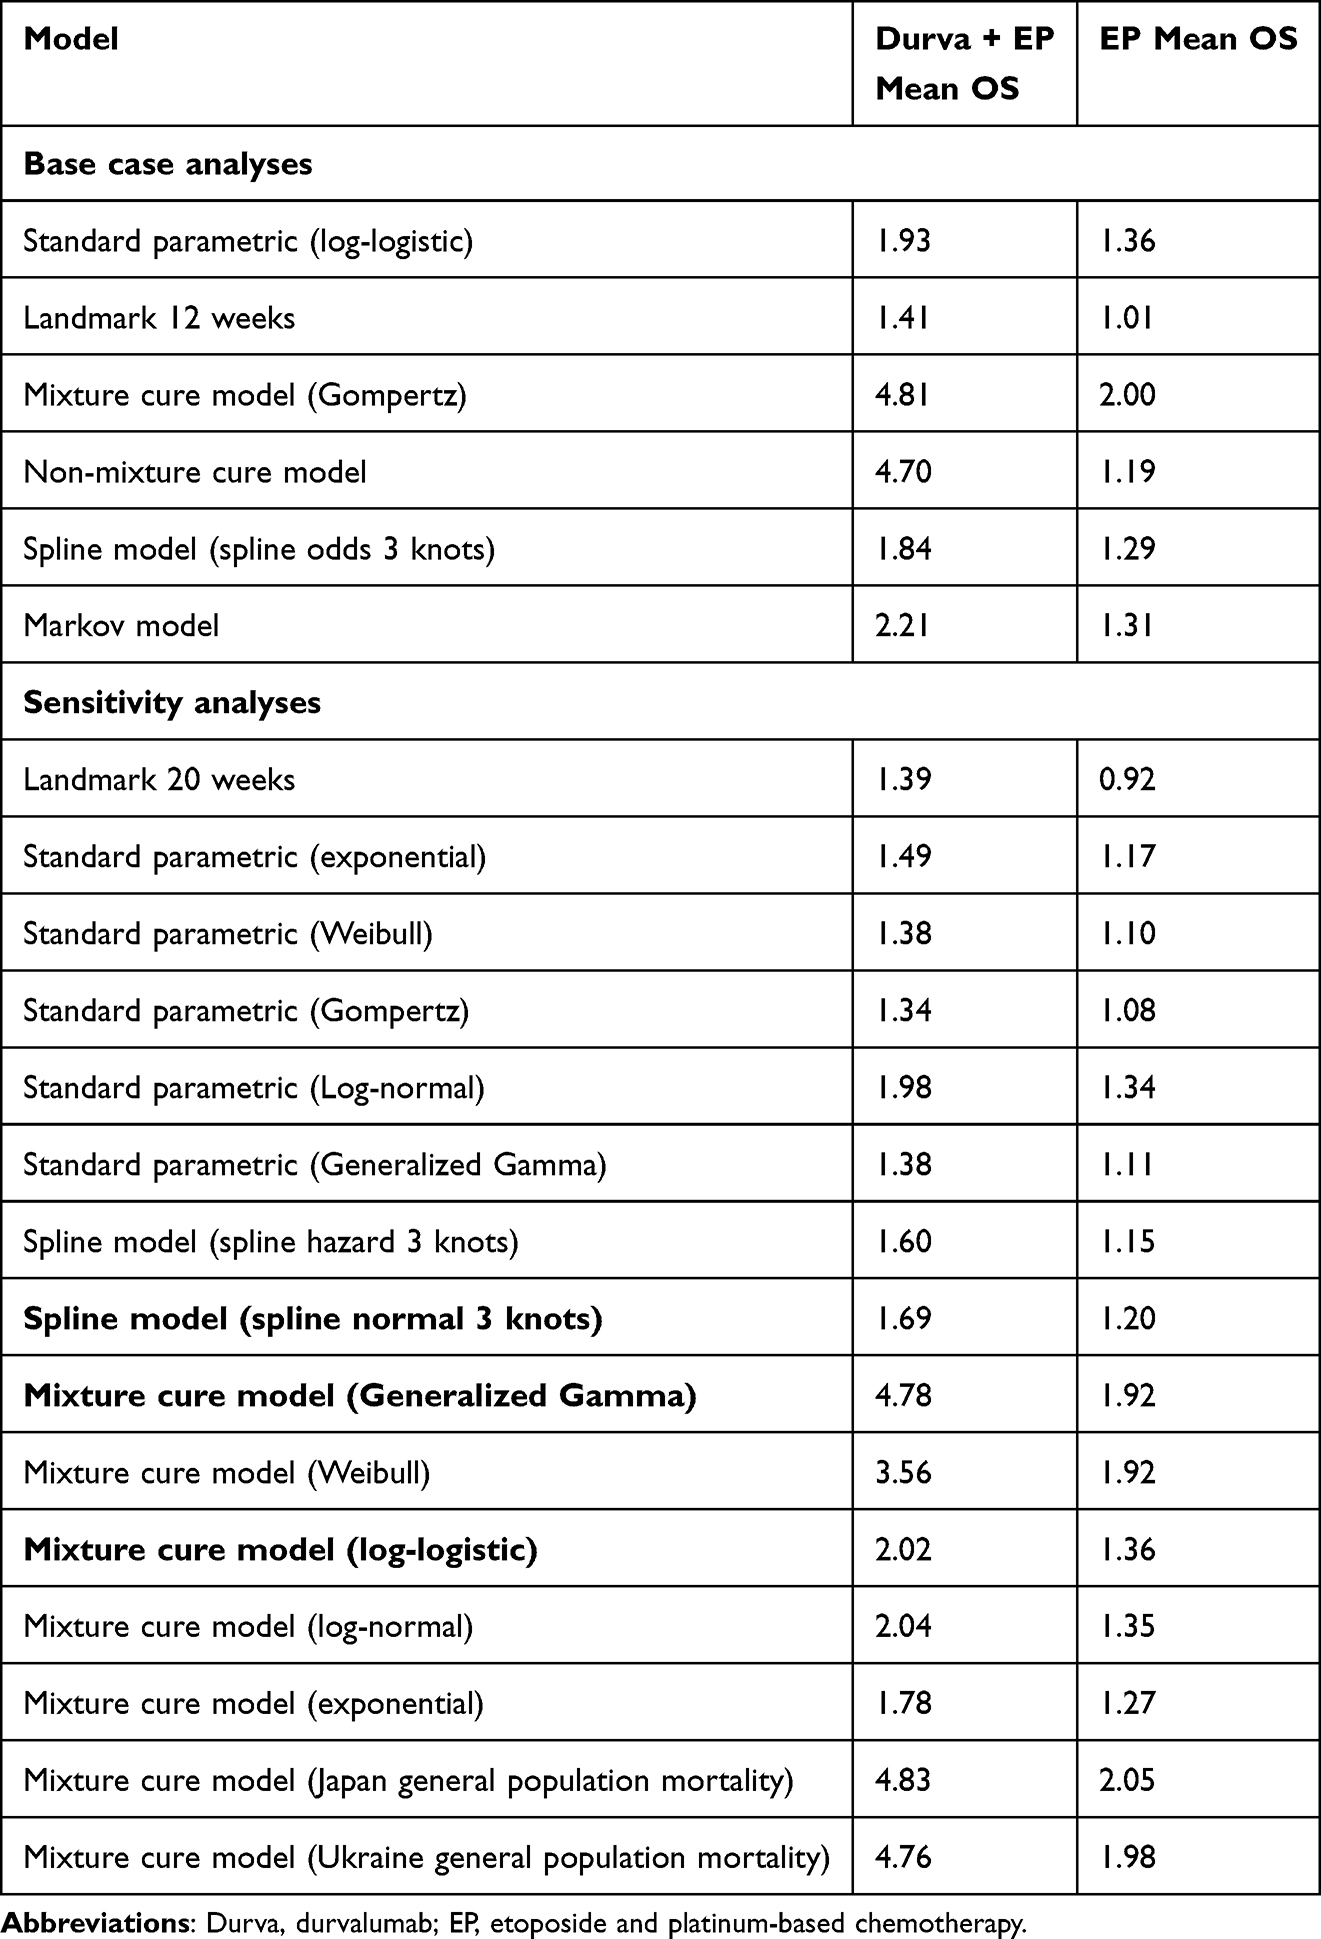 |
Table 4 Mean Overall Survival Calculated Over a 30-Year Time Horizon for Durvalumab Plus Etoposide and Platinum and Etoposide and Platinum Alone |
Modelling Long-Term OS in the EP Alone Arm
A comparison of the modeling approaches for the EP arm was also conducted (Table 3 and Figure 2). Of the common approaches, the 3- and 5-year survival estimates were 7.9% and 3.1% for the standard parametric distribution (log-logistic), respectively. Similarly, the Markov model showed survival estimates of 6.5% and 3.0% at 3- and 5-years, respectively.
When using the more flexible approaches, the 3-year survival estimate for the EP arm from the mixture model (6.1%) is the closest to the observed 3-year OS in the CASPIAN trial (5.8%), followed by the spline (6.7%) and Markov (6.5%) analyses.
Finally, the mean OS estimates over a 30-year time horizon for EP ranged between 1.01 (landmark 12-week analysis) and 2.00 (mixture cure model) – Table 4. The values did not vary as widely as the mean OS estimates of the durvalumab plus EP arm. However, those values vary depending on the distribution chosen. Table 4 presents the mean OS for different distributions tested in sensitivity analyses.
Sensitivity Analyses
Three-year and five-year survival rates for all the sensitivity analyses explored are presented in Supplementary Table 2. Those results show that the survival rates are highly sensitive to the distribution chosen in the cure model settings. Some distributions do not estimate a plateau at the end of the curve. For example, the mixture cure model with the exponential distribution estimates a 3.4% survival at 5 years for patients receiving durvalumab plus EP compared with 19.1% in the mixture cure base case (Gompertz). For traditional distributions, the sensitivity analyses do not show a high variability of the survival rates.
Mean OS for the sensitivity analyses is presented in Table 4. For traditional extrapolations, the estimated mean OS is not highly sensitive to the distribution chosen (from 1.34 years to 1.98 years for durvalumab plus EP and from 1.08 to 1.36 for EP alone). However, for more complex methods such as cure models, the distribution had an important impact on the results (mean OS from 1.78 years to 4.81 for durvalumab plus EP and from 1.27 to 2.00 for EP alone). In contrast, the baseline country used in the general population mortality parameter required in this model did not considerably impact the expected mean OS. The other methods tested also showed high variability in the mean OS depending on the assumption. For example, the landmark method estimated a lower mean OS for both durvalumab plus EP and EP alone when a landmark point of 20 weeks was considered (instead of the 12 weeks that was considered in the base case).
Discussion
This study aims to highlight the challenges that are present when modeling survival beyond clinical trial horizons. Given the influence of OS (a long-term outcome with uncertainty) on the estimation of quality-adjusted life years (QALYs) and incremental cost-effectiveness ratios (ICERs), it is important to not only ensure that OS predictions made by health economic models are as close as possible to future observed data but that the model selected is also clinically plausible. Furthermore, accurate OS predictions are beneficial for understanding an intervention’s impact on long-term clinical outcomes in general. In line with previous studies, our work highlights the importance of comparing multiple extrapolation methods and cross-checking the survival estimates obtained through these methods with external and observed data as well as clinical opinion.17,21,22
A study was found, Khakwani et al,23 which examined survival trends in patients with SCLC treated with chemotherapy in England, reported a survival rate of about 5% at 5 years. For the EP arm, our results from the spline, landmark, and cure models seemed to align with the estimates projected by the literature (1–3%), as our analyses estimated 5-year OS to be between 1.0% and 4.9% depending on the model used.
When assessing fit to the trial data, all models used provided a reasonable fit to the observed 3-year data from CASPIAN. Additionally, the sensitivity analyses for the different approaches found that most curves fitted adequately to the KM curves for OS. However, upon considering the clinical plausibility of the models, each model had its strength and limitations regarding the assumptions made.
The cure models (both mixture and non-mixture) had the best predictive ability when compared to the 3-year data. They also provide the largest accumulated life-year gains over 15 years compared to other approaches because estimates for the mean survival for durvalumab plus EP in this approach were consistently high. The relative better fit observed for these models compared to other approaches can be attributed to the fact that cure models account for patient heterogeneity within the clinical trial, though other methods such as the landmark model also consider heterogeneity in survival experience (responders and non-responders). Yet, not all the distributions estimated a long-term plateau within the cure framework, and long-term survival was overestimated in some cases despite the addition of general population mortality to the model. While the cure models demonstrated the best predictive ability at 3 years, when considering the plausibility of the model, the assumptions made need to be clinically valid, including clinical evidence to show that long-term survival is heterogeneous. An inaccurate estimation of the cure fraction may result in long-term survival predictions that are not clinically plausible and as ES-SCLC is a very aggressive disease, it is not possible to know if the sustained survival estimated by the cure models will be seen in real-world populations, especially without availability of more mature clinical trial data for comparison.
Following the cure models, the spline models and the Markov approach were the second-best models in terms of predictive ability compared to the 3-year data. Although the spline models can apply “knots” that can model more complex trends seen in the survival data, the added complexity makes clinical interpretation of the spline model challenging. Conversely, the Markov approach models PFS and OS such that they are explicitly related. However, the model necessitates the use of more mature data for the PFS (with a clear plateau), which directly impacts the OS (a plateau in the OS estimation), resulting in an estimate that is close to the observed 3-year data. In the context of clinical plausibility, the Markov approach may align more with clinical expectations despite difficulties with modelling post-progression survival data from clinical trials, such as the non-randomised nature of patients once they progress.
The landmark models were less accurate when estimating long-term survival as they did not anticipate the plateau observed in the CASPIAN trial at three years. The results obtained with this approach were driven by the extrapolation of OS estimates for non-responders because of the higher number of patients in this group. Consequently, the model provides more pessimistic survival results compared to the other approaches and the observed 3-year data from the trial, which is expected when working with short-term data. When considering clinical validity, assumptions made by the landmark model result in short-term health status driving long-term survival predictions as survival is dependent on patients’ response status at a landmark point. In this case, responders do not experience the event as early as the non-responders, and the timing of the assessment (12 weeks) may be too early to properly discriminate between prolonged response to treatment resulting in extended survival versus little to no response. This short time frame coupled with the limited event data for responders may have affected the ability of the landmark model to return more nuanced extrapolations of long-term survival. In addition, the model may not properly reflect the long-term benefits of treatments.
It is acknowledged that this study has several limitations. Firstly, our analyses did not consider the potential impact of subsequent treatments on OS. Nevertheless, given the aggressiveness of the disease and the limited efficacy of second-line treatments for patients who progress to first-line therapy, the data reported in the CASPIAN trial are unlikely to be strongly affected by potential subsequent treatments. In addition, though the cure models show promising predictive ability for short-term follow-up survival when compared to the observed 3-year data from CASPIAN and the other modelled approaches, conclusions are subject to further scrutiny once more mature data are available. Another limitation of this study is associated with the utilization of complex methods, which rely on underlying clinical assumptions that should be considered carefully. For instance, cure models presuppose the possibility of patients being cured from the disease. Additionally, the Markov approach implies an automatic correlation between the gain in PFS and OS in patients. Finally, results cannot be generalized to other indications.
Extrapolations are necessary to support HTA decision-making, especially where trial data with short follow-up period for novel therapies such as immunotherapies may not reflect the long-term benefit of treatment. Complex models may result in better extrapolations; however, beyond the statistical goodness-of-fit, the clinical plausibility of the predictions should be considered. Overall, our results demonstrate the importance of adopting a multi-faceted approach including clinical perspective when selecting the most appropriate and plausible model. In this study, cure models demonstrated the most accurate estimate of the CASPIAN 3-year OS data; however, there are other models that may be more appropriate and clinically more plausible longer term. Echoing similar remarks from the recent NICE DSU guidelines: health economic modelers should consider all relevant approaches and compare generated long-term survival extrapolations to the literature in order to draw conclusions.2 In addition to providing researchers with insights into advanced techniques for survival extrapolation, this study also encourages consideration of the plausibility and limitations of employing each technique.
Conclusion
While it is tempting to think that increasing model complexity leads to a higher-quality model with better predictive power, its applicability in the context of modelling OS in an aggressive cancer like ES-SCLC remains uncertain. The CASPIAN study showed a flattening of the OS curve from the two-year to the three-year data-cut, and with the exception of the cure models, all models fitted to the two-year data underestimated three-year OS. There were also substantial differences in the long-term OS extrapolations of the models assessed, which will have an impact when assessing long-term costs and benefits of ES-SCLC treatments for economic evaluations. The more complex models such as cure models attempt to better represent the underlying method of action of immunotherapy treatment and yielded the best predictions of OS at three years; however, it is unclear whether longer term survival predictions estimated by these models will be more accurate than those obtained using simpler or standard models. Hence, it is vitally important to assess if there is the clinical basis and evidence to justify the use of more complex approaches to model survival, which will vary across different disease areas and stages, as well depending on the data that are available. Additionally, limitations around the generalizability of the model and the impact of subsequent treatments received after progression should be considered with each approach. Further research, including the use of more mature OS data for IO treatments in ES-SCLC, is still needed.
Data Sharing Statement
The datasets generated during and/or analysed during the current study are not publicly available to protect commercial-in-confidence information.
Ethics Approval and Informed Consent
Previously published data was used for the study and involved no interaction with actual patients.
Acknowledgments
All authors made a significant contribution to the work reported, whether that is in the conception, study design, execution, acquisition of data, analysis and interpretation, or in all these areas; took part in drafting, revising or critically reviewing the article; gave final approval of the version to be published; have agreed on the journal to which the article has been submitted; and agree to be accountable for all aspects of the work. Victor Genestier and Hélène Cawston were responsible for the statistical analysis plan and the data analysis.
Funding
This study was funded by AstraZeneca. The sponsor was involved in data collection, data analysis and manuscript preparation. Amaris received a consultancy fee from AstraZeneca to support this analysis and develop the manuscript. Medical writing was funded by AstraZeneca and provided by Amaris.
Disclosure
Victor Genestier and Hélène Cawston are employees of Amaris. Sukhvinder Johal is an employee of AstraZeneca and reports stock ownership in AstraZeneca. Lance Brannman is a former employee of AstraZeneca and reports stock ownership in AstraZeneca. He is now affiliated with the University of Utah, College of Pharmacy, Pharmacotherapy Outcomes Research Center, Salt Lake City, UT, USA. The authors report no other conflicts of interest in this work.
References
1. Latimer N. NICE DSU technical support document 14: survival analysis for economic evaluations alongside clinical trials-extrapolation with patient-level data. Report by the Decision Support Unit; 2011.
2. Rutherford MJ, Lambert PC, Sweeting MJ, et al. NICE DSU technical support document 21. In: Flexible Methods for Survival Analysis. Leicester, UK: Department of Health Sciences, University of Leicester; 2020:1–97.
3. Carta A, Conversano C. On the use of Markov models in pharmacoeconomics: pros and cons and implications for policy makers. Front Public Health. 2020;8:569500. doi:10.3389/fpubh.2020.569500
4. Larkin J, Chiarion-Sileni V, Gonzalez R, et al. Five-year survival with combined nivolumab and ipilimumab in advanced melanoma. N Engl J Med. 2019;381(16):1535–1546. doi:10.1056/NEJMoa1910836
5. Damuzzo V, Agnoletto L, Leonardi L, Chiumente M, Mengato D, Messori A. Analysis of survival curves: statistical methods accounting for the presence of long-term survivors. Front Oncol. 2019;9:453. doi:10.3389/fonc.2019.00453
6. Basumallik N, Agarwal M. Small cell lung cancer. In: StatPearls. StatPearls Publishing; 2023. Available from: http://www.ncbi.nlm.nih.gov/books/NBK482458/.
7. Demedts IK, Vermaelen KY, Meerbeeck JPV. Treatment of extensive-stage small cell lung carcinoma: current status and future prospects. Eur Respir J. 2010;35(1):202–215. doi:10.1183/09031936.00105009
8. Dingemans AM, Früh M, Ardizzoni A, et al. Small-cell lung cancer: ESMO Clinical Practice Guidelines for diagnosis, treatment and follow-up☆. Ann Oncol. 2021;32(7):839–853. doi:10.1016/j.annonc.2021.03.207
9. Horn L, Mansfield AS, Szczęsna A, et al. First-line atezolizumab plus chemotherapy in extensive-stage small-cell lung cancer. N Engl J Med. 2018;379(23):2220–2229. doi:10.1056/NEJMoa1809064
10. Paz-Ares L, Dvorkin M, Chen Y, et al. Durvalumab plus platinum–etoposide versus platinum–etoposide in first-line treatment of extensive-stage small-cell lung cancer (CASPIAN): a randomised, controlled, open-label, phase 3 trial. Lancet. 2019;394(10212):1929–1939. doi:10.1016/S0140-6736(19)32222-6
11. Paz-Ares L, Chen Y, Reinmuth N, et al. Durvalumab, with or without tremelimumab, plus platinum-etoposide in first-line treatment of extensive-stage small-cell lung cancer: 3-year overall survival update from CASPIAN. ESMO open. 2022;7(2):100408. doi:10.1016/j.esmoop.2022.100408
12. Saida Y, Watanabe S, Kikuchi T. Extensive-stage small-cell lung cancer: current landscape and future prospects. Onco Targets Ther. 2023;16:657–671. doi:10.2147/OTT.S272552
13. Goldman JW, Dvorkin M, Chen Y, et al. Durvalumab, with or without tremelimumab, plus platinum–etoposide versus platinum–etoposide alone in first-line treatment of extensive-stage small-cell lung cancer (CASPIAN): updated results from a randomised, controlled, open-label, phase 3 trial. Lancet Oncol. 2021;22(1):51–65. doi:10.1016/S1470-2045(20)30539-8
14. Lambert PC. Modeling of the cure fraction in survival studies. Stata J. 2007;7(3):351–375. doi:10.1177/1536867X0700700304
15. Palmer S, Borget I, Friede T, et al. A guide to selecting flexible survival models to inform economic evaluations of cancer immunotherapies. Value Health. 2022;26(2):185–192.
16. Dafni U. Landmark analysis at the 25-year landmark point. Circ Cardiovasc Qual Outcomes. 2011;4(3):363–371. doi:10.1161/CIRCOUTCOMES.110.957951
17. Smare C, Lakhdari K, Doan J, Posnett J, Johal S. Evaluating partitioned survival and Markov decision-analytic modeling approaches for use in cost-effectiveness analysis: estimating and comparing survival outcomes. Pharmacoeconomics. 2020;38(1):97–108. doi:10.1007/s40273-019-00845-x
18. AstraZeneca. Clinical study report - a Phase III, randomized, multicenter, open-label, comparative study to determine the efficacy of durvalumab or durvalumab and tremelimumab in combination with platinum-based chemotherapy for the first-line treatment in patients with Extensive Disease Small-Cell Lung Cancer (SCLC) (CASPIAN); 2019.
19. Johal S, Fischer C, Cawston H, Jiang H, Brannman L. The impact of response on survival in extensive-stage small-cell lung cancer in the CASPIAN study.
20. Eisenhauer EA, Therasse P, Bogaerts J, et al. New response evaluation criteria in solid tumours: revised RECIST guideline (version 1.1). Eur J Cancer. 2009;45(2):228–247. doi:10.1016/j.ejca.2008.10.026
21. Ouwens M, Mukhopadhyay P, Zhang Y, Huang M, Latimer N, Briggs A. Estimating lifetime benefits associated with immuno-oncology therapies: challenges and approaches for overall survival extrapolations. Pharmacoeconomics. 2019;37(9):1129–1138. doi:10.1007/s40273-019-00806-4
22. van OI, Ouwens M, Remiro-Azócar A, et al. Comparison of parametric survival extrapolation approaches incorporating general population mortality for adequate health technology assessment of new oncology drugs. Value Health. 2021;24(9):1294–1301. doi:10.1016/j.jval.2021.03.008
23. Khakwani A, Rich AL, Tata LJ, et al. Small-cell lung cancer in England: trends in survival and chemotherapy using the National Lung Cancer Audit. PLoS One. 2014;9(2):e89426. doi:10.1371/journal.pone.0089426
 © 2024 The Author(s). This work is published and licensed by Dove Medical Press Limited. The full terms of this license are available at https://www.dovepress.com/terms.php and incorporate the Creative Commons Attribution - Non Commercial (unported, v3.0) License.
By accessing the work you hereby accept the Terms. Non-commercial uses of the work are permitted without any further permission from Dove Medical Press Limited, provided the work is properly attributed. For permission for commercial use of this work, please see paragraphs 4.2 and 5 of our Terms.
© 2024 The Author(s). This work is published and licensed by Dove Medical Press Limited. The full terms of this license are available at https://www.dovepress.com/terms.php and incorporate the Creative Commons Attribution - Non Commercial (unported, v3.0) License.
By accessing the work you hereby accept the Terms. Non-commercial uses of the work are permitted without any further permission from Dove Medical Press Limited, provided the work is properly attributed. For permission for commercial use of this work, please see paragraphs 4.2 and 5 of our Terms.