")
Back to Journals » Nanotechnology, Science and Applications » Volume 16
Cell Line-Dependent Adhesion and Inhibition of Proliferation on Carbon-Based Nanofilms
Authors Wójcik B, Zawadzka K, Sawosz E, Sosnowska M , Ostrowska A , Wierzbicki M
Received 7 September 2023
Accepted for publication 22 November 2023
Published 14 December 2023 Volume 2023:16 Pages 41—57
DOI https://doi.org/10.2147/NSA.S439185
Checked for plagiarism Yes
Review by Single anonymous peer review
Peer reviewer comments 2
Editor who approved publication: Professor Kattesh Katti
Barbara Wójcik, Katarzyna Zawadzka, Ewa Sawosz, Malwina Sosnowska, Agnieszka Ostrowska, Mateusz Wierzbicki
Department of Nanobiotechnology, Institute of Biology, Warsaw University of Life Sciences, Warsaw, 02-786, Poland
Correspondence: Mateusz Wierzbicki, Department of Nanobiotechnology, Institute of Biology, Warsaw University of Life Sciences, Ciszewskiego 8, Warsaw, 02-786, Poland, Tel +48 22 5936676, Email [email protected]
Introduction: Disorganisation of the extracellular matrix (ECM) is strongly connected to tumor progression. Even small-scale changes can significantly influence the adhesion and proliferation of cancer cells. Therefore, the use of biocompatible nanomaterials capable of supporting and partially replenishing degraded ECM might be essential to recover the niche after tumor resection. The objective of this study was to evaluate the influence of graphene, graphene oxide, fullerene, and diamond nanofilms on breast cancer and glioblastoma grade IV cell lines.
Methods: Nanomaterials were characterized using SEM and TEM techniques; zeta potential analysis was also performed. Nanofilms of graphene, fullerene, and diamond nanoparticles were also characterized using AFM. The toxicity was tested on breast cancer MDA.MB.231 and glioblastoma grade IV U-87 MG cell lines, using LDH assay and by counting stained dead cells in bioprinted 3D models. The following parameters were analyzed: proliferation, adhesion to the nanofilm, and adhesion to particular ECM components covered with diamond nanoparticles.
Results and Discussion: Our studies demonstrated that nanofilms of graphene and diamond nanoparticles are characterized by cell-specific toxicity. Those nanomaterials were non-toxic to MDA.MB.231 cells. After applying bioprinted 3D models, diamond nanoparticles were not toxic for both cell lines. Nanofilms made of diamond nanoparticles and graphene inhibit the proliferation of MDA.MB.231 cells after 48 and 72 hours. Increased adhesion on nanofilm made of diamond nanoparticles was only observed for MDA.MB.231 cells after 30 and 60 minutes from seeding the cells. However, analysis of adhesion to certain ECM components coated with diamond nanoparticles revealed enhanced adhesion to tenascin and vitronectin for both tested cell lines.
Conclusion: Our studies show that nanofilm made of diamond nanoparticles is a non-toxic and pro-adhesive nanomaterial that might stabilize and partially replenish the niche after breast tumor resection as it enhances the adhesion of breast cancer cells and inhibits their proliferation.
Keywords: 3D models, breast cancer, carbon-based nanomaterials, cytotoxicity, glioblastoma
Introduction
Triple-negative breast cancer is the most aggressive malignant subtype of breast cancer.1 It accounts for around 15–20% of all cases diagnosed.2 It is characterized by a strong tendency to early metastasis (approximately 2–3 years after diagnosis).3 Although cancer treatment is still developing and new therapeutic strategies are being optimized, the prognosis for patients with triple-negative breast cancer is still poor.4 Over half a million deaths annually are caused by breast cancer.5 Although cancer diagnosis is also developing and new tools are being developed that enable early diagnosis, metastases are still difficult to inhibit and manage clinically.6 Another tumor considered one of the most difficult to treat is a primary brain tumor – glioblastoma. It is difficult to manage clinically due to its proliferative and highly invasive nature.7 The median survival time of patients who suffer from this kind of tumor, regardless of treatment, is 12.6 months.8 Thus, there is an urgent need to inhibit tumor growth.
Many patients, after tumor resection, develop recurrences of the disease. It is believed that newly arisen tumors are derived from selected tumor clones that are resistant to the applied therapy.9 At this point, it should be noted that circulatory tumor cells that can shed from primary tumors10 and cancer stem cells that promote initiation, proliferation, migration, and drug resistance of solid cancers may be present in pathologically changed tissue.11 However, according to the literature, after tumor resection, the remaining cells are characterized by a few phenotypical differences, which have been hypothesized to be a possible cause of cancer recurrence. Surgical removal of the tumor mass promotes the secretion of inhibitory factors, which cause the activation of immunosuppressive cells to allow rapid repopulation of small pockets of residual disease. Moreover, the infiltration of residual lymph nodes and recurrent tumors with M2 macrophages and CD4+Foxp3+ regulatory T cells is observed. These factors create a complex network of immunosuppression in the surrounding microenvironment, which may underline cancer recurrence.9 Another important factor in cancer development is the extracellular matrix (ECM), which is the non-cellular component of tissue. Its role is not only to provide structural support ensuring tissue integrity,12 but it is also a physiologically active structure that provides all the essential molecules that regulate cell-to-cell communications.13 ECM is produced and arranged by resident cells; it is a highly dynamic structure that can be remodeled in accordance with tissue needs or as a result of disease progression.12 The first step in the metastasis process is the invasion of malignant cells. For this phenomenon to be possible, the adhesion of cells to the ECM must be disturbed,14 which is strongly connected with the disorganization of the unique ECM.15 This indicates that ECM plays a crucial role in cancer progression. Even small-scale changes in the tissue-specific microenvironment homeostasis can significantly influence the proliferation of cancer cells. Numerous changes in the ECM, such as increased levels of collagens I, III, IV, and fibronectin, indicate that tumor progression is based on the complex interactions of cancer cells and tumor microenvironment.16 Higher levels of matrix proteins may contribute to changes in cell polarity and cell-to-cell adhesion.17 For that reason, the use of nanomaterials capable of supporting and partially replenishing degraded ECM might be essential to restore the niche after tumor resection.
Nanomaterials such as graphene (GN), graphene oxide (GO), fullerene (C60), and diamond nanoparticles (ND) can form nanofilms.18–21 However, the biosafety of the chosen carbon-based nanomaterials is the most pressing issue while designing potential biological applications. According to the literature, GN in colloidal suspension may induce cell death through caspase-mediated and caspase-independent pathways. The induction of oxidative stress is pointed out as a main process underlying the cytotoxicity of this nanomaterial. However, Fahmi et al demonstrated that GN may be capable of inducing irreparable DNA fragmentation produced by endogenous cellular endonucleases.22 GO in colloidal suspension may also induce time- and dose-dependent toxicity at the concentrations higher than 100 mg/L. Wu et al displayed the role of oxidative stress mediated by ROS in the cytotoxicity of GO. Moreover, the scientists also indicated that the arrest in GO/G1 phase after exposure to GO may be engaged in the cell death induction.23 Another nanomaterial that was chosen for analyses also exhibit anticancer properties. Exposure to C60 may cause oxidative stress/ERK-independent cell cycle block in G2/M phase, thus inhibiting cancer cells proliferation. Moreover, C60 is also capable of inducing ROS-mediated necrotic cell damage.24 According to our previous studies, ND cytotoxicity is cell specific.25 The cytotoxicity of this nanomaterial is strongly connected with the increase of ROS level and cytochrome c release.26 Although, the nanomaterials may exhibit some cytotoxicity, carbon-based nanofilms are a source of mechanochemical stimuli that may change cells’ behavior by changing the expression level of proteins involved in the proliferation process, activating ATP synthesis, or lowering the expression of cytoskeleton proteins. Therefore, we hypothesize that nanofilms made of GN, GO, C60, and ND may be capable of promoting proper adhesion and reducing the proliferation rate of breast cancer cells MDA.MB.231 and glioblastoma cells U-87 MG, which would result in a reduction in oncogenic potential and prevention of disease recurrence.
Materials and Methods
Carbon-Based Nanomaterials
Graphene (GN) was obtained from SkySpring Nanomaterials (Houston, TX, USA). Nano-sized platelets were produced by the exfoliation method. According to the manufacturer, the GN flakes’ surface area was 750 m2/g, and their thickness ranged from 1 to 5 nm. Single-layer graphene oxide (GO) was obtained from US Research Nanomaterials (Houston, TX, USA). The material was dispersed in water (2wt%). The diameter of flakes ranged from 1.5 to 5.5 µm and their thickness from 0.43 to 1.23 nm.
Fullerene (C60) was obtained from SES Research (Houston, TX, USA). The material was vacuum oven-dried and, according to the manufacturer, solvent-free. Diamond nanoparticles (ND) were obtained from US Research Nanomaterials (Houston, TX, USA). The nanomaterial was produced using the detonation technique. According to the manufacturer, the average diameter of ND grains was 2–10 nm. GN, GO, C60, and ND were dispersed in ultrapure water to a final concentration of 1000 mg/L. Prior to use, water suspensions of nanomaterials were sonicated for 1 minute (500 W, 32 kHz) using a VC 505 Ultrasonic Liquid Processor with a cup horn (Sonics & Materials, Newtown, CT, USA).
Physicochemical Analysis of Carbon-Based Nanomaterials
The ultrastructure of GN, GO, C60, and ND was analyzed using a JEM-1220 transmission electron microscope (TEM, JEOL, Tokyo, Japan) at 80 KV with a Morada 11-megapixel camera (Olympus Soft Imaging Solutions, Münster, Germany). All nanomaterials were analyzed using atomic force microscopy (AFM) to characterize the surface of the cell culture plate covered with nanomaterials (Nanores, Poland). Additionally, dried nanomaterials were analyzed using a scanning electron microscope (SEM; Quanta 200, FEI, Hillsboro, USA). Additionally, the water contact angle was measured for the tested nanofilms. For that reason 200 µL of water suspensions of GN, GO, C60 and ND were placed on the surface of the cell culture dish (Thermo Fisher Scientific, Waltham, MA, USA) followed by drying under sterile conditions. Subsequently, 50 µL of water was placed at the top of dried nanofilm. The drops were imaged using a horizontal stereoscopic microscope (Delta Optical, Poland). Then the water contact angle was determined using Fiji software.27
A Zetasizer Nano ZS90 analyzer (Malvern, Worcestershire, UK) was used for zeta potential measurements. Zeta potential was measured by laser Doppler electrophoresis (LDE). In addition, the Smoluchowski approximation at 25°C was applied. First of all, chosen nanomaterials were dispersed in ultrapure water to a concentration of 5 mg/L, sonicated at 500 W and 20 kHz for 1 minute using a Vibra-Cell™ Ultrasonic Liquid Processor (Sonics & Materials, Newton, CT, USA), and centrifuged (5 minutes, 1000×g) in order to remove arisen clusters.
Nanofilm Preparation
To assess cell morphology, carbon nanofilm was created on the bottom of 6-well culture plates (Nunc, Thermo Fisher Scientific, Waltham, MA, USA). In each well, there were 10 dots of GN, GO, C60, and ND, respectively, which were made by applying 10 µL of an aqueous suspension of the chosen nanomaterial at 1000 mg/L, followed by drying under sterile conditions.
For membrane integrity, proliferation assessment, and the analysis of cell adhesion, nanofilms were made in a 96-well microplate (Nunc, Thermo Fisher Scientific) by covering the whole surface of the bottom of the well with 50 µL of 1000 mg/L suspensions. Afterward, nanofilms were fully dried under sterile conditions, obtaining the final density of 151.5 µg/cm2.
Cell Lines
Two cancer cell lines were used in the study: glioblastoma U-87 MG and breast cancer MDA.MB.231. They were obtained from ATCC (American Type Culture Collection, Manassas, VA, USA). Both of them were characterized as adherent. The MDA.MB.231 cell line was cultured in Dulbecco’s Modified Eagle’s Medium (DMEM, ATCC) supplemented with 10% fetal bovine serum (FBS, Gibco, Thermo Fisher Scientific, Waltham, MA, USA) and a 1% antibiotic mix (Antibiotic-Antimycotic, Gibco) of penicillin (100 U/mL), streptomycin (100 µg/mL), and Gibco amphotericin B (0.25 µg/mL). The U-87 MG cell line was cultured in Eagle’s Minimum Essential Medium (EMEM, ATCC) supplemented with 10% FBS (Gibco) and a 1% antibiotic mix (Gibco). Both cell lines were maintained at 37°C in a humidified atmosphere containing 5% CO2.
Cells were seeded at a density of 1×10⁵ cells/mL for membrane integrity and LDH-proliferation assays and 3×10⁵ cells/mL for morphological and adhesion analyses. For the cell membrane integrity, proliferation, and adhesion analyses, cells were seeded on a 96-well microplate (Nunc, Thermo Fisher Scientific) in 100 mL of medium per well. For morphological analysis, cells were seeded on a 6-well plate (Nunc, Thermo Fisher Scientific) in 3 mL of medium per well.
Membrane Integrity Assay
A lactate dehydrogenase activity assay (Thermo Fisher Scientific) was performed to evaluate cell membrane integrity. A change in media color, compared to the control group, indicates the leakage of LDH from damaged cells.
For maximum LDH release, lysis buffer was added into the triplet of control wells. After 45 minutes, 50 µL of cell culture media was transferred into a new plate and then mixed with 100 µL of LDH reaction mixture. Spectrophotometer reading was performed after 30 minutes at 490 nm (reference wavelength: 690 nm), using a microplate reader (Tecan Group Ltd., Männedorf, Switzerland). The membrane integrity assay was performed after 24 hours, 48 hours, and 72 hours in 3 independent experiments with 6 replicates for each group.
The results are presented as % of maximum LDH release and were calculated with the formula:
where A is the mean absorbance of the targeted group, and MAX LDH is the mean absorbance of the lysed control group.
Proliferation Assay
After all cells were lysed, the total LDH level was determined in the same way as in the membrane integrity assay. Changes in the level of enzymes relative to a control group indicate changes in the number of cells.
In order to perform proliferation analysis, lysis buffer was added to every well. After 45 minutes, plates were centrifuged (10 minutes, 200 g) to remove clusters of nanomaterials, followed by the transfer of 50 µL of cell culture media into a new plate. The analysis was performed after 24 hours, 48 hours, and 72 hours of cell culture on nanofilms in 3 independent experiments with 6 replicates for each group.
Results are presented as % of control and were calculated with the formula:
where A is the mean absorbance of the targeted group, and C is the mean absorbance of the control group.
Morphological Analysis
For imaging of cell morphology, a Leica DMi8 microscope (Leica Microsystem, Wetzlar, Germany) equipped with a Leica MC 190 HD camera was used.
Analysis of Cell Adhesion
In order to perform adhesion analysis after 30, 60, and 120 minutes from seeding, cells were washed with phosphate-buffered saline (PBS, Thermo Fisher Scientific), followed by the addition of the lysis buffer into every well. After 45 minutes, plates were centrifuged (10 minutes, 200 g) to remove clusters of nanomaterials, followed by the transfer of 50 µL of cell culture media into a new plate. The analysis was performed in 3 independent experiments with 6 replicates for each group.
Results are presented as % of control and were calculated with the formula:
where A is the mean absorbance of the targeted group, and C is the mean absorbance of the control group.
Analysis of Cell Adhesion to Selected Components of the Extracellular Matrix Covered with Diamond Nanoparticles
The ECM Cell Adhesion Array (Merck KGaA, Darmstadt, Germany) was performed in order to evaluate cell adhesion to selected components of the extracellular matrix covered with ND. The test is based on colorimetric measurement and was performed on a 96-well plate. Each well was pre-coated with different ECM proteins (collagen I, collagen II, collagen IV, fibronectin, laminin, tenascin, and vitronectin). After rehydration of wells, 100 µL of ND solution in PBS at the concentration of 100 mg/L (tested group) and PBS (control group) was added into appropriate wells and incubated for 5 hours in order to cover the bottom of the well with ND. After removal of the liquid, 100 µL of the cell suspension at a concentration of 1×10⁶ cells/mL in assay buffer was added into each well and incubated for 2 hours at 37°C. The cells were washed 3 times with assay buffer, and 100 µL of cell stain solution was added, followed by 5 minutes incubation. Subsequently, cells were washed 5 times with ultrapure water, and after the plate was fully dried, 100 µL of extraction buffer was added into each well, followed by 10 minutes incubation. Samples were transferred to a new plate, and absorbance measurement was performed at a wavelength of 540 nm in a microplate reader (Tecan Group Ltd.).
The results were presented as the mean absorbance of the triplet of wells.
3D Analysis
In order to create a 3D model using the bioprinting technique, MDA.MB.231 and U-87 MG cells were washed in an appropriate complete cell culture medium and centrifuged for 6 minutes, 200g. Then, 50 µL of cell suspension at the concentration of 1×10⁸ cells/mL was mixed with 425 µL GelMA Bioink (Cellink, Goteborg, Switzerland). Additionally, for the tested group, 25 µL of ND hydrocolloid at the concentration of 2000 mg/L was added to a mixture, obtaining a final concentration of 100 mg/L. For the control group, the same volume of ultrapure water (25 µL) was added. 3D models were printed using Bio X extrusion bioprinter (Cellink) on the 8-well 90 µL-slides (ibiTreat, ibidi GmbH, Gräfelfing, Germany). Afterward, 300 µL of appropriate complete cell medium was added into each well. 3D models were incubated for 7 days at 37°C in a humidified atmosphere containing 5% CO2. The cell culture medium was exchanged with a fresh one on the second, fourth, fifth, and sixth day of incubation. After 7 days, cells were stained using Image-IT™ DEAD Green™ Viability Stain (Thermo Fisher Scientific) at a concentration of 100 nM in fresh complete cell culture medium for 45 minutes at 37°C. Subsequently, cells were washed 4 times with PBS (Thermo Fisher Scientific) for 7, 5, 2, and 2 minutes respectively. After that, cells were fixed with a 4% solution of paraformaldehyde (PFA) for 15 minutes at 4°C and again washed twice with PBS (Thermo Fisher Scientific) for 2 minutes, followed by staining cell nuclei using DAPI (Thermo Fisher Scientific) at the concentration of 300 nM in PBS for 45 minutes at 37°C. Afterward, cells were washed 4 times with PBS for 5 minutes. Then, an 88% solution of glycerol was added to each well. Preparations prepared in this way were incubated at 4°C overnight. The number of live and dead cells was analyzed with an FV-1000 confocal microscope (Olympus Corporation, Tokyo, Japan). Cells were imaged sequentially using a 20X objective at excitation and emission wavelengths of 461/358 nm (DAPI) and 490/525 (Image-IT™ DEAD Green™ Viability Stain, Thermo Fisher Scientific). The analysis was performed in 4 replicates for each group. Analysis and cell counting were performed using Fiji software.27 The cell number on each image was assessed by thresholding the channel with stained cell nuclei, followed by watershed segmentation and particle function analysis. Additionally, the images of 3D structures were performed using, a Leica DMi8 microscope (Leica Microsystem) equipped with a Leica MC 190 HD camera.
Statistical Analysis
Data were analyzed using mono-factorial analysis of variance: one-way ANOVA with Statgraphics® Plus 4.1 (StatPoint Technologies, Warrenton, VA, USA). The differences between groups were tested using Tukey’s HSD multiple range tests. Differences with p-value <0.05 were considered significant. All mean values are presented with the standard deviation.
Results
Physicochemical Analysis
The data in Table 1 presents the zeta potential of the tested nanomaterials. All measurements were performed at a concentration of 5 mg/L. The analysis revealed that GN, GO, and C60 were characterized by negative values of zeta potential. Furthermore, the highest values, −27.55 and −26.83 mV, and the highest stability were displayed by GO and GN, respectively. C60 and ND were the least stable, maintaining only −16.75 mV and 16.55 mV, respectively.
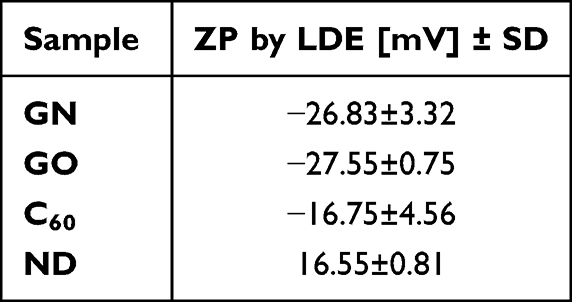 |
Table 1 Zeta Potential (ZP) in Suspension Measured by Laser Doppler Electrophoresis (LDE); the Results are Presented as Mean (n=4) with Standard Division (SD) |
In order to characterize the surface of dried nanofilms, SEM analysis was performed. The results are presented in Figure 1. Nanomaterials were also analyzed using a TEM (Figure 1). GN and GO took the form of flakes, whereas C60 and ND were spherical. The shape of the nanomaterials influenced the surface of nanofilms. Nanomaterials like GN and GO formed more uniform surfaces compared to C60 and ND after drying.
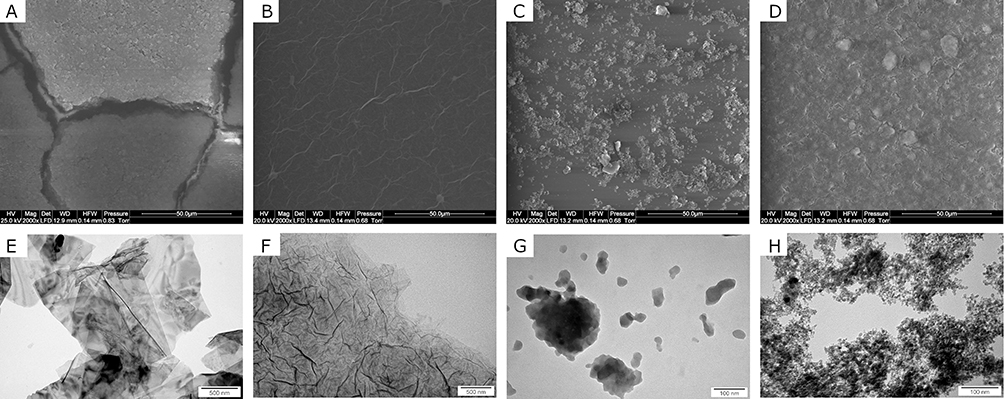 |
Figure 1 SEM (A–D) and TEM (E–H) images of GN (A and E); GO (B and F); C60 (C and G); and ND (D and H). |
For better characterization of tested nanomaterials, GN, C60, and ND nanofilms were characterized using the AFM technique. The results are presented in Table 2 and Figure 2. The analysis revealed that GN nanofilm had the highest roughness, while C60 nanofilm had the lowest roughness.
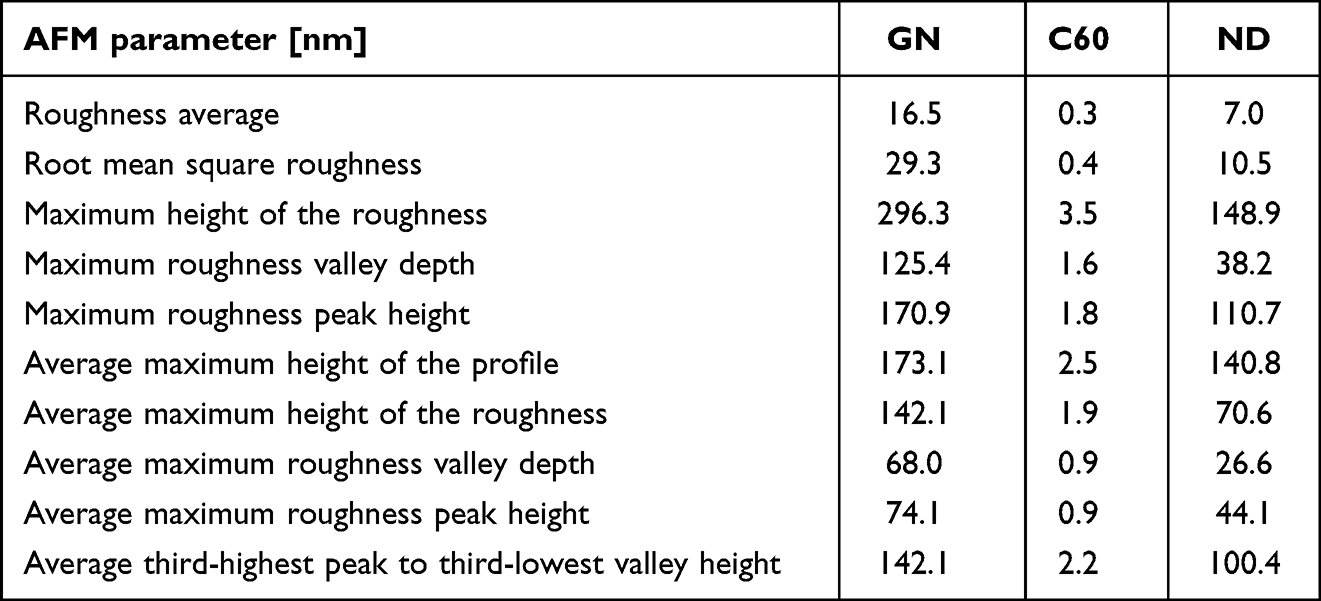 |
Table 2 AFM Parameters of Nanofilms Made of GN, C60, and ND |
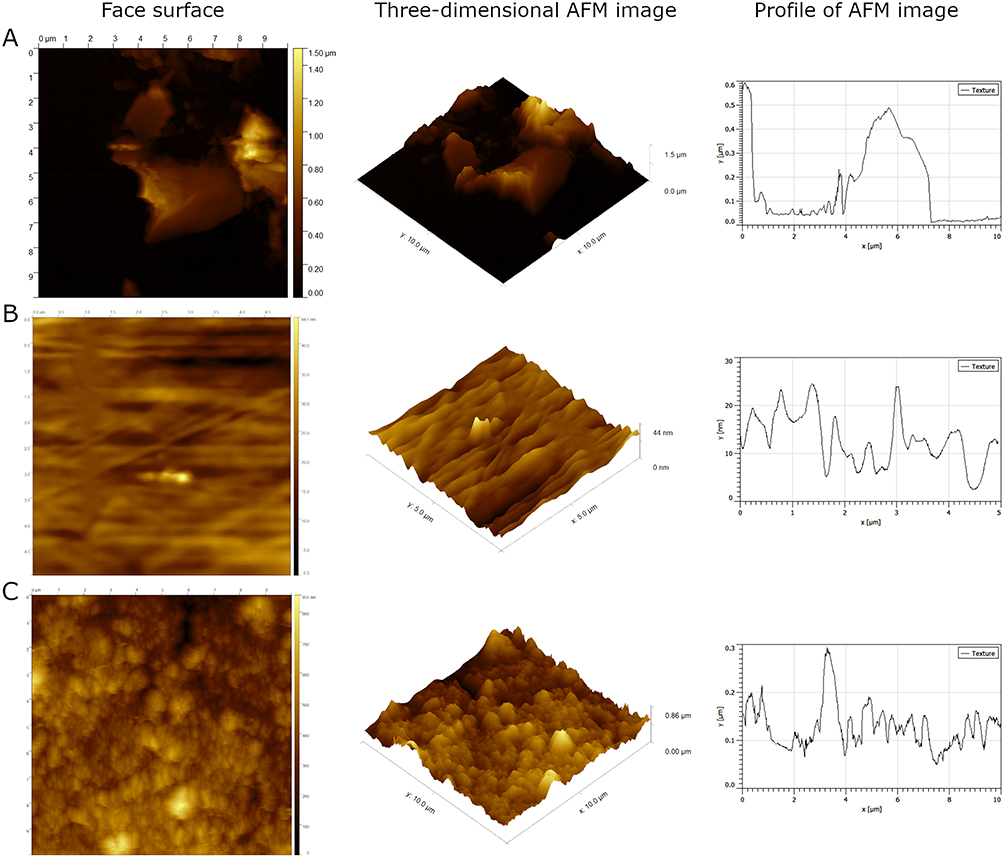 |
Figure 2 Topographical images of nanofilms made of GN (A), C60 (B), and ND (C) performed using the AFM technique. |
Atoms located in the interfacial region or at the interface are subject to the action of a different system of forces than the atoms located deep in the phase. On the one hand, they are attracted by atoms of its own phase and, on the other hand, by atoms from the neighboring phase. Therefore, they are located in an asymmetric force field. The water contact angle was measured to provide information about the character of prepared nanofilms. The images of water drops on prepared nanofilms are presented in Figure 3. The analysis performed using Fiji software revealed that the water contact angle for the cell culture plate was maintained at the level of 60.32°. Similar value was obtained for the surface covered with GO which was 64.26°. Water contact angle of C60 was smaller than the one obtained for the cell culture plate and was maintained at the level of 43.57°. The smallest values were observed on the surfaces covered with ND and GN nanofilms with the water contact angle of 17.99° and 22.12°, respectively.
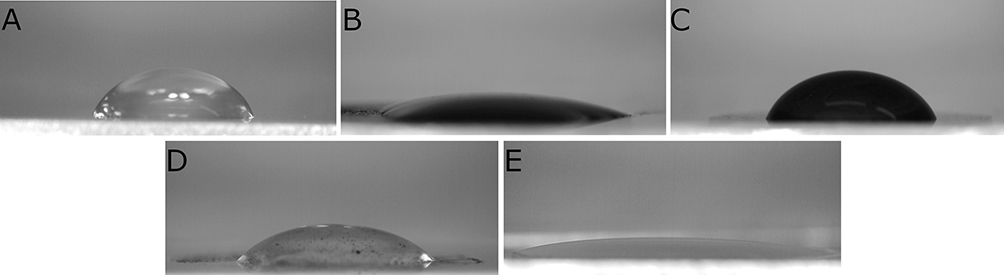 |
Figure 3 Water contact angle of cell culture plate, 60.32° (A); GN, 22.12° (B); GO, 64.26° (C); C60, 43.57° (D); ND, 17.99° (E). |
Morphological Analysis
In order to evaluate the changes in cell morphology caused by the nanomaterials, imaging 24 hours, 48 hours, and 72 hours after cell seeding on certain nanofilms was performed. Applying nanofilms, placed as dots, allowed analysis of the cell morphology inside, outside, and on the border of the dots (Figures 4 and 5). U-87 MG and MDA.MB.231 cells showed changes in polarization and shape, depending on location, in relation to the nanofilm dot. U-87 MG cells that were located near the ND nanofilm dot began to shrink after 48 hours of incubation compared to the control and GN nanofilm. Another finding was that MDA.MD.231 cells tended to accumulate on the border of GN, ND, and GO nanofilm with the side edge adjacent to it (Figures 4 and S1). U-87 MG cells formed spheroids to a lesser extent. The cells that were exposed to GO and C60 nanofilms looked similar to the untreated ones. However, some changes in the cells size could be observed after 24 hours (Figures S1 and S2).
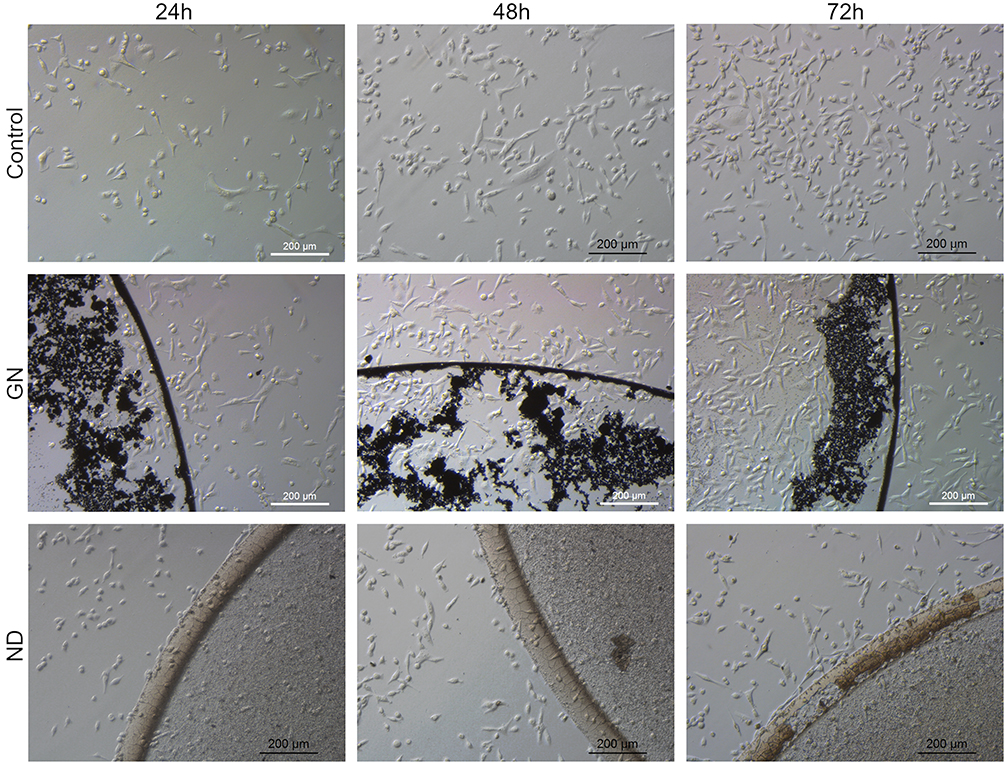 |
Figure 4 Morphological characterization of MDA.MB.231 human breast adenocarcinoma, seeded on GN and ND nanofilms after 24 hours, 48 hours, and 72 hours. |
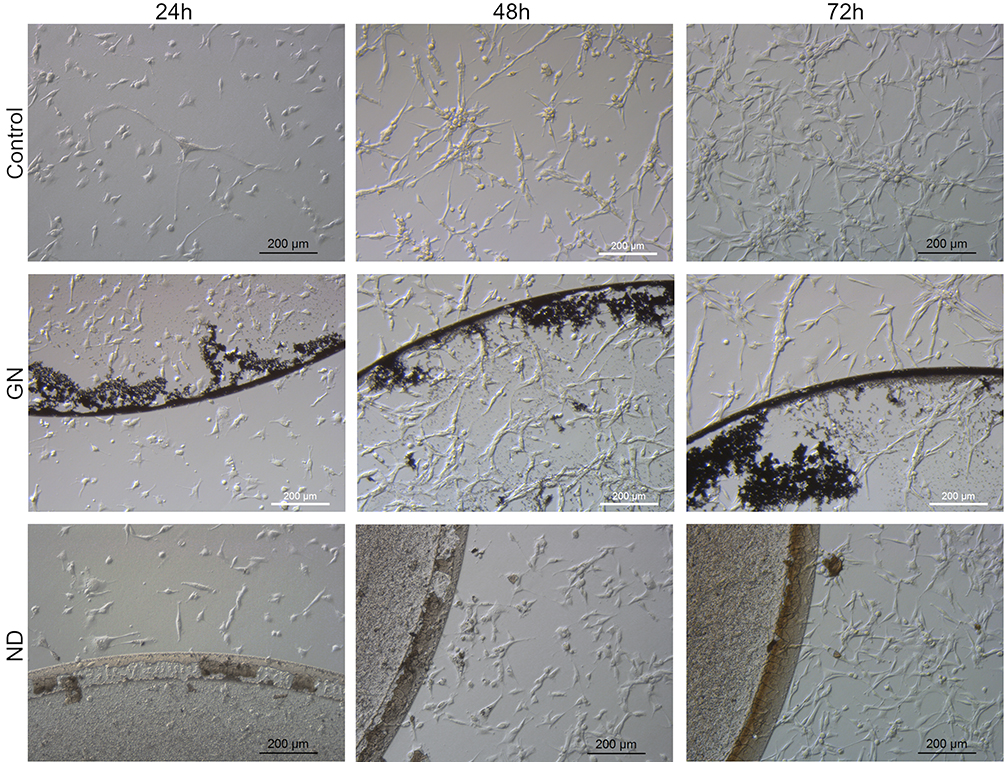 |
Figure 5 Morphological characterization of the U-87 MG human glioblastoma grade IV cell line, seeded on GN and ND nanofilms after 24 hours, 48 hours, and 72 hours. |
Membrane Integrity Assay
In order to evaluate the cytotoxicity of certain carbon-based nanofilms at the level of membrane integrity, an LDH assay was performed. Interference analysis was performed to eliminate the risk of false results according to the protocol described in the Supplementary Materials (Figure S3). The analysis revealed that all nanomaterials tested did not influence the cell membrane integrity of MDA.MB.231 cells (Figure 6A–C). However, GN and ND nanofilms induced enhanced leakage of LDH from U-87 MG cells after 24, 48, and 72 hours of incubation (Figure 6D–F).
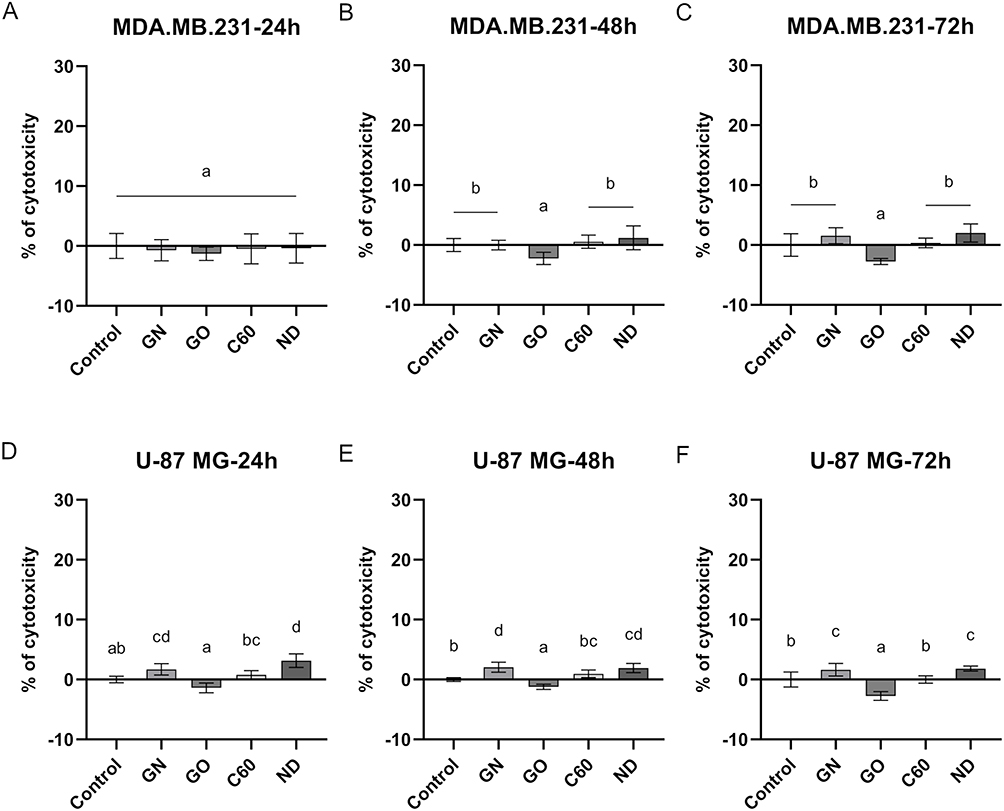 |
Figure 6 Membrane integrity of MDA.MB.231 (A–C) and U-87 MG (D–F) cells after 24 hours, 48 hours, and 72 hours incubation period on certain carbon-based nanofilms determined by LDH assay. Results are presented as the percentage of cytotoxicity (mean with standard deviation; n=6). Different letters above the columns indicate statistically significant differences between groups (p<0.05). |
Proliferation Assay
In order to assess the influence of certain carbon-based nanofilms on the proliferation rate, a total LDH measurement was performed. Interference analysis was performed to eliminate the risk of false results (Figure S3). The results from the proliferation assay are presented in Figure 7. The analysis revealed that GN and ND nanofilms decreased the proliferation rate in MDA.MB.231 48 and 72 hours after incubation (Figure 7B and C). The greatest inhibitory effect was obtained after 72 hours. Incubation on GN nanofilm resulted in a 20.97% decrease in the number of cells, whereas incubation on ND nanofilm resulted in a 30.09% decrease. In the case of the U-87 MG cell line, a similar tendency was observed after 48 hours incubation on GN and ND nanofilms, which caused a 15.95% and 16.17% loss in the number of cells (Figure 7D). However, the proliferation-inhibitory effect was not maintained with increasing incubation time and after 72 hours, the proliferation of U-87 MG cells remained at the level of the untreated control group (Figure 7E).
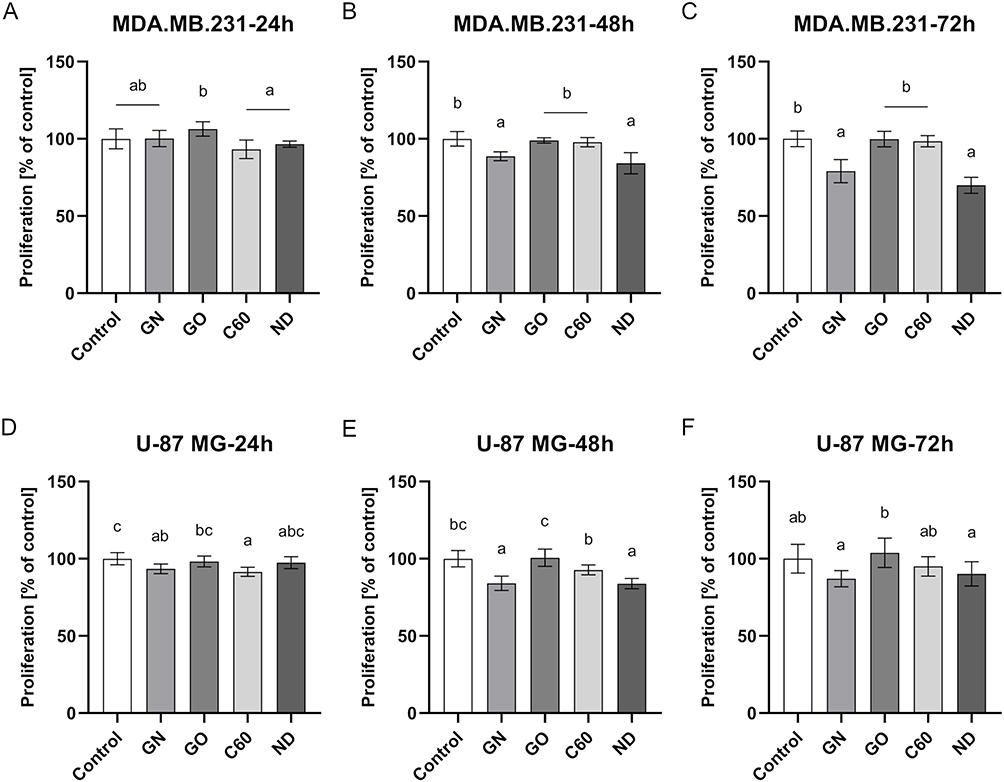 |
Figure 7 Proliferation of MDA.MB.231 (A–C) and U-87 MG (D–F) cells after 24 hours, 48 hours, and 72 hours incubation period on certain carbon-based nanofilms determined by LDH assay. Results are presented as the percentage of control (mean with standard deviation; n=6). Different letters above the columns indicate statistically significant differences between groups (p<0.05). |
Analysis of Cell Adhesion
In order to assess the influence of certain carbon-based nanofilms on cell adhesion, a total LDH measurement was performed. Interference analysis was performed to eliminate the risk of false results (Figure S3). The results from the analysis of cell adhesion are presented in Figure 8. The analysis revealed that MDA.MB.231 cell adhesion was enhanced on ND nanofilm compared to the control during the first 60 minutes after seeding cells (Figure 8A and B). GN and GO nanofilms did not influence cell adhesion (Figure 8A–C). In the case of U-87 MG cells, only GN nanofilm weakened the cell adhesion during the first 30 minutes after cell seeding (Figure 8D).
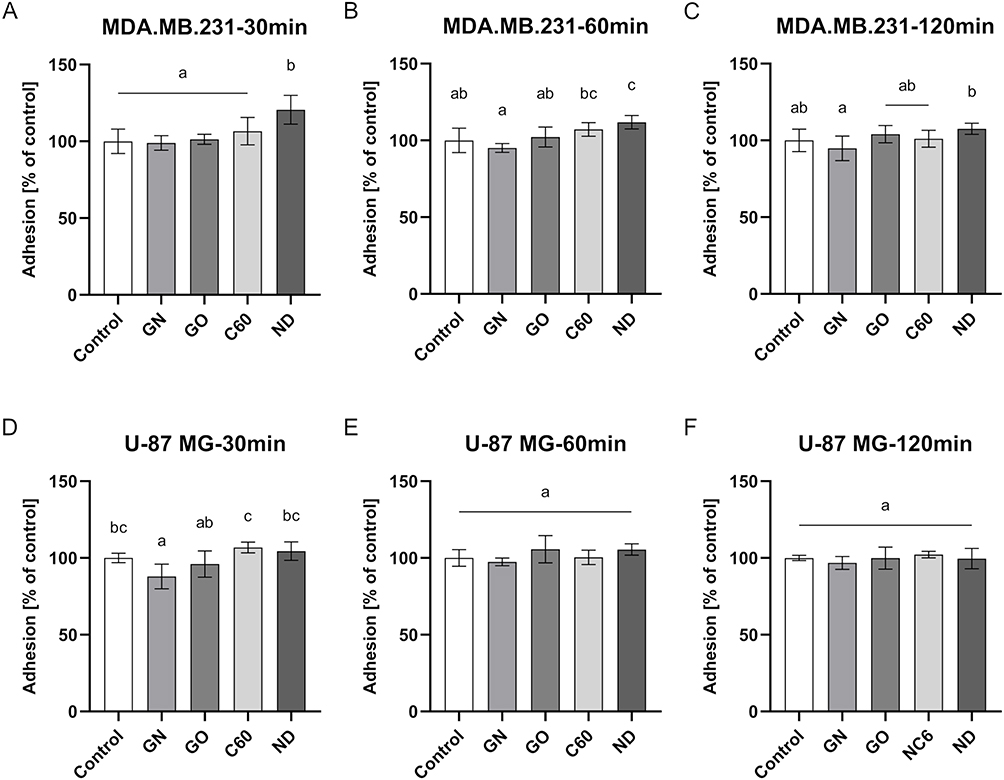 |
Figure 8 Cell adhesion of the MDA.MB.231 (A–C) and U-87 MG (D–F) cells after 30 minutes, 60 minutes, and 120 minutes after cell seeding on GN, GO, C60, and ND nanofilms determined by measuring total LDH. Results are presented as the percentage of control (mean with standard deviation; n=6). Different letters above the columns indicate statistically significant differences between groups (p<0.05). |
Analysis of Cell Adhesion to Selected Components of the Extracellular Matrix Covered with Diamond Nanoparticles
ECM Cell Adhesion Array was performed to evaluate cell adhesion to selected components of the ECM covered with ND. The analysis revealed that ND enhances MDA.MB.231 cell adhesion to tenascin and vitronectin (Figure 9A). ND also enhances U-87 MG cell adhesion to the following ECM components: collagen I, collagen IV, tenascin, and vitronectin (Figure 9B).
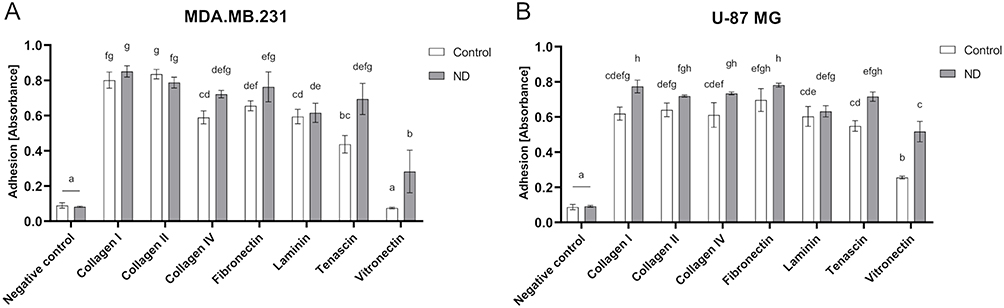 |
Figure 9 Cell adhesion of MDA.MB.231 (A) and U-87 MG (B) cells after 2 hours of incubation on certain ECM components covered with ND determined by ECM Cell Adhesion Array. Results are presented as the percentage of control (mean with standard deviation; n=3). Different letters above the columns indicate statistically significant differences between groups (p<0.05). |
3D Analysis
In order to reproduce multidimensional interactions between cells and between cells and ECM, bioprinted 3D models containing cancer cells were created. The analysis of MDA.MB.231 cells showed that although there was no difference in the number of dead cells between the control group and the treated group, the addition of ND caused the live and dead cell layers to separate. Dead cells were located at the bottom of the bioprinted 3D model, and live cells were observed at the upper part (Figure 10).
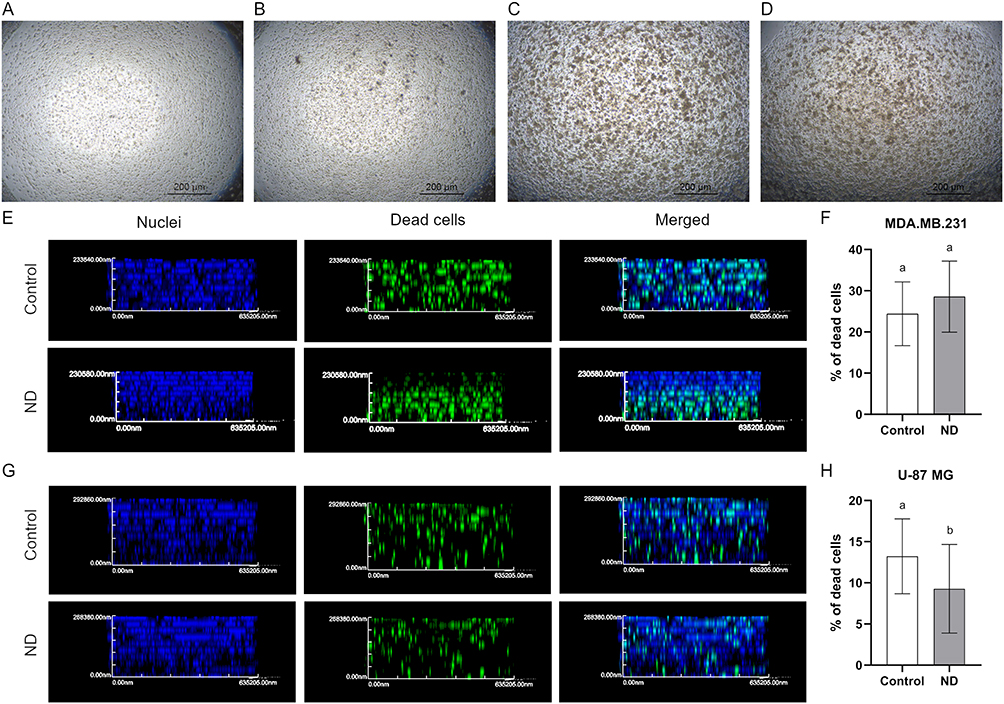 |
Figure 10 Images performed using inverted microscope of control, MDA.MB.231 (A), and U-87 MG (C) bioprinted 3D models (view from above) and MDA.MB.231 (B) and U-87 MG (D) models treated with 100 mg/L ND. Section through a bioprinted 3D model made of MDA.MB.231 cells, ND (G), and U-87 MG (F). Cell nuclei were stained with DAPI, and dead cells were stained using Image-IT™ DEAD Green™ Viability Stain (Thermo Fisher Scientific). (F and H) The results are presented as the mean with standard deviation. Different letters above columns indicate statistically significant differences (p≤0.05). |
The same phenomenon was not observed in the case of U-87 MG cells. Live and dead cells were located throughout the whole volume of the bioprinted 3D model. However, it was observed that in the group treated with ND, the percentage of dead cells was lower than in the control group, maintaining the values of 9.27% and 13.22%, respectively (Figure 10).
Discussion
The aim of the study was to evaluate whether carbon-based nanomaterials such as GN, GO, C60, and ND may serve as potential components of ECM that will affect and reduce tumor oncogenic potential, particularly by reducing the proliferation rate of cancer cells and enhancing their adhesion to the ECM. The fundamental issue in applying nanomaterials in cancer treatment is safety. Desirable nanomaterials in cancer treatment should be characterized by biocompatibility. For that reason, the analysis of the cell membrane integrity was performed. The analysis revealed that all nanomaterials used in the experiment did not harm the cell membrane of MDA.MB.231 cells. However, GN and ND nanofilms exhibited low toxicity against U-87 MG cells. Graphene takes the form of flakes, as shown in the TEM images. Dried GN nanofilm was characterized by a rough surface, as revealed by SEM and AFM analyses. The cell morphology images showed that U-87 MG cells were bigger than MDA.MB.231 cells and formed clusters. Together, these could have contributed to higher LDH leakage from U-87 MG cells, indicating cell membrane damage. This finding is in line with Akhavan and Ghaderi’s thesis.28 According to the literature, one of the proposed toxicity mechanisms of GN assumes cell membrane damage through physical interactions with nanomaterial.29 The surface of GN enables its interactions with cell membrane lipids,30 which may also underlie the moderate toxicity of GN nanofilm against U-87 MG cells. ND nanofilm also caused moderate toxicity against the glioblastoma grade IV cell line. As was shown in the morphological images, some fragments of ND tended to detach and were internalized by the cells or formed clusters on their surface. The adhesion of ND nanofilm may be influenced by the formation of the non-diamond phase, the generation of voids during the drying process, and the differences between the thermal expansion coefficient of ND nanofilm and surrounding phases.31 Our previous study showed that ND in the form of hydrocolloid disturbs the cell membrane integrity in glioblastoma grade IV cell lines T98G and U-118 MG.25 Interestingly, both GN and ND nanofilms did not influence the cell membrane integrity of MDA.MB.231 cells. Diamond nanofilms are thin layers of amorphous sp2-bonded carbon bound to crystalline phases of sp3-bonded carbon. ND nanofilm characteristics are similar to those of macroscale diamond.32 According to the literature, ND nanofilm biocompatibility depends on the atomic-bound structure and hydrogen content. Biocompatibility also depends on the cell line.25 However, it is considered a biocompatible nanomaterial,33 which was revealed by the analysis performed on MDA.MB.231 cells. Those results were in line with the analysis performed on a bioprinted 3D model, where no toxicity was observed after treatment of MDA.MB.231 cells with ND. Moreover, our previous study25 showed that the addition of the same ND nanoparticles in the form of hydrocolloidal suspension at the concentration of 20 mg/L into the cell culture medium of non-cancer HFF-1 cells did not cause any morphological changes after 24 hours of incubation. Moreover, ND at the concentration of 50 mg/L caused a significant decrease in intracellular ROS and mitochondrial superoxide level, which led to a higher metabolic activity of the tested fibroblast cell-line HFF-1. Those findings indicate that currently tested ND may not be toxic to non-cancer cells.
The desired effect of the nanomaterial was to inhibit the cell proliferation rate. The proliferation analysis revealed that GN and ND nanofilm significantly inhibit the proliferation of MDA.MB.231 cells after 48 hours. This effect was also maintained after 72 hours. The same tendency was observed in the case of U-87 MG cells. However, after 72 hours, there were no significant changes observed. Studies performed on hepatocellular carcinoma cell-line C3A showed that the thin layer of ND nanofilm decreases the level of proteins responsible for cell proliferation, which leads to a decreased population of cancer cells in the G0/G1 phase of the cell cycle.18 The mechanochemical signaling caused by ND nanofilms, which disturbs the expression of specific proteins related to mitosis and proliferation, may underlie the phenomenon of decreased proliferation of MDA.MB.231 cells.
Another feature that should characterize a nanomaterial suitable for creating a niche that will stabilize the ECM after tumor resection is its pro-adhesive nature; hence, an analysis of adhesion was performed. The analysis revealed that ND nanofilm enhances the adhesion of MDA.MD.231 cells during the first 30 minutes after seeding. This finding is in line with those obtained by Guo et al.34 Studies performed on Hela cells showed that ND can enhance cell adhesion, thus inhibiting cell migration by impairing the assembly of the cellular cytoskeleton. Another possible mechanism of this phenomenon was the disruption of the epithelial–mesenchymal transition (EMT) signaling pathway by decreasing the level of transforming growth factor β (TGF-β) caused by ND.34 Another study concerning the adhesion of osteoblasts to ND coatings showed that the nanocrystalline layer of ND can promote adhesion.35 As the adhesion of cancer cells plays a major role in cancer progression,36 we have also investigated cell adhesion to particular ECM components covered with ND. The analysis revealed that ND treatment enhances the adhesion of both breast cancer and glioblastoma grade IV cell lines to tenascin and vitronectin. Enhanced adhesion to collagen I and collagen IV was also noted in the case of U-87 MG cells. According to the literature, numerous isoforms of tenascin are produced through alternative splicing of nine fibronectin type III regions. Different splicing isoforms are characterized by specific biological functions.37 The most common tenascins present in the microenvironment of breast cancer tumors are those containing the D and B domains, which are connected with the invasive phenotype.38 Tenascin is also over-expressed in the ECM of the invasive phenotype of glioblastoma.39 In general, tenascin can directly interact with various cell adhesion receptors, thereby influencing their functions.40 The presence of this protein in ECM may inhibit focal adhesion and promote cell migration and angiogenesis.41 One of the first observations concerning tenascin revealed that cells did not adhere well to the ECM component, which in turn led to a higher proliferation rate.42 However, our studies proved that the addition of ND can weaken the activity of tenascin, enhancing adhesion and thus inhibiting MDA.MB.231 cell proliferation. Another important protein present in the tumor microenvironment is vitronectin. The addition of ND enhanced the adhesion of both MDA.MB.231 and U-87 MG cells to this protein. The interaction between vitronectin and integrins can activate signaling pathways that regulate cytoskeleton reorganization, lipid metabolism, intracellular ion transport, and gene expression.43 Another finding was the enhanced adhesion to collagen I and IV covered with ND observed in the U-87 MG cell line. According to the literature, collagen I has two exclusive domains: the matrix interaction domain and the cell interaction domain.44 The first one is for impairing the structural properties of collagen fibrils. It has binding sites for proteoglycans such as dermatan sulfate or keratin sulfate, while the other is responsible for signal transduction and ECM remodeling. This domain has binding sites for matrix metalloproteinases, integrins, discoidin domain receptors, and matricellular proteins.45 Collagen type IV mediates the process that leads to collagen sheet formation. These domains are the major components of the basement membrane.45 Enhanced adhesion to those components may possibly lead to the remodeling of damaged ECM after tumor resection.
Conclusion
ND nanofilm is a nontoxic and pro-adhesive nanomaterial that might be used to stabilize and partially replenish the niche after breast tumor resection. ND nanofilm enhances the adhesion of breast cancer cell lines during the first 60 minutes after cell seeding. By coating ECM components with ND, enhanced adhesion to tenascin and vitronectin was observed. Moreover, the nanofilm can decrease the proliferation rate of MDA.MB.231 cells. However, ND nanofilm caused cell membrane damage in U-87 MG cells and did not enhance the adhesion of the glioblastoma cell line. ND nanofilm was capable of decreasing the proliferation rate of the glioblastoma grade IV cell line, but only after 48 hours. In that case, the nanofilm caused enhanced adhesion to tenascin, vitronectin, collagen I, and collagen IV. Although nanomaterials such as GO and C60 were biocompatible for MDA.MB.231 and U-87 MG cell lines, they did not significantly influence the proliferation for adhesion of tested cells.
Abbreviations
AFM, atomic force microscopy; C60, fullerene; DMEM, Dulbecco’s Modified Eagle Medium; ECM, extracellular matrix; EMEM, Eagle’s Minimum Essential Medium; FBS, fetal bovine serum; GN, graphene; GO, single-layer graphene oxide; LDH, lactate dehydrogenase; LDE, laser Doppler electrophoresis; ND, diamond nanoparticles; PBS, phosphate-buffered saline; SEM, scanning electron microscope; SD, standard division; TEM, transmission electron microscope; ZP, zeta potential.
Data Sharing Statement
The datasets analyzed during the current study are available from the corresponding author on reasonable request.
Acknowledgments
The manuscript is part of the PhD thesis of Barbara Wójcik.
Author Contributions
All authors made a contribution to the presented work, whether that is in the conception, study design, execution, acquisition of data, analysis and interpretation, or in all these areas; took part in revising or critically reviewing the article; gave final approval of the version to be published; have agreed on the journal to which the article has been submitted; and agree to be accountable for all aspects of the work.
Funding
This research was funded by the National Science Centre, Poland, project number 2020/37/B/NZ7/03532.
Disclosure
The authors declare no conflicts of interest in this work.
References
1. Li L, Zhang F, Liu Z, et al. Immunotherapy for triple-negative breast cancer: combination strategies to improve outcome. Cancers. 2023;15(1). doi:10.3390/cancers15010321
2. Lin NU, Vanderplas A, Hughes ME, et al. Clinicopathologic features, patterns of recurrence, and survival among women with triple-negative breast cancer in the national comprehensive cancer network. Cancer. 2012;118(22):5463–5472. doi:10.1002/cncr.27581
3. Miglietta F, Fabi A, Generali D, et al. Optimizing choices and sequences in the diagnostic-therapeutic landscape of advanced triple-negative breast cancer: an Italian consensus paper and critical review. Cancer Treat Rev. 2023;114:102511. doi:10.1016/j.ctrv.2023.102511
4. Dent R, Trudeau M, Pritchard KI, et al. Triple-negative breast cancer: clinical features and patterns of recurrence. Clin Cancer Res. 2007;13(15):4429–4434. doi:10.1158/1078-0432.CCR-06-3045
5. Torre LA, Bray F, Siegel RL, et al. Global cancer statistics, 2012. CA Cancer J Clin. 2015;65(2):87–108. doi:10.3322/caac.21262
6. Insua-Rodríguez J, Oskarsson T. The extracellular matrix in breast cancer. Adv Drug Deliv Rev. 2016;97:41–55. doi:10.1016/j.addr.2015.12.017
7. Mohiuddin E, Wakimoto H. Extracellular matrix in glioblastoma: opportunities for emerging therapeutic approaches. Am J Cancer Res. 2021;11(8):3742–3754.
8. Carlsson SK, Brothers SP, Wahlestedt C. Emerging treatment strategies for glioblastoma multiforme. EMBO Mol Med. 2014;6(11):1359–1370. doi:10.15252/emmm.201302627
9. Predina J, Eruslanov E, Judy B, et al. Changes in the local tumor microenvironment in recurrent cancers may explain the failure of vaccines after surgery. Proc Natl Acad Sci U S A. 2013;110(5):415–424. doi:10.1073/pnas.1211850110
10. Pantel K, Speicher MR. The biology of circulating tumor cells. Oncogene. 2016;35(10):1216–1224. doi:10.1038/onc.2015.192
11. Guo F, Zhang Y, Bai L, Cui J. Natural killer cell therapy targeting cancer stem cells: old wine in a new bottle. Cancer Lett. 2023;570:216328. doi:10.1016/j.canlet.2023.216328
12. Walker C, Mojares E, Del Río Hernández A. Role of extracellular matrix in development and cancer progression. Int J Mol Sci. 2018;19(10):3028. doi:10.3390/ijms19103028
13. Frantz C, Stewart KM, Weaver VM. The extracellular matrix at a glance. J Cell Sci. 2010;123(24):4195–4200. doi:10.1242/jcs.023820
14. Tufail M, Cui J, Wu C. Breast cancer: molecular mechanisms of underlying resistance and therapeutic approaches.. Am J Cancer Res. 2022;12(7):2920–2949.
15. Lah TT, Novak M, Breznik B. Brain malignancies: glioblastoma and brain metastases. Semin Cancer Biol. 2020;60:262–273. doi:10.1016/j.semcancer.2019.10.010
16. Malik R, Lelkes PI, Cukierman E. Biomechanical and biochemical remodeling of stromal extracellular matrix in cancer. Trends Biotechnol. 2015;33(4):230–236. doi:10.1016/j.tibtech.2015.01.004
17. Paszek MJ, Zahir N, Johnson KR, et al. Tensional homeostasis and the malignant phenotype. Cancer Cell. 2005;8(3):241–254. doi:10.1016/j.ccr.2005.08.010
18. Sosnowska M, Kutwin M, Strojny B, et al. Diamond nanofilm normalizes proliferation and metabolism in liver cancer cells. Nanotechnol Sci Appl. 2021;14:115–137. doi:10.2147/NSA.S322766
19. Wang SP, Guo JG, Jiang Y. The size- and chirality-dependent elastic properties of graphene nanofilms. J Comput Theor Nanosci. 2013;10(1):250–256. doi:10.1166/jctn.2013.2687
20. Verma R, Kumar Gupta S, Lamba NP, et al. Graphene and graphene based nanocomposites for bio-medical and bio-safety applications. ChemistrySelect. 2023;8(6). doi:10.1002/slct.202204337
21. Ansar SA, Aggarwal S, Arya S, et al. An intuitionistic approach for the predictability of anti-angiogenic inhibitors in cancer diagnosis. Sci Rep. 2023;13(1):1–14. doi:10.1038/s41598-023-32850-8
22. Fahmi T, Branch LD, Nima ZA, et al. Mechanism of graphene-induced cytotoxicity: role of endonucleases. J Appl Toxicol. 2017;37(11):1325–1332. doi:10.1002/jat.3462
23. Wu J, Yang R, Zhang L, et al. Cytotoxicity effect of graphene oxide on human MDA-MB-231 cells. Toxicol Mech Methods. 2015;25(4):312–319. doi:10.3109/15376516.2015.1031415
24. Harhaji L, Isakovic A, Raicevic N, et al. Multiple mechanisms underlying the anticancer action of nanocrystalline fullerene. Eur J Pharmacol. 2007;568(1–3):89–98. doi:10.1016/j.ejphar.2007.04.041
25. Wójcik B, Zawadzka K, Jaworski S, et al. Dependence of diamond nanoparticle cytotoxicity on physicochemical parameters: comparative studies of glioblastoma, breast cancer, and hepatocellular carcinoma cell lines. Nanotoxicology. 2023;17:310–337. doi:10.1080/17435390.2023.2218925
26. Moradi E, Naserzadeh P, Brouki Millan P, et al. Selective cytotoxicity mechanisms and biodistribution of diamond nanoparticles on the skin cancer in C57 mouse. Biomed Mater. 2022;17(1):015013. doi:10.1088/1748-605X/ac3d99
27. Schindelin J, Arganda-Carreras I, Frise E, et al. Fiji: an open-source platform for biological-image analysis. Nat Methods. 2012;9(7):676–682. doi:10.1038/nmeth.2019
28. Akhavan O, Ghaderi E. Toxicity of graphene and graphene oxide nanowalls against bacteria. ACS Nano. 2010;4(10):5731–5736. doi:10.1021/nn101390x
29. Achawi S, Pourchez J, Feneon B, et al. Graphene-based materials in vitro toxicity and their structure–activity relationships: a systematic literature review. Chem Res Toxicol. 2021;34(9):2003–2018. doi:10.1021/acs.chemrestox.1c00243
30. Sanchez VC, Jachak A, Hurt RH, et al. Biological interactions of graphene-family nanomaterials. Chem Res Toxicol. 2012;25:15–34. doi:10.1021/tx200339h
31. Handschuh-Wang S, Wang T, Tang Y. Ultrathin diamond nanofilms—Development, challenges, and applications. Small. 2021;17(30):1–26. doi:10.1002/smll.202007529
32. Luo D, Schricker SR. Handbook of Nanomaterials Properties. Springer Science & Business Media; 2014:
33. Roy RK, Lee KR. Biomedical applications of diamond-like carbon coatings: a review. J Biomed Mater Res. 2007;83(1):72–84. doi:10.1002/jbm.b.30768
34. Guo Q, Li L, Gao G, et al. Nanodiamonds inhibit cancer cell migration by strengthening cell adhesion: implications for cancer treatment. ACS Appl Mater Interfaces. 2021;13(8):9620–9629. doi:10.1021/acsami.0c21332
35. Yang L, Sheldon BW, Webster TJ. Orthopedic nano diamond coatings: control of surface properties and their impact on osteoblast adhesion and proliferation film growth conditions for diamond coatings. J Biomed Mater Res. 2008;91A(2):548–556. doi:10.1002/jbm.a.32227
36. Emery LA, Tripathi A, King C, et al. Early dysregulation of cell adhesion and extracellular matrix pathways in breast cancer progression. Am J Pathol. 2009;175(3):1292–1302. doi:10.2353/AJPATH.2009.090115
37. Meiners S, Geller HM. Long and short splice variants of human tenascin differentially regulate neurite outgrowth. Mol Cell Neurosci. 1997;10(1–2):100–116. doi:10.1006/mcne.1997.0643
38. Castro NP, Osório CABT, Torres C, et al. Evidence that molecular changes in cells occur before morphological alterations during the progression of breast ductal carcinoma. Breast Cancer Res. 2008;10(5):1–14. doi:10.1186/bcr2157
39. Rolle K, Nowak S, Wyszko E, et al. Promising human brain tumors therapy with interference RNA intervention (iRNAi). Cancer Biol Ther. 2010;9(5):397–407. doi:10.4161/cbt.9.5.10958
40. Midwood KS, Orend G. The role of tenascin-C in tissue injury and tumorigenesis. J Cell Commun Signal. 2009;3(3–4):287–310. doi:10.1007/s12079-009-0075-1
41. Wawrzyniak D, Grabowska M, Głodowicz P, et al. Down-regulation of tenascin-C inhibits breast cancer cells development by cell growth, migration, and adhesion impairment. PLoS One. 2020;15:1–25. doi:10.1371/journal.pone.0237889
42. Chiquet-Ehrismann R, Mackie EJ, Pearson CA, Sakakura T. Tenascin: an extracellular matrix protein involved in tissue interactions during fetal development and oncogenesis. Cell. 1986;47(1):131–139. doi:10.1016/0092-8674(86)90374-0
43. Schvartz I, Seger D, Shaltiel S. Vitronectin. Int J Biochem Cell Biol. 1999;31(5):539–544. doi:10.1016/S1357-2725(99)00005-9
44. Sweeney SM, Orgel JP, Fertala A, et al. Candidate cell and matrix interaction domains on the collagen fibril, the predominant protein of vertebrates. J Biol Chem. 2008;283(30):21187–21197. doi:10.1074/jbc.M709319200
45. Payne LS, Huang PH. The pathobiology of collagens in glioma. Mol Cancer Res. 2013;11(10):1129–1140. doi:10.1158/1541-7786.MCR-13-0236
 © 2023 The Author(s). This work is published and licensed by Dove Medical Press Limited. The full terms of this license are available at https://www.dovepress.com/terms.php and incorporate the Creative Commons Attribution - Non Commercial (unported, v3.0) License.
By accessing the work you hereby accept the Terms. Non-commercial uses of the work are permitted without any further permission from Dove Medical Press Limited, provided the work is properly attributed. For permission for commercial use of this work, please see paragraphs 4.2 and 5 of our Terms.
© 2023 The Author(s). This work is published and licensed by Dove Medical Press Limited. The full terms of this license are available at https://www.dovepress.com/terms.php and incorporate the Creative Commons Attribution - Non Commercial (unported, v3.0) License.
By accessing the work you hereby accept the Terms. Non-commercial uses of the work are permitted without any further permission from Dove Medical Press Limited, provided the work is properly attributed. For permission for commercial use of this work, please see paragraphs 4.2 and 5 of our Terms.