")
Back to Journals » Journal of Asthma and Allergy » Volume 17
Bronchodilator Responsiveness Measured by Spirometry and Impulse Oscillometry in Patients with Asthma After Short Acting Antimuscarinic and/or Beta-2-Agonists Inhalation
Authors van der Burg NMD , Ekelund C, Bjermer LH , Aronsson D, Ankerst J, Tufvesson E
Received 29 September 2023
Accepted for publication 2 December 2023
Published 19 January 2024 Volume 2024:17 Pages 21—32
DOI https://doi.org/10.2147/JAA.S442217
Checked for plagiarism Yes
Review by Single anonymous peer review
Peer reviewer comments 2
Editor who approved publication: Dr Luis Garcia-Marcos
Nicole MD van der Burg, Carl Ekelund, Leif H Bjermer, David Aronsson, Jaro Ankerst, Ellen Tufvesson
Department of Clinical Sciences Lund, Respiratory Medicine, Allergology and Palliative Medicine, Lund University, Lund, Sweden
Correspondence: Ellen Tufvesson, Department of Clinical Sciences Lund, Respiratory Medicine, Allergology and Palliative Medicine, Lund University, BMC, D12, Lund, 221 84, Sweden, Email [email protected]
Background: Bronchodilator responsiveness (BDR) in asthma involves both the central and peripheral airways but is primarily relieved with beta-2-agonists and evaluated by spirometry. To date, antimuscarinics can be added as a reliever medication in more severe asthma. We hypothesize that combining both short-acting beta-2 agonist (SABA) and short-acting muscarinic antagonist (SAMA) could also improve the responsiveness in mild-moderate asthma. Therefore, we aimed to compare the direct effects of inhaling SABA alone, SAMA alone or combining both SABA and SAMA on the central and peripheral airways in asthma.
Methods: Twenty-three patients with mild-moderate BDR in asthma performed dynamic spirometry and impulse oscillometry before (baseline) and multiple timepoints within an hour after inhalation of SABA (salbutamol), SAMA (ipratropium bromide), or both SABA and SAMA at three different visits.
Results: The use of SAMA alone did not show any improvement compared to the use of SABA alone. Inhalation of SABA+SAMA, however, averaged either similar or better BDR than SABA alone in FEV1, MMEF, FVC, R5, R20 and R5-R20. Inhaling SABA+SAMA reached a stable BDR in more patients within 0– 10 minutes and also reached the FEV1 (Δ%)> 12% faster (3.5 minutes) than inhaling SABA alone (5.1 minutes). Inhaling SABA+SAMA was significantly better than SAMA alone in FEV1 (p = 0.015), MMEF (p = 0.0059) and R20 (p = 0.0049). Using these three variables highlighted a subgroup (30%, including more males) of patients that were more responsive to inhaling SABA+SAMA than SABA alone.
Conclusion: Overall, combining SAMA with SABA was faster and more consistent at increasing the lung function than SABA alone or SAMA alone, and the additive effect was best captured by incorporating peripheral-related variables. Therefore, SAMA should be considered as an add-on reliever for mild-moderate patients with BDR in asthma.
Keywords: BDR, mild-moderate asthma, central airway, peripheral airways, SABA, SAMA
Introduction
Bronchodilator Responsiveness in Asthma
Bronchodilator responsiveness (BDR) in asthma (previously often called “reversibility”) generally refers to rapid improvements in forced expiratory volume in 1 second (FEV1) measured within minutes after inhalation of a short-acting bronchodilator.1,2 Depending on the cohort, 17–57% of asthma patients demonstrate BDR when tested using short-acting beta-2-agonist (SABA).3,4 Regular use of SABA leads to increased beta-2-receptor tolerance, reduced response to the medication, and increased allergen response and inflammation, therefore, it is no longer recommended as a single reliever medication.5 Instead, the Global Initiative for Asthma (GINA)-guidelines (2022) recommend mild asthma symptoms are relieved, when necessary, with low-dose inhaled corticosteroids (ICS) and formoterol (a long-acting beta-2-agonists, LABA, with relative rapid onset of action), moderate asthma should also take this combination daily (ie maintenance and reliever), while LAMA is only considered in more severe asthma (ie step 4).1 In general, most patients with BDR in asthma control their symptoms with ICS+LABA (ie mild-moderate severity); however, since BDR is an indication that the airway smooth muscle is targetable, maybe antimuscarines should be considered before step 4.
Antimuscarinic Bronchodilation
The short- and long-acting muscarinic antagonists (SAMA and LAMA, respectively) are another types of bronchodilators, instead directly targeting the airway smooth muscle (contributing to the bronchoconstriction), that are suggested to be a useful add-on but are rarely prescribed in asthma.6 Antimuscarinic bronchodilators are cost-effective medications that tend to be reserved for more severe forms of asthma.7,8 They have similar properties to the beta-2-agonists in their outcome of bronchodilation, but instead, act by blocking the acetylcholine receptors in smooth muscle cells, thus reducing the airflow limitation.9 The side effects of antimuscarinics are minor (for example, dry throat related to the anticholinergic effect), and daily use does not induce tolerance.6,10 Antimuscarinics delivered by ultrafine aerosolization techniques have the potential to target the receptors of the small airways.11 Using them as add-on therapy has already shown additional improvement in central airway readings (FEV1 and forced vital capacity (FVC)) for severe asthma12 and chronic dosing in a triple therapy regime has resulted in improved peripheral airway readings (maximal mid-expiratory flow (MMEF) and the resistance at 5 Hz minus resistance at 20 Hz (R5-R20)).11 Our group has previously shown that patients with chronic obstructive pulmonary disease have an additive effect on bronchodilation by using the combination of SABA in combination with SAMA.13 However, the effect of antimuscarinics, particularly in the peripheral airways, needs further investigation as an add-on therapy for patients with mild-moderate asthma.
Peripheral Airway Disease
Asthma was originally viewed as a central airway disease but is accepted to also involve the peripheral airways in all types of asthma severity.14,15 Since BDR involves both central and peripheral airways, measuring BDR in asthma patients should also consider the peripheral component. Almeshari et al (2021) illustrated that the peripheral airways responded greater to bronchodilators than the central airways in patients with mild-to-moderate asthma, but with higher variability.16 Therefore, it is important to test the effect of other bronchodilators in both the central and peripheral airways with robust methodologies.
Reading Central and Peripheral Airways
To test using spirometry, a clinically defined BDR is achieved if an FEV1 increases by >12% and more than 200mL after 10–15 minutes from inhaling the bronchodilator (standard: SABA).1 While the FEV1 primarily reflects air flow in the central airways, the MMEF has been suggested as a surrogate marker of early peripheral airway obstruction.17,18 However, spirometry is often not performed correctly by all patients and can be quite variable over time as well.19–21 To complement spirometry, impulse oscillometry (IOS) can be used to measure lung mechanics.22 Using sound waves superimposed on normal tidal breathing, disturbances in flow and pressure can be used to calculate resistance and reactance of the respiratory system.23–26 The method is especially useful in defining peripheral airway obstruction apart from large airway obstruction by using different frequencies.
The aim of the study was to investigate the direct effect of inhaling, SAMA alone or combining both SABA and SAMA (SABA+SAMA), compared to SABA alone, on lung function variables of the central and peripheral airways in patients with mild-moderate asthma.
Materials and Methods
Patients
A total of 44 asthma patients were recruited, of these, 34 completed BDR testing, and 23 (67%) were considered eligible as their FEV1 improved by ≥7% after SABA or SABA+SAMA. The eligible group consisted of 12 women and 11 men, with a mean (SD, min-max) age of 39.8 (±17.4, 18–77) years. None were currently smoking, though five had a previous smoking history (ex-smokers). The average BMI was 25.3 ± 5.7, the average ACT score was 19.7 ± 4.0 and the baseline predicted percentage of FEV1 was 86.4% ± 15.5. As daily medication, 15 (65%) patients were using ICS, 13 (57%) were using SABA and 11 (48%) were using LABA (as needed), but no patients were using SAMA or LAMA. Patients were excluded if they had an ongoing respiratory tract infection within the last two weeks, had any other respiratory diseases (except for asthma), or were pregnant.
The non-responders (11/34 patients) had a response in FEV1 of <7%, and there were no significant differences between responder and non-responder patient characteristics (see Supplementary Figure 1).
Study Design
At the first visit, an informed consent form for the study was signed, and an Asthma Control Test (ACT) was filled in by the patients. History of asthma, allergies, smoking, medications and recent airway infections was noted prior to testing. Patients were instructed not to use their short-acting bronchodilator medications up to eight hours prior or long-acting up to 24 hours prior to each visit.
Each patient had three visits (within a median of 7.6 days, min-max: 3–18 days), each time with a different medication: SABA, SAMA or both bronchodilators in combination. Patients were administered bronchodilator medication via a pressurized metered-dose inhaler and spacer (Volumatic). Medication consisted of either 4 doses of 0.1mg Ventoline® Evohaler® (salbutamol, SABA), 4 doses of 20µg Atrovent® (ipratropium bromide, SAMA) or both bronchodilators in combination for a total of 8 doses (SABA+SAMA). The patients were blinded to which bronchodilator they were inhaling each time and the order of SABA, SAMA or both SABA+SAMA in combination was randomized for each subject to minimize any possible bias. If the maximum change in FEV1 after SABA was less than 7%, the patient was excluded from the study. During each visit, the subject performed IOS and dynamic spirometry at baseline (before bronchodilator inhalation) and then at 5, 10, 15, 20, 30, 45 and 60 minutes after the bronchodilator inhalation.
Lung Function Testing
IOS was performed using a Jaeger MasterScreen IOS27 and spirometry was performed using Jaeger MasterScope (Erich Jaeger GmbH, Würzburg, Germany) according to ERS/ATS standardizations.21 Baseline values were averaged from three consistent measurements of IOS and spirometry performed at each visit. Post-bronchodilator measurements were performed in duplicates for each lung function test (first IOS and thereafter spirometry). The average (IOS) and best value (spirometry) of each time point was collected. IOS testing was performed during tidal breathing with the patient seated, wearing a nose clip and holding their palms on their cheeks as previously described.28
Variables recorded from the IOS readings included resistance at 5Hz (R5, reflecting total airway resistance), at 20Hz (R20, reflecting central airway resistance) and the resistance of the peripheral airways which was calculated by subtracting the resistance of the central airways from total lung resistance (R5-R20). Other IOS measurements include the reactance at 5 HZ (X5), resonant frequency (Fres) and reactance area (AX), all measures of the elastance of primarily the peripheral airways.
Spirometry was also performed with the patient seated and wearing a nose clip. Variables recorded from spirometry readings included FEV1, forced vital capacity (FVC) and maximal mid-expiratory flow (MMEF).
Statistics
The data were analyzed using GraphPad Prism Program version 9.3.0. A p < 0.05 was considered significant for all tests. Baseline data were averaged from three consistent repeats. All variables were analyzed as a percentage of baseline data. The change over time was analyzed within each bronchodilator, and the changes at each time compared to the baseline were compared between the bronchodilators using multiple comparisons. Spirometry values (FEV1, FVC and MMEF) were compared using a patient-matched 2-way RM ANOVA (assuming no sphericity) corrected for multiple comparisons between each time point with Šídák’s multiple comparisons test. IOS values (R5, R20, R5-R20, reactance at 5 Hz (X5), resonant frequency (Fres) and reactance area (AX)) were compared the same way as the spirometry but with a Mixed-effects analysis due to a few missing data values.
Maximum BDR in each variable (irrespective of the time point), as a percentage from baseline, was compared between bronchodilators using paired analysis. The data were first tested for normal distribution using 4 normality tests: Anderson-Darling, D’Agostino & Pearson, Shapiro–Wilk, and Kolmogorov–Smirnov. If all tests confirmed normality, the maximum BDR was compared using a patient-matched one-way ANOVA, with post-hoc testing using Holm-Šídák’s multiple comparisons test. If the data were not normally distributed, the maximum BDR was compared using the non-parametric Friedman's test and post-hoc testing using Dunn’s multiple comparisons test. An extrapolation of the percentage to where the plateau begun (YM) for each variable was calculated using the exponential plateau equation, only plateaus that were calculated to occur within an extrapolated 100 minutes were included. Patient characteristics and clinical readings were compared between the most and least response subgroups using the Spearman correlation.
Ethical Considerations and Reflections
The Regional Ethical Review Board in Lund, Sweden, approved the study. All patients signed written informed consent prior to the commencement of the study as per the Declaration of Helsinki.
Results
Spirometry of Bronchodilator Responsiveness in Asthma After SABA, SAMA, or Both Bronchodilators in Combination
The change over time in FEV1 (Δ% = a percent change from the baseline reading) was significantly different between the three bronchodilator tests (p = 0.024) where SAMA tended to be slower with less change from baseline while inhaling both bronchodilators in combination tended to have more change than SABA alone (Figure 1A). Inhalation of both bronchodilators in combination increased FEV1 (Δ%) significantly more than SAMA alone at 5 (p = 0.029), 10 (p = 0.047) and 15 minutes (p = 0.028) after inhalation. Briefly, the average maximum change of the FEV1 (as absolute volume in L) increased from 4.65 L to 4.84 L in SABA, 4.74 L to 4.85 L in SAMA and 4.69 L to 4.89 L in both bronchodilators in combination, and there was a significant difference between the bronchodialtor groups over time (p < 0.001), with a significant increase in the max volume change in the both bronchodilators in combination compared to SAMA alone (p = 0.0075). When comparing the maximum percentage change of FEV1 (maxΔ% = the maximum percentage change from the baseline reading) there were no significant differences, though SABA+SAMA had the highest average (15.6%) (Figure 1B). There were no differences over time nor any difference for the FVC (Δ%) or FVC (maxΔ%) between the bronchodilator tests (Figure 1C and D).
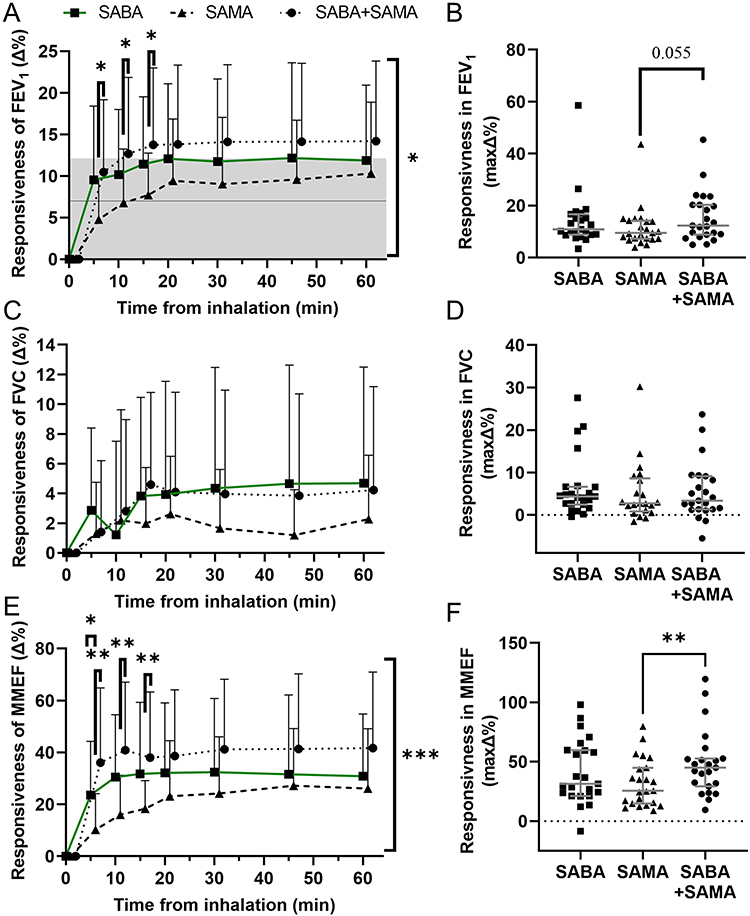 |
Figure 1 Bronchodilator responsiveness in spirometry readings as the percent (Δ%) change from the baseline for SABA, SAMA and SABA+SAMA. (A) Average percent change from baseline of FEV1 (Δ%) after inhaling SABA alone (■), SAMA alone (▲), or SABA+SAMA (●) at each timepoint. The solid line indicates the 7% cutoff for inclusion to the study and the grey box indicates the 12% threshold for clinically significant BDR. (B) The maximum percent change from baseline of FEV1 (maxΔ%), regardless of timepoint, for each patient with each bronchodilator (Note: graph is not showing 1 patient up around 80%). (C) Average MMEF (Δ%) for each bronchodilator and (D) the MMEF (maxΔ%) for each patient. (E) Average FVC (Δ%) for each bronchodilator (with 1 outlier removed at 10 minutes for SABA) and (F) the FVC (maxΔ%) for each patient. Statistics: change between bronchodilators (significance indicated at each timepoint) and change over time between bronchodilators (significance indicated on right side of graph) were compared with 2-way RM ANOVA, plots depict mean + SD (A, C and E), maximum was compared between bronchodilators with Friedman's test, plots show individual values including lines for median ± IQR (B, D and F), *p<0.05, **p<0.01, n = 23. |
The change over time in MMEF (Δ%) was significantly different between the three bronchodilator tests (p = 0.0005) where SAMA tended to be slower while both bronchodilators in combination tended to be faster than SABA alone (Figure 1E). Inhalation of SABA alone at 5 minutes (p = 0.042) and both bronchodilators in combination at 5 (p = 0.0015), 10 (p = 0.0011) and 15 minutes (p = 0.0052) after inhalation increased MMEF (Δ%) significantly more than SAMA alone. Both bronchodilators in combination led to a significantly higher increase (p = 0.0052) in MMEF (maxΔ%) than SAMA alone (Figure 1F).
Validating Bronchodilator Responsiveness of Bronchodilators Using the Cutoff of a 12% Increase in FEV1
The cutoff value of BDR, ie 12% increase in FEV1, was assessed for each bronchodilator test. Inhalation of both bronchodilators in combination resulted in the highest proportion of patients with a FEV1 (maxΔ%) above the cutoff, followed by SABA alone and the smallest proportion was from SAMA alone (Figure 2A). Of those that also reached a plateau of >12% improvement in FEV1, the average time it took to reach 12% was fastest when inhaling both bronchodilators in combination (n = 11), followed by the SABA alone (n = 10) and the longest time from SAMA alone (n = 8) (Figure 2B), whereby, the inhalation of SABA alone (p = 0.035) and both bronchodilators in combination was significantly faster than SAMA alone (p = 0.035).
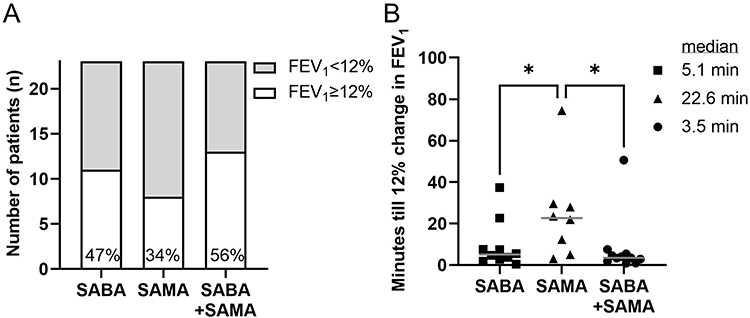 |
Figure 2 Assessing bronchodilator responsiveness of SABA, SAMA and SABA+SAMA using the increase in FEV1 of ≥12% as the cutoff. (A) Bars showing the proportion of patients that reached a maximum improvement of FEV1≥12% (white bar) after inhalation of SABA alone, SAMA alone, or SABA+SAMA. (B) Plot of times that it took to achieve 12% BDR interpolated from exponential plateaus per patient per bronchodilator test. Line presents median. Statistics: Mixed effects analysis, *p<0.05. |
IOS of Bronchodilator Responsiveness in Asthma After SABA, SAMA or Both Bronchodilators in Combination
All resistance variables (R5, R20 and R5-R20), as well as Fres and AX, were lowered in response to bronchodilators, while X5 showed less negative values. BDR of total resistance (R5 (Δ%)) did not differ between the bronchodilators over time p = (Figure 3A) nor at the R5 (maxΔ%) (Figure 3B). Central resistance (R20 (Δ%)) was significantly different between the bronchodilators (p = 0.0012), whereby SAMA alone was less potent in lowering the resistance after 5 minutes compared to SABA alone (p = 0.012) or both the bronchodilators in combination (p = 0.0034) (Figure 3C). Inhaling SABA alone had significantly higher R20 (maxΔ%) than SAMA alone (p = 0.019) (Figure 3D). In peripheral resistance, R5-R20 (Δ%), there was no significant difference over time between the bronchodilator tests (Figure 3E), nor at the R5-R20 (maxΔ%) (Figure 3F). The remaining IOS variables, ie X5 (Δ%), Fres (Δ%) and AX (Δ%), showed no significant differences between bronchodilators over time, nor comparing maximum change, but X5 showed a tendency to be less affected by SAMA (Figure 4); therefore, these three variables are not analyzed any further.
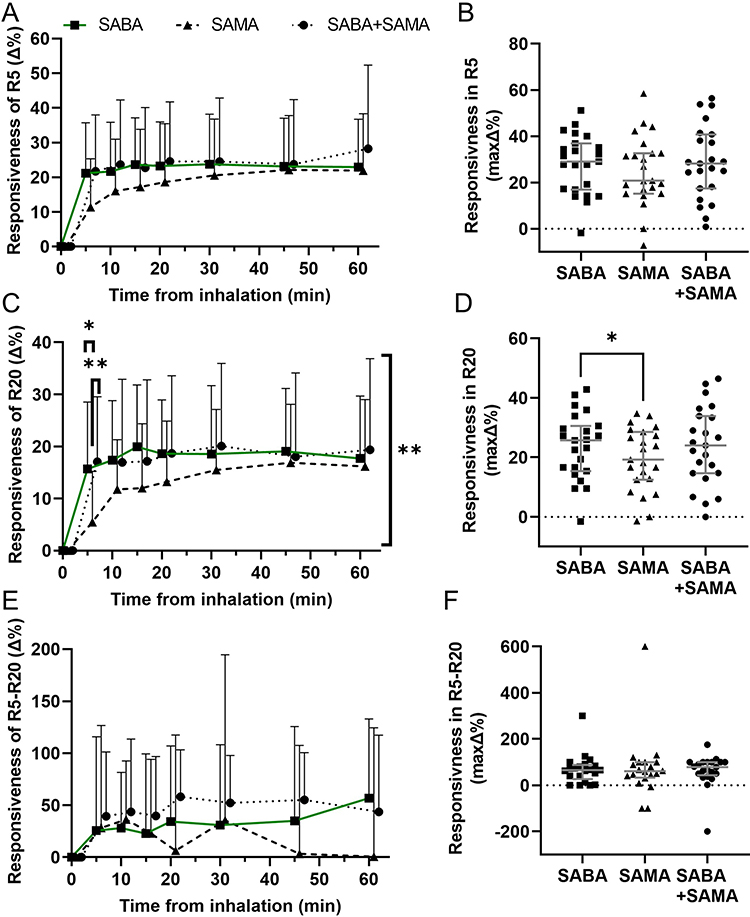 |
Figure 3 Bronchodilator responsiveness in IOS readings as the percent (Δ%) change from the baseline for SABA, SAMA and SABA+SAMA. (A) Average BDR in R5 (Δ%) after inhalation of SABA alone (■), SAMA alone (▲), or SABA+SAMA (●) at each timepoint. (B) Individual values of the maximum BDR of R5 (maxΔ%), regardless of timepoint, for each bronchodilator. (C) Average BDR of R20 (Δ%) for each bronchodilator and (D) the R20 (maxΔ%) for each patient. (E) Average BDR of R5-R20 (Δ%) for each bronchodilator and (F) the R5-R20 (maxΔ%) for each patient. Statistics: change between bronchodilators (significance indicated at each timepoint) and change over time between bronchodilators (significance indicated on right side of graph) were compared with Mixed effects analysis (A, C and E) and plots depict mean + SD. Maximum values were compared between bronchodilators with RM one-way ANOVA (B, D and F) and plots include median ± IQR. *p<0.05, **p<0.01, n = 19–23. |
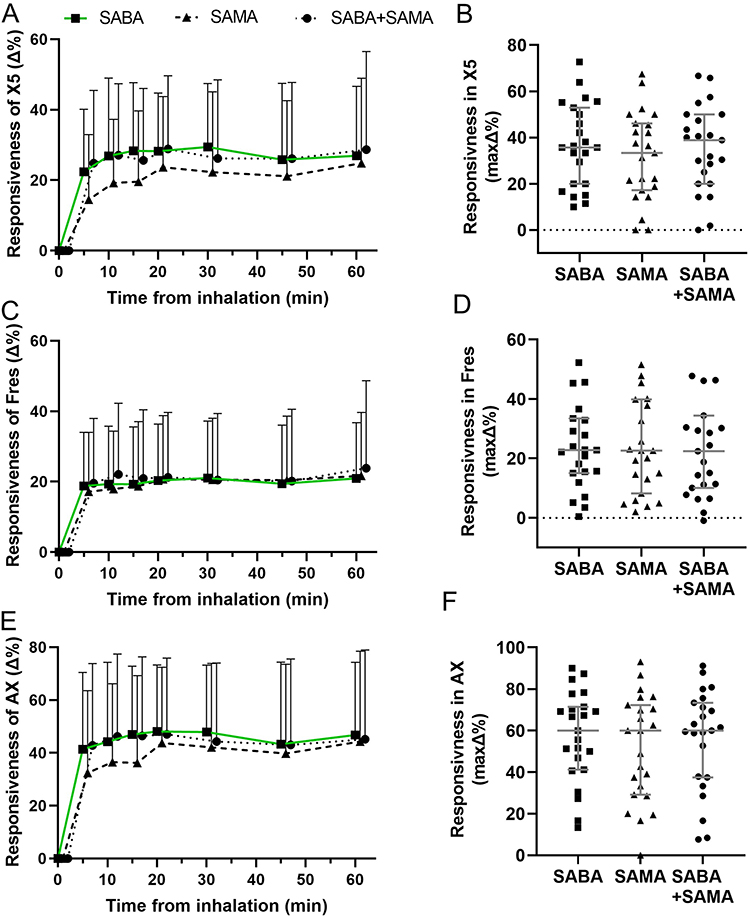 |
Figure 4 IOS readings of bronchodilator responsiveness (BDR) as the percent (Δ%) from the baseline for all bronchodilators. Average BDR of (A) X5 (Δ%), (B) Fres (Δ%) and (C) AX (Δ%) after inhaling SABA alone (■), SAMA alone (▲), or SABA+SAMA (●) at each timepoint. Statistics: bronchodilator effect over time were compared with Mixed effects analysis, plots depict mean + SD, n = 22–23. |
Comparing Rate of Significant Change and Plateau Level Between the Different Bronchodilators
In addition to the amount of BDR for each variable, the time for optimal bronchodilation and its maximum potential are also important variables to consider. To summarize the statistical differences seen over time in Figures 1 and 3 (as well as Supplementary Figure 2 and Supplementary Figure 3 respectively), the timepoint where there was no more significant change compared to future timepoints measured for each variable was condensed into Figure 5. This showed that inhaling both bronchodilators in combination significantly improved each variable from the baseline and was faster at reaching a point of no more significant change in every variable than either SABA or SAMA alone.
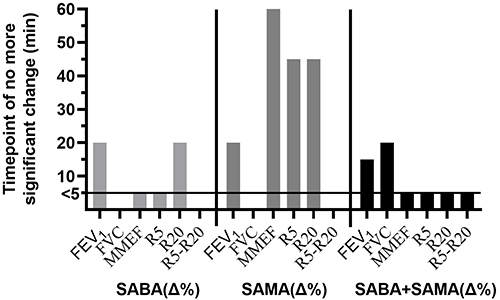 |
Figure 5 Comparison of the rate of significant change. The timepoint for each variable where the maximum effect was reached and there was no more significant change to future timepoints measured for each bronchodilator test (Supplementary figure 2 and Supplementary figure 3). “<5” minutes indicates no statistical change between baseline and 60 minutes. A missing bar indicates no statistically significant change from Baseline. |
We could see that within the 60 minutes we had not measured the full potential response of the bronchodilators; therefore, we did further analyses and extrapolated the curves to plot the plateau percentage of change for each variable (so long as it occurred within 100 minutes of the x-axis) (Figure 6). Overall, more patients reached a plateau in more variables when inhaling both bronchodilators in combination and the average plateau tended to be higher in FEV1, MMEF, R5 and R20 but lower in FVC and R5-R20 than inhaling SABA alone.
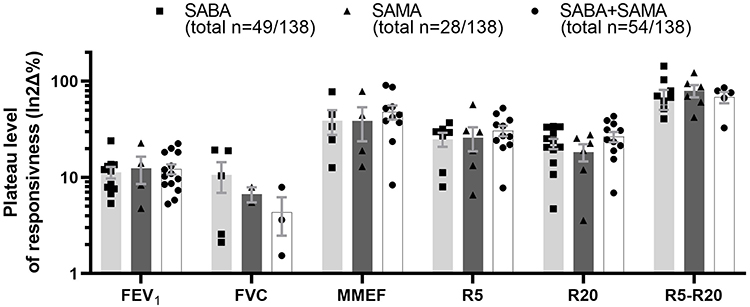 |
Figure 6 Plateau levels of the extrapolated responsiveness curves. The plateau level for each patient at each variable was calculated. Each dot represents a patient that has a plateau that was extrapolated using an exponential plateau up to the first 100 minutes. The total number of patients that reached a plateau within the extrapolated 100 minutes (combined for all patients that reached a plateau in FEV1+FVC+MMEF+R5+R20+R5-R20, the maximum being plateaus in all 23 patients × all 6 variables = 138), is given under each bronchodilator label. |
Most Responsive to Inhaling SABA+SAMA
Some patients were more responsive to inhaling both bronchodilators in combination than to SABA alone. Since FEV1, MMEF and R20 variables had significant difference(s) between the bronchodilator tests, these were used to define the “most” responsive to both bronchodilators in combination. Any patient that had a higher percentage of BDR in FEV1 (maxΔ%), MMEF (maxΔ%) and R20 (maxΔ%) in both bronchodilators in combination compared to SABA alone was considered most responsive (n = 7, 30%) (Figure 7A). The group of most responsive subjects had a tendency to a higher proportion of males (p = Figure 7B). Comparing the other subject characteristics (weight, height, age, BMI, FEV1%p and ACT) showed no difference between most and least responders. Importantly, the most responsive subgroup did not correlate to lower starting baseline values (averaged over the three visits) of FEV1 (L), FVC (L), MMEF (L/s), R5 (kPa*s/l) nor R20 (kPa*s/l) – ie this subgroup did not start with greater potential for a higher BDR.
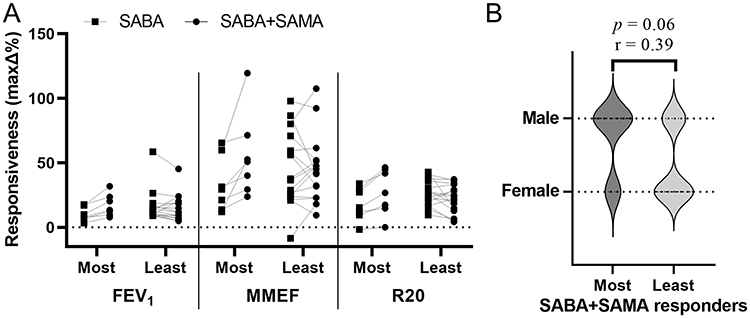 |
Figure 7 Most responsive subgroup to inhaling SABA+SAMA. Patients were separated based on those who had a higher BDR of all three of the FEV1 (maxΔ%), MMEF (maxΔ%) and R20 (maxΔ%) after inhaling SABA+SAMA compared to SABA alone, defined as “most” responsive (n = 7) and the remaining patients that were “least” responsive (n = 16). (A) Individual paired plots of responsiveness in FEV1, MMEF and R20 after SABA compared to SABA+SAMA. (B) Most and least responders were separated according to sex. Statistics: Spearman correlation comparing Most to Least responsive subgroups, *p<0.05. |
Discussion
We show with a joint assessment from both dynamic spirometry and IOS variables, the combination of inhaling SABA with SAMA can act just as fast as SABA alone but often reach a higher and more stable BDR in most central and peripheral related variables. More in-depth analysis of multiple variables was required to identify differences between the three BDR tests, including the number of patients reaching thresholds, the stability of the BDR, the maximum level of the BDR and the timing of the responsiveness.
Regarding the timing of the BDR, both spirometry and IOS readings indicated that SAMA was slower to act stably than SABA. In some variables, SAMA was not stable even within the 60 minutes analyzed. Repeating a similar study with a longer recording period could be useful since, based on spirometry, the reported onset of action of SAMA (ipratropium bromide) was 30–90 minutes while the onset of action for SABA agents was around 5–15 minutes.10 We found that the difference between the inhalation of either SABA or SAMA alone was most apparent in the comparatively longer time it took after SAMA to become significantly stable in the BDR for MMEF(Δ%) and R5(Δ%) that, together, could be used as a measure of the peripheral airways (Figure 5). In agreement with other combination studies, we found that by adding SAMA to SABA in combination, the timing for the onset was rescued back to similar times as taking SABA alone. Although time to effect is very important, duration of effect must also be taken into consideration. Interestingly, the combination of SAMA (ipratropium) and SABA (albuterol) therapy has previously been shown to have a duration approximately twice as long as SABA alone,29 indicating that combination therapy is not only as fast as SABA alone (as seen here and in other studies) but could also last longer.
Compared to the SABA alone, an additive effect from SABA+SAMA in mild-moderate patients with asthma was only minor when assessing the BDR at the different timepoints or the maximum BDR. A significant, additive effect of improvement in FEV1 has been reported in moderate-to-severe patients with persistent asthma (despite ICS treatment),29 however, the effects seem to be less obvious with less severe asthma. Looking at other parameters, inhaling SABA+SAMA was noticeably more consistent in increasing BDR quickly and maintained a more stable effect throughout the 60-minute testing period among more of the patients. For instance, the number of patients that could reach ≥12% increase in FEV1 or reach a plateau was higher when they inhaled SABA+SAMA compared to inhaling either alone. Additionally, the shorter time to no more significant change and higher plateau percentages for MMEF, R5 and R20 (for those that reached a plateau) verified the stability and strength of inhaling SABA+SAMA than taking either alone. We could not find any other studies that assessed the combination of SABA and SAMA in this way, but we recommend this analysis to be included to assist the usefulness of this combination.
Our results showed that SABA+SAMA had the greatest difference to the SAMA alone, which is in line with several other studies. One study reported that the combination of a SAMA (ipratropium bromide) and a SABA (fenoterol) performed significantly better in both FEV1 and MMEF when compared to the SAMA alone in children with acute asthma.30 Although we confirmed that monotherapy of SAMA is not superior to SABA as a reliever medication based on lung function tests,10,30 SAMA may still be of use to a subgroup of patients, particularly since it has less side effects than SABA.31 The additive effect has been debated, however, since several studies have found no such effects with similar combinations of bronchodilators in symptom scores or peak flow rates for chronic asthma and in peak expiratory flow rates in adult acute asthma.31,32 These contradictory conclusions may be due to the difference in the different asthma subgroups assessed and may have been more consistent if additional peripheral assessments, such as IOS, were included.
Although, overall, there was only a tendency for an additive effect, a few key patients were consistently most responsive in BDR when inhaling SABA+SAMA. To date, no subgroup analysis of other comparable studies has been included to identify a more responsive subgroup using a muscarinic antagonist combination; however, a recent Cochrane review hypothesizes that such a subgroup could benefit from the combination.31 In a SABA-only study comparing asthma characteristics between high-BDR and low-BDR patients, the low-BDR subgroup tended to include more males.33 In the present study, we found that more males benefitted most from the combination therapy and this could be the case for those previously reported as “low-BDR” using SABA-only.
This clinical study was able to investigate the effect of both types of short-acting bronchodilators in an asthma population that was naive to SAMA. The strength of this study was the paired comparison of the same patients over the three different bronchodilator tests in relatively quick succession. By repeating the baseline reading for each visit, the day-to-day variability was controlled for, and by analyzing the percentage of BDR the variability between patient baselines was also controlled for. Bronchodilators were delivered with an inhaler spacer that increased lung deposition in the lower airways.34 It is important to note, though, that other formulas and delivery devices may change the BDR. Only asthma patients with a BDR of ≥7% increase in FEV1 were included in the analyses. This cutoff was set to give us a group of patients with the lowest, but most repeatable, BDR spirometry reading that allowed for more responsive patients of the double therapy to be included even if they were not as responsive to the SABA alone.
One limitation was that our heterogeneous population of patients had large variations in current asthma medication use and ACT scores, indicating a varying asthma control. To validate the indications discussed in this paper, the study should be repeated with a larger cohort to combat the heterogeneous population of real-world recruitment. The study could also benefit from blinding the patients to the double number of inhalations taken for the combination of bronchodilators. Ideally, since one of the most prominent differences was found in MMEF, we should have adjusted this to the total lung capacity. Adjusting this for each patient would have enabled us to use MMEF as a better surrogate for peripheral airways,35 however, measurement of total lung capacity was not prioritized in this study as it would have required additional frequent measures in an already tight schedule.
Future studies could consider investigating the additive effect of SABA+SAMA within an asthma challenge model to elucidate if a combination therapy is more effective as a reliever medication in action.
Conclusion
In conclusion, we found that adding SAMA to SABA in combination specifically affected the FEV1, MMEF and R20, significantly so, and resulted in a faster, more stable response in more patients than inhaling SABA or SAMA alone. There was no statistically significant increase in taking SAMA alone or in combination with SABA compared to SABA alone; however, since SAMA is well tolerated, we believe it should be considered as a viable reliever/maintenance bronchodilator in the less severe stages of asthma.
Data Sharing Statement
Data will be available upon request to the corresponding author.
Acknowledgments
We would like to thank Edvin Vernersson for some of the initial patient investigations and the Unit for Lung and Allergy Research at Region Skåne for support and training.
Funding
This work was supported by independent research grants from the Swedish Heart-Lung Foundation and The Asthma and Allergy Association’s Research Fund. Neither funder had any involvement in any stage of the project.
Disclosure
The authors report no conflicts of interest in this work.
References
1. Asthma. GIf. Global Strategy for Asthma Management and Prevention, 2022; 2022. https://ginasthma.org/gina-reports/.
2. Graham BL, Steenbruggen I, Miller MR, et al. Standardization of Spirometry 2019 Update. An Official American Thoracic Society and European Respiratory Society Technical Statement. Am J Respir Crit Care Med. 2019;200(8):e70–e88. doi:10.1164/rccm.201908-1590ST
3. Janson C, Malinovschi A, Amaral AFS, et al. Bronchodilator reversibility in asthma and COPD: findings from three large population studies. Eur Respir J. 2019;54(3):1900561. doi:10.1183/13993003.00561-2019
4. Crisafulli E, Sartori G, Patruno V, Fantin A. Bronchodilator reversibility in patients with asthma and persistent airflow limitation. Lancet Respir Med. 2022;10(11):e94–e95. doi:10.1016/S2213-2600(22)00363-0
5. Mauer Y, Taliercio RM. Managing adult asthma: the 2019 GINA guidelines. Cleve Clin J Med. 2020;87(9):569–575. doi:10.3949/ccjm.87a.19136
6. Davis BE, Cockcroft DW. Effect of daily dosing with tiotropium against methacholine induced bronchoconstriction in asthmatics. Pulm Pharmacol Ther. 2022;77:102174. doi:10.1016/j.pupt.2022.102174
7. Matera MG, Cazzola M. Muscarinic Receptor Antagonists. Handb Exp Pharmacol. 2017;237:41–62. doi:10.1007/164_2016_68
8. Kirkland SW, Vandenberghe C, Voaklander B, Nikel T, Campbell S, Rowe BH. Combined inhaled beta-agonist and anticholinergic agents for emergency management in adults with asthma. Cochrane Database Syst Rev. 2017;1(1):Cd001284. doi:10.1002/14651858.CD001284.pub2
9. Papi A, Brightling C, Pedersen SE, Reddel HK. Asthma. Lancet. 2018;391(10122):783–800. doi:10.1016/S0140-6736(17)33311-1
10. Teoh L, Cates CJ, Hurwitz M, Acworth JP, van Asperen P, Chang AB. Anticholinergic therapy for acute asthma in children. Cochrane Database Syst Rev. 2012;(4):CD003797. doi:10.1002/14651858.CD003797.pub2
11. Cazzola M, Calzetta L, Matera MG. Long-acting muscarinic antagonists and small airways in asthma: which link? Allergy. 2021;76(7):1990–2001. doi:10.1111/all.14766
12. Kew KM, Dahri K. Long-acting muscarinic antagonists (LAMA) added to combination long-acting beta2-agonists and inhaled corticosteroids (LABA/ICS) versus LABA/ICS for adults with asthma. Cochrane Database Syst Rev. 2016;2016(1):CD011721. doi:10.1002/14651858.CD011721.pub2
13. Jarenbäck L, Eriksson G, Peterson S, Ankerst J, Bjermer L, Tufvesson E. Bronchodilator response of advanced lung function parameters depending on COPD severity. Int J Chron Obstruct Pulmon Dis. 2016;11:2939–2950. doi:10.2147/copd.S111573
14. van den Bosch WB, James AL, Tiddens H. Structure and function of small airways in asthma patients revisited. Eur Respir Rev. 2021;30(159):200186. doi:10.1183/16000617.0186-2020
15. Postma DS, Brightling C, Baldi S, et al. Exploring the relevance and extent of small airways dysfunction in asthma (ATLANTIS): baseline data from a prospective cohort study. Lancet Respir Med. 2019;7(5):402–416. doi:10.1016/S2213-2600(19)30049-9
16. Almeshari MA, Alobaidi NY, Sapey E, Usmani O, Stockley RA, Stockley JA. Small Airways Response to Bronchodilators in Adults with Asthma or COPD: a Systematic Review. Int J Chron Obstruct Pulmon Dis. 2021;16:3065–3082. doi:10.2147/COPD.S331995
17. McFadden ER, Linden DA. A reduction in maximum mid-expiratory flow rate. A spirographic manifestation of small airway disease. Am J Med. 1972;52(6):725–737. doi:10.1016/0002-9343(72)90078-2
18. Kwon DS, Choi YJ, Kim TH, et al. FEF(25-75%) Values in Patients with Normal Lung Function Can Predict the Development of Chronic Obstructive Pulmonary Disease. Int J Chron Obstruct Pulmon Dis. 2020;15:2913–2921. doi:10.2147/COPD.S261732
19. Garg V, Parakh A. Spirometry vs Impulse oscillometry in evaluation of children with asthma. Eur Respir J. 2020;56(suppl 64):2647. doi:10.1183/13993003.congress-2020.2647
20. Xu J, Sun X, Zhu H, et al. Long-term variability of impulse oscillometry and spirometry in stable COPD and asthma. Respir Res. 2022;23(1):262. doi:10.1186/s12931-022-02185-5
21. Miller MR, Hankinson J, Brusasco V, et al. Standardisation of spirometry. Eur Respir J. 2005;26(2):319–338. doi:10.1183/09031936.05.00034805
22. Kaminsky DA. What does airway resistance tell us about lung function? Respir Care. 2012;57(1):85–96. doi:10.4187/respcare.01411
23. Bates JHT, Irvin CG, Farré R, Hantos Z. Oscillation Mechanics of the Respiratory System. Compr Physiol. 2017;548.
24. Goldman MD, Saadeh C, Ross D. Clinical applications of forced oscillation to assess peripheral airway function. Respir Physiol Neurobiol. 2005;148(1–2):179–194. doi:10.1016/j.resp.2005.05.026
25. Oostveen E, Boda K, van der Grinten CP, et al. Respiratory impedance in healthy subjects: baseline values and bronchodilator response. Eur Respir J. 2013;42(6):1513–1523. doi:10.1183/09031936.00126212
26. Bossé Y. Understanding the fundamentals of oscillometry from a strip of lung tissue. Front Physiol. 2022;13. doi:10.3389/fphys.2022.978332
27. Oostveen E, MacLeod D, Lorino H, et al. The forced oscillation technique in clinical practice: methodology, recommendations and future developments. Eur Respir J. 2003;22(6):1026–1041. doi:10.1183/09031936.03.00089403
28. Jarenbäck L, Ankerst J, Bjermer L, Tufvesson E. Acinar ventilation heterogeneity in COPD relates to diffusion capacity, resistance and reactance. Respir Med. 2016;110:28–33. doi:10.1016/j.rmed.2015.11.005
29. Gelb AF, Karpel J, Wise RA, Cassino C, Johnson P, Conoscenti CS. Bronchodilator efficacy of the fixed combination of ipratropium and albuterol compared to albuterol alone in moderate-to-severe persistent asthma. Pulm Pharmacol Ther. 2008;21(4):630–636. doi:10.1016/j.pupt.2008.02.005
30. Watson WT, Becker AB, Simons FE. Comparison of ipratropium solution, fenoterol solution, and their combination administered by nebulizer and face mask to children with acute asthma. J Allergy Clin Immunol. 1988;82(6):1012–1018. doi:10.1016/0091-6749(88)90138-8
31. Westby M, Benson M, Gibson P. Anticholinergic agents for chronic asthma in adults. Cochrane Database Syst Rev. 2004;2004(3):CD003269. doi:10.1002/14651858.CD003269.pub2
32. Salo D, Tuel M, Lavery RF, Reischel U, Lebowitz J, Moore T. A randomized, clinical trial comparing the efficacy of continuous nebulized albuterol (15 mg) versus continuous nebulized albuterol (15 mg) plus ipratropium bromide (2 mg) for the treatment of acute asthma. J Emerg Med. 2006;31(4):371–376. doi:10.1016/j.jemermed.2006.05.025
33. Graff S, Bricmont N, Moermans C, et al. Clinical and biological factors associated with irreversible airway obstruction in adult asthma. Respir Med. 2020;175:106202. doi:10.1016/j.rmed.2020.106202
34. Rau JL. The inhalation of drugs: advantages and problems. Respir Care. 2005;50(3):367–382.
35. Cockcroft DW, Berscheid BA. Volume Adjustment of Maximal Midexpiratory Flow: importance of Changes in Total Lung Capacity. Chest. 1980;78(4):595–600. doi:10.1378/chest.78.4.595
 © 2024 The Author(s). This work is published and licensed by Dove Medical Press Limited. The full terms of this license are available at https://www.dovepress.com/terms.php and incorporate the Creative Commons Attribution - Non Commercial (unported, v3.0) License.
By accessing the work you hereby accept the Terms. Non-commercial uses of the work are permitted without any further permission from Dove Medical Press Limited, provided the work is properly attributed. For permission for commercial use of this work, please see paragraphs 4.2 and 5 of our Terms.
© 2024 The Author(s). This work is published and licensed by Dove Medical Press Limited. The full terms of this license are available at https://www.dovepress.com/terms.php and incorporate the Creative Commons Attribution - Non Commercial (unported, v3.0) License.
By accessing the work you hereby accept the Terms. Non-commercial uses of the work are permitted without any further permission from Dove Medical Press Limited, provided the work is properly attributed. For permission for commercial use of this work, please see paragraphs 4.2 and 5 of our Terms.