")
Back to Journals » International Journal of Nanomedicine » Volume 19
Analysis of Optimal Treatment Starting Time for Photothermal Therapy Through Analysis of Diffusion Behavior of Gold Nanoparticles
Received 29 November 2023
Accepted for publication 28 February 2024
Published 3 April 2024 Volume 2024:19 Pages 3167—3186
DOI https://doi.org/10.2147/IJN.S452470
Checked for plagiarism Yes
Review by Single anonymous peer review
Peer reviewer comments 2
Editor who approved publication: Dr Kamakhya Misra
Donghyuk Kim, Hyunjung Kim
Department of Mechanical Engineering, Ajou University, Suwon-si, Gyeonggi-do, 16499, Korea
Correspondence: Hyunjung Kim, Email [email protected]
Introduction: Due to its distinct advantage of non-invasive application in treatment, photothermal therapy (PTT) is being studied by many researchers to reduce the need for surgical incisions. It is characterized by the injection of nanoparticles into biological tissue as photothermal agents (PTAs) which diffuse within the tissue. In this study, the diffusion behavior of various doses of gold nanoparticles (AuNPs) injected into tumor tissues is analyzed and the effectiveness of PTT at each elapsed time after injection is confirmed by numerical analysis.
Methods: The diffusion behavior of AuNPs within biological tissues is assessed using the convection-diffusion equation, while the temperature distribution is determined using the Pennes bioheat transfer equation. In addition, the effect of the diffusion behavior of AuNPs on the effectiveness of PTT is quantitatively confirmed by analyzing the temperature distribution in the medium through the apoptotic variable. Numerical simulation parameters are selected with doses ranging from 100 to 400 μg/mL, elapsed time after injection from 1 min to 24 h, and laser power ranging from 0 to 1 W.
Results: After evaluating PTT’s efficacy in every situation, it was discovered that a dosage of 100– 300 μg/mL produced the best therapeutic result, with the highest impact occurring 12 hours after injection. In contrast, when the dosage was 400 μg/mL, the highest therapeutic effect was achieved after 18 hours post-injection. Additionally, it was discovered that the ideal laser power at each injection dose was 0.22, 0.14, 0.12, and 0.12 W, respectively.
Conclusion: The conditions required to achieve the optimal treatment effect at each dosage, presented here, are expected to accelerate the commercialization of PTT.
Keywords: apoptosis, elapsed time after injection, gold nanoparticles, injection dose, photothermal therapy, thermal damage
Introduction
Photothermal therapy (PTT), an anti-cancer treatment technique that utilizes lasers, is being studied by many researchers due to its non-invasive nature.1–3 Unlike conventional treatment techniques, PTT is performed without incisions, resulting in no bleeding, fast recovery, and no scarring.4 The therapeutic mechanism of PTT is the photothermal effect, which refers to the conversion of light energy into heat energy.5 Due to this photothermal effect, tumors are killed by increasing the temperature of the affected area irradiated by the laser. Biological tissues undergo different mechanisms of cell death depending on temperature.6 From 43–50 °C, death occurs in the form of apoptosis, in which cells die on their own. At temperatures above 50 °C, death occurs in the form of both necrosis and leakage of intracellular contents, resulting in a risk of cancer metastasis. PTT utilizes a variety of laser wavelengths to achieve different temperatures in the target tissues.7–9 Among these, lasers in the near-infrared region have the advantage of deep penetration, but the disadvantage that the amount of laser energy that can be absorbed by the medium is small and does not cause a sufficient temperature increase.10,11 Due to these characteristics, if only near-infrared lasers are used, there is a possibility of unnecessary thermal damage due to the absorption of laser energy by healthy tissue as well as tumor tissue. To address this, photothermal agents (PTAs) are used to enhance the light absorption coefficient of tumor tissue.12–14 PTAs, which enhance laser absorption at specific wavelengths by the phenomenon of localized surface plasmon resonance (LSPR), are largely manufactured from noble metal series and polymer series.15 Each material comes with advantages and disadvantages, and its selection for treatment is determined by the specific circumstances.16,17
Research on PTT is ongoing. Hu et al18 created a supramolecular drug nanocarrier to co-deliver nitric oxide (NO) and the photothermal agent DCTBT with the NIR-II aggregation-induced emission (AIE) characteristic for mild-temperature PTT to improve the therapeutic efficacy, which is limited by cancer cells’ thermotolerance. It was confirmed that NO was effectively released from the fabricated carrier, and reactive oxygen species (ROS) and high heat were generated when irradiated with 808 nm laser. It was also confirmed that the generated ROS reacted with NO to produce nitric oxide, which reduced the heat resistance of cancer cells. Cheong et al19 confirmed the therapeutic effect by changing the heterogeneous distribution of gold nanorods (GNRs) in PTT. Through this, it was confirmed that the laser irradiation time and volume fraction of injected GNRs required to completely kill the tumor were different depending on the distribution of each injection. Yin et al20 created nanohybrids to control copper overexpression in tumors for preventing malignant tumor growth and metastasis. The nanohybrids induced copper-dependent photothermal damage in the tumors and inhibited copper deficiency-induced metastasis. Created nanohybrids inhibited angiogenesis and tumor migration by ionically reacting with copper in tissues during treatment, reducing copper content, and caused aggregation of AuNPs through molecular synthesis between arzido and alkynyl on the surface of AuNPs. Finally, it was confirmed that this generates photothermal agents in tumor tissue and improves the retention time of PTT. Gheflati et al21 analyzed the cooling effect of non-uniform distribution of gold nanoparticles in a tumor and the presence of blood vessels in the center of the tumor by performing PTT through numerical analysis. The analysis was performed by varying the blood flow velocity, laser radius, laser intensity, and volume fraction of gold nanoparticles, and the diffusion distribution of gold nanoparticles and the temperature distribution in the tissue were determined by Beer-Lambert law, conjugate heat transfer equation, and mass equation. However, this study only confirmed the temperature field at a few specific points after gold nanoparticles injection and did not evaluate the therapeutic effect of PTT. Kim et al22 proposed conditions that maximize the photothermal therapy effect by changing the distribution radius of gold nanoparticles within the tumor. The study calculated the optical properties of gold nanoparticles, the distribution of laser heat in the medium, and the resulting temperature distribution. Furthermore, the treatment effect was quantitatively confirmed through apoptotic variables. However, this study simulated treatment based on a fixed specific distribution of GNPs, and did not confirm diffusion behavior over time.
Reviewing the literature, most studies have focused on creating new PTA. To increase photothermal conversion efficiency, various materials are being synthesized and the resulting PTT effect is being confirmed. As PTT is based on heat transfer, it requires rigorous analysis of thermal behavior in biological tissue. However, many studies are confirming the treatment effect in specific cases through in vitro and in vivo experiments without theoretical analysis. In addition, biological tissues exhibit diverse forms of damage (up to and including death) at different temperature levels, yet thermal damage is typically assessed using a specific temperature threshold. Furthermore, in practical situations, when PTA is injected into tumor tissue, the distribution range of PTA varies over time due to diffusion, but previous studies have assumed that PTA is uniformly distributed in all parts of the tumor or is situated in a specific fixed location. To address these shortcomings, this study investigated time-dependent diffusion behavior following the injection of varying doses of PTA. Subsequently, the efficacy of PTT was confirmed through numerical analysis. In addition, to quantitatively determine the extent to which apoptosis was sustained within the tumor tissue and the degree of thermal damage to the adjacent healthy tissue, the apoptotic variable proposed by Kim et al23 was utilized. Finally, the temperature distribution in the biological tissue was determined by varying the PTT parameters, including the intensity of laser irradiation, PTA dose, and time elapsed after PTA injection. Analysis of these variations led to the identification of the optimal treatment effect.
Material and Methods
Theoretical Analysis of Diffusion Behavior of Photothermal Agents
In this study, the convection-diffusion equation was used to analyze the diffusion behavior after intratumoral PTA injection, as shown in (Equation 1).24 The equation is a combination of diffusion and convection equations that physically describe the transportation of particles due to these two processes.
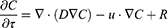

where C, D, u, and R are the species concentration of PTA, diffusion coefficient, velocity, and source or sink of quantity, respectively. The diffusion coefficient D was calculated using the Stokes-Einstein equation in (Equation 2).25 This expression reflects the degree of diffusion that varies with the radius of the nanoparticle and represents the diffusion coefficient of the particle in a medium with a low Reynolds number. Here, KB, T, η, and reff represent the Boltzmann constant, temperature, dynamic viscosity, and effective radius of the particle, respectively. KB is 1.38∙10−23 J/K and η is set to 8.9∙10−4 Pa∙s.26 In this manner, the distribution of PTA in the medium can be calculated by analyzing the diffusion behavior over time following PTA injection.
Theoretical Analysis of Thermal Behavior in Biological Tissues
This study employed the Pennes bioheat transfer equation to analyze the thermal behavior within biological tissue when subjected to laser irradiation after the injection of PTA into tumor tissue, as shown in (Equation 3).27 The equation assumes that the heat transferred by blood flow and the heat generated by metabolism occur uniformly in the biological tissue, and describes the temperature change over time by considering the amount of heat transferred by each heat source through the thermal conductivity coefficient of the tissue.
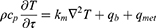

where ρ, cp, and km are the density, specific heat, and thermal conductivity, respectively, and qb and qmet are the heat generation terms due to blood flow and metabolism, respectively. qb is expressed as in (Equation 4)and can be calculated from the density of blood, perfusion coefficient (ωb), specific heat and temperature difference with blood. As the laser provides an additional heat source, the traditional Pennes bioheat transfer equation can be transformed into the representation shown as (Equation 5).
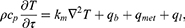

where ql represents the amount of heat delivered by the laser. It can be calculated from the light absorption coefficient (μabs) and attenuation coefficient (μtot) of the medium, the intensity of the laser (Pl), and the radius of the laser (rl), as shown in (Equation 6). μtot can be calculated as the sum of the μabs and the reduced scattering coefficient (μ’sca), which allows the temperature distribution within the medium irradiated by the laser to be calculated.
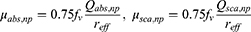


To calculate the ql, the optical properties of the medium must be determined. The optical properties of the biological tissue and the injected PTA should be obtained. In this study, the correlation proposed by Dombrovsky et al28 was utilized to calculate the optical properties of PTA. The correlation can be calculated through the volume fraction of the injected PTA (fv), the optical efficiency (Q), and reff as shown in (Equation 7), and μabs and the scattering coefficient (μsca) are calculated, respectively. μ’sca can be calculated from μsca and the anisotropy factor g, as shown in (Equation 8), where g is a dimensionless number representing the distribution from which light is scattered. Once the optical properties of the PTA are calculated, the optical properties of the entire medium with PTA injected can be calculated by summing the optical properties of the medium itself and the optical properties of the PTA, as shown in (Equation 9).
Numerical Geometry and Calculation Conditions
In this study, squamous cell carcinoma (SCC) was selected as the target tumor. This is because the incidence rate is steadily rising every year, and it is the most common and highest incidence rate among various skin cancers.29,30 Accordingly, The PTT for SCC of the skin was simulated through numerical analysis. Figure 1 shows a schematic of the numerical model, which assumes that the entire skin layer is a cuboid with a length, width, and depth of 10, 10, and 4.2 mm, respectively. The skin is composed of four layers: epidermis, papillary dermis, reticular dermis, and subcutaneous fat. In addition, it was assumed that an SCC, radius and depth of 2 mm, at the center arises from the skin surface. The wavelength of the irradiated laser was set to 1064 nm and the radius was set to 2 mm, the same as SCC. Table 1 summarizes the various physical properties for each skin layer and SCC used in the numerical simulations.31–35
 |
Figure 1 Schematic of numerical model. |
 |
Table 1 Thermal and Optical Properties of Skin Layers and SCC31–35 |
Among the various nanoparticle materials, gold nanoparticles, which are most commonly used in this study, were selected as PTA. In the case of PTA shape, the rod-type was selected as it has higher absorption efficiency than other shapes.36 Based on the gold nanorods (GNRs) offered by Sigma Aldrich Co., an aspect ratio of 6.67 was chosen for GNRs that were used. They are distributed in H2O at a 35 ug/mL concentration. After that, using the DDA method, the absorption and scattering efficiencies for GNRs were computed according to different radii.37 The effective radius of 20 nm was found to yield the maximum absorption efficiency. Thus, It was selected that GNRs with an aspect ratio of 6.67 and a radius of 20 nm. Calculated absorption and scattering efficiency was 22.11, 4.91, respectively.36 The injection of GNRs into the tumor was assumed to be in situ injection. For the investigation of the diffusion behavior, the analysis assumed the injection of GNRs in a hemispherical shape with an initial radius of 0.25 mm, and performed numerical analysis. The dosage of the injected GNRs was increased incrementally in four steps from 100 to 400 μg/mL. In addition, to confirm the treatment effect over time after injection, the treatment was divided into 14 stages from 1 min to 24 h after injection of GNRs. The effectiveness of the treatment was evaluated for each specific time point post-injection. For the laser, the irradiation time was fixed at 200 s in all cases, and the intensity was set incrementally in 51 steps from 0 W to 1 W in 0.02 W increments. All numerical conditions are summarized in Table 2.
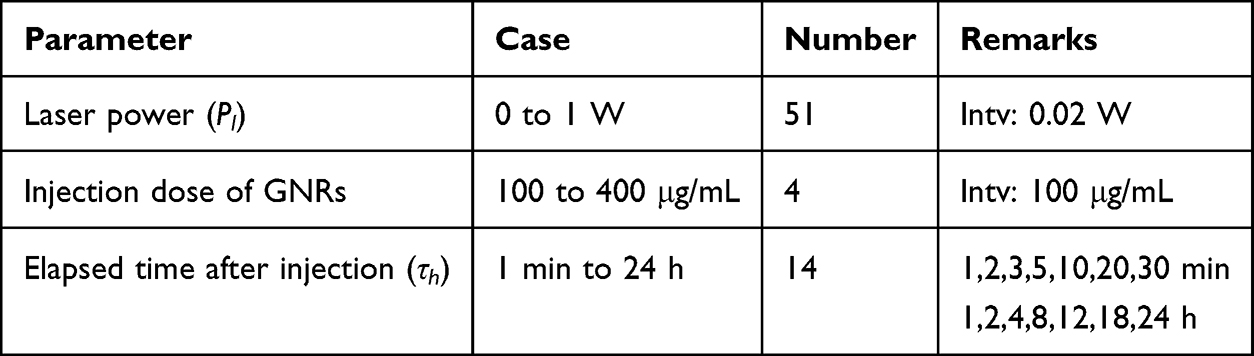 |
Table 2 Parameters of Numerical Analysis |
Results and Discussion
Numerical Analysis Validation (Diffusion and Temperature Behavior)
To validate the numerical model presented in this study, a comparison and validation process was performed by aligning the results of the study with those of Gheflati et al.21 The results of Gheflati et al21 results were compared and verified through the experimental results performed by Paul et al.38 Accordingly, it is believed that comparing and verifying the numerical modeling presented in this study with the research results of Gheflati et al21 will also be able to simulate the actual situation well. Their model assumes a cylindrical tumor with a radius and depth of 5 mm in the center of a cuboidal section of healthy tissue with a width of 50 mm, a length of 100 mm, and a height of 20 mm. GNRs are injected into the center of the tumor, and it is assumed that the initially injected GNRs are in the shape of a cylinder with a radius and length of 0.5 and 1 mm, respectively. The initial concentration of GNRs was set to 1.661∙10−6 mol/m3 and the external concentration was set to 0 mol/m3. The diffusion coefficient was set to 9∙10−11 m2/s inside the tumor and 9∙10−12 m2/s for healthy tissue. For diffusion, a comparison was made between the outcomes observed at the 2-hour and 4-hour marks post-injection, and for temperature, the laser irradiation was applied for 300 s at precisely the 3-hour mark after injection.
Figure 2 is a comparison of the diffusion behavior in the depth direction relative to the center over a period of 2–4 h after injection. The results shown by the lines are those of Gheflati et al21 while the results shown by the dots are those obtained using the numerical model proposed in this study. The diffusion behavior is observed to be an appropriate match. Figure 3 shows the temperature in the y direction at a point where x = 0 mm and z = 2.5 mm. At precisely 3 hours after insertion, laser irradiation was applied for 300 s, and the temperature distribution was found to be in agreement. These results validate the numerical model.
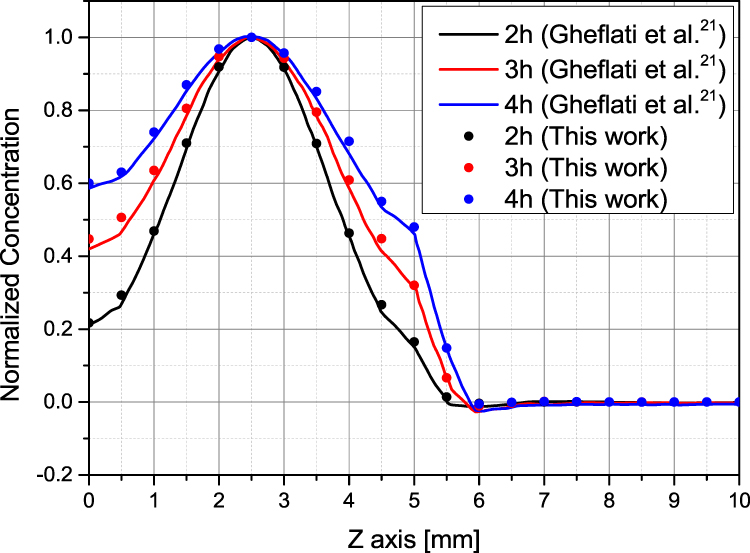 |
Figure 2 Diffusion validation result.21 |
 |
Figure 3 Temperature validation result.21 |
Diffusion Behavior Analysis in Biological Tissues
In this investigation, GNRs were injected into SCC for treatment. The study aimed to discern the dispersion pattern of GNRs in SCC through diffusion, and establish the progressive impact of PTT following the injection. Consequently, the initial focus of the study involved an analysis of the diffusion behavior within SCC.
Figure 4 shows the diffusion distribution in the radial direction from the center of the SCC at x = 0 mm, z = −1 mm after the injection of GNRs in the SCC. The green-shaded portion of the graph represents the SCC region. (Figure 4a) shows the diffusion distribution by dose at the 2-hour point after injection. It was confirmed that the concentration decreases along the radial direction from the central point, and it was confirmed that the GNRs concentration of SCC increased as the injection dose increased. (Figure 4b and c) shows the diffusion distribution radially from the center as a function of τh for a dose of 200 μg/mL. Up to 5 minutes after the injection of GNRs, the concentration in the center of the tumor is below 10−15 orders of magnitude and cannot be seen in the graph, and it was found that the concentration within the SCC varies along the radial direction relative to the center of the SCC with each time interval τh, and the concentration of GNRs reached its peak when τh equaled 4 h. This confirms that GNRs cannot diffuse to the depth-directional center of the SCC (z = −1 mm) before τh = 4 h, resulting in a low concentration, and that the diffused GNRs have a maximum value at τh = 4 h. After 4 h, diffused GNRs spread over a wider area in the x-direction, lowering the concentration at the location under analysis. Based on these results, the diffusion behavior was analyzed in all cases, and the distribution of GNRs in the SCC at each time τh after injection was determined. In addition, by calculating the absorption and scattering coefficients within the medium, which vary with the changing concentration of GNRs as diffusion proceeds, the changes in absorbed laser energy are accounted for in the calculation.
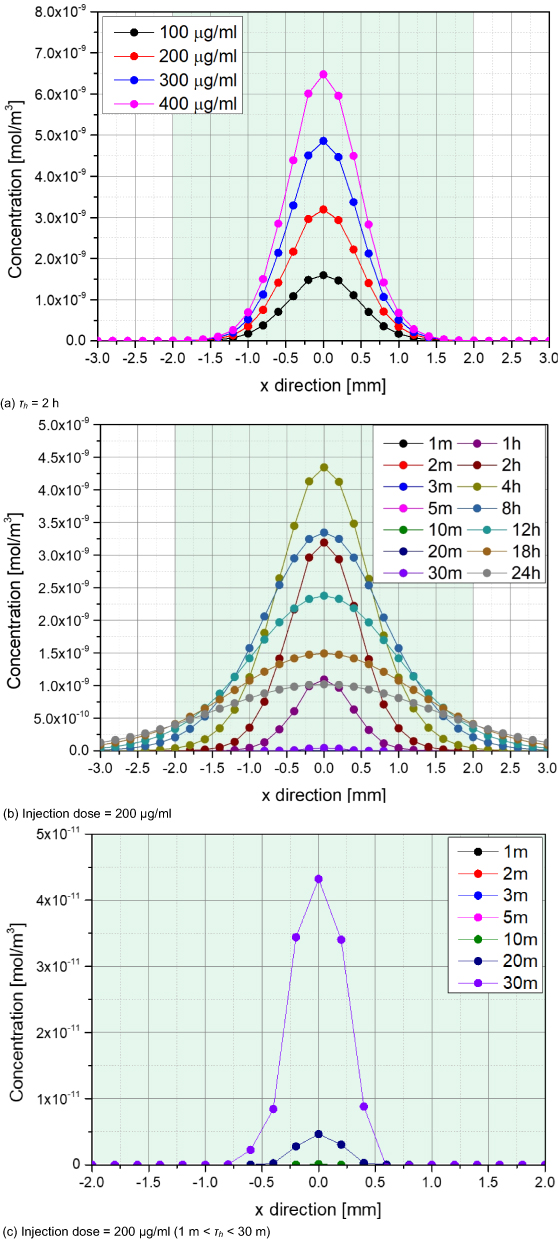 |
Figure 4 Radial Concentration Distribution (center position, depth = 1 mm). (a) τh = 2 h; (b) Injection dose = 200 μg/mL; (c) Injection dose = 200 μg/mL (1 m < τh < 30 m). |
Temperature Distribution Analysis in Biological Tissues
In Section “Diffusion behavior analysis in biological tissues”, the diffusion behavior of GNRs in the SCC as a function of time was analyzed, and based on this, the total optical properties of the medium were calculated through (Equations 7–9), facilitating analysis of the change in the amount of laser energy absorbed. Finally, the temperature variation with laser irradiation time was investigated for different elapsed times τh after the GNRs were injected.
Figure 5 shows the temperature variation with laser irradiation time at a location 1 mm deep (x = 0 mm, z = −1 mm) in the center of the SCC. The red-shaded portion of the graph indicates the temperature range within which apoptosis occurs. The total laser irradiation time and power were fixed at 200 seconds and 0.2 W, respectively. (Figure 5a) shows the temperature variation with laser irradiation time when τh is 2 h. Higher temperatures are reached as the injection dose of GNRs increases, because the optical absorption coefficient of the medium increases, allowing it to absorb more laser energy. (Figure 5b) shows the temperature variation as a function of elapsed time after injection. As previously confirmed in Section “Diffusion behavior analysis in biological tissues”, the concentration of GNRs at the center of the SCC was highest at τh = 4 h, with a corresponding peak in temperature due to laser irradiation occurring 4 h after injection. However, the apoptosis temperature within the SCC reaches its peak when τh is 24 h. Given these considerations, this study established the temperature distribution within the medium in all cases according to the proposed numerical simulation parameters of injection dose, τh, and Pl. This enabled determination of the conditions that maximize the apoptosis temperature in the entire SCC while minimizing the thermal damage to the surrounding healthy tissue.
 |
Figure 5 Temperature variation with laser irradiation time (center position, depth = 1 mm, Pl = 0.2 W). (a) τh = 2 h; (b) Injection dose = 200 μg/mL. |
Examination of Apoptosis Temperature Range in Tumor Tissue
The essence of PTT is to induce death by raising the temperature of the targeted tumor. Excessive temperature increases can cause necrosis, which can lead to cancer metastasis, hence it is very important to maintain the temperature range of apoptosis to only kill the tumor. To quantitatively analyze these points, the apoptotic variables proposed by Kim et al23 and Kim et al39 were utilized. Among these metrics, the apoptosis retention ratio (θ*A) stands out as it offers a quantitative measure of how effectively the tumor tissue maintains the temperature conducive to apoptosis. It is calculated that the time-averaged value of the apoptosis ratio (θA), which represents the proportion of the total tumor volume to the volume corresponding to a temperature of 43~50 °C, where apoptosis is known to occur. The minimum value is 0 and the maximum is 1, indicating that all regions within the tumor are in the apoptosis temperature range. This allows for quantitative determination of the degree to which apoptosis is maintained in the treated SCC over the treatment time.
Figure 6 shows θ*A as a function of Pl and τh for each injection dose. Although it is difficult to visually distinguish between τh from 1 m to 1 h, it was confirmed that the maximum θ*A decreases at each τh. Conversely, after τh = 1 h, the maximum value of θ*A that can be obtained for each τh increases. Initially upon injection, GNRs are concentrated at the injection location and have a high light absorption coefficient, so excessive heat generation occurs and the temperature in the vicinity rises very high. However, in other parts of the tissue, no heat is generated, and the temperature cannot rise to the temperature range necessary for apoptosis. This trend is maintained until the 1-hour mark, but thereafter, the diffusion of GNRs proceeds and a relatively low concentration of GNRs is distributed inside the SCC, reducing the light absorption coefficient and resulting in a minor rise in temperature. This is determined to increase θ*A because it rises to the appropriate temperature range, increasing the area within the SCC that corresponds to the apoptosis temperature range. With respect to the injection dose, it was confirmed that Pl, where θ*A is at its peak, decreases as injection dose increases. This means that as injection dose increases, more GNRs are distributed within the SCC, and the light absorption coefficient of the medium increases accordingly, resulting in an increase in temperature at the same Pl. This results in a lower magnitude of Pl to avoid excessive temperature rise and optimize the temperature range conducive to apoptosis. However, in PTT, it is not enough to simply identify the apoptosis temperature range inside the SCC; it is also necessary to determine the presence and degree of thermal damage caused by heat transfer to the surrounding healthy tissue. This will be covered in the next section reviewing thermal damage to healthy tissue.
Figure 6 Continued. Figure 6 Apoptosis retention ratio(θ*A) for various Pl and τh. (a) Injection dose = 100 μg/mL; (b) Injection dose = 200 μg/mL; (c) Injection dose = 300 μg/mL; (d) Injection dose = 400 μg/mL.

Examination of Thermal Damage to Surrounding Healthy Tissues
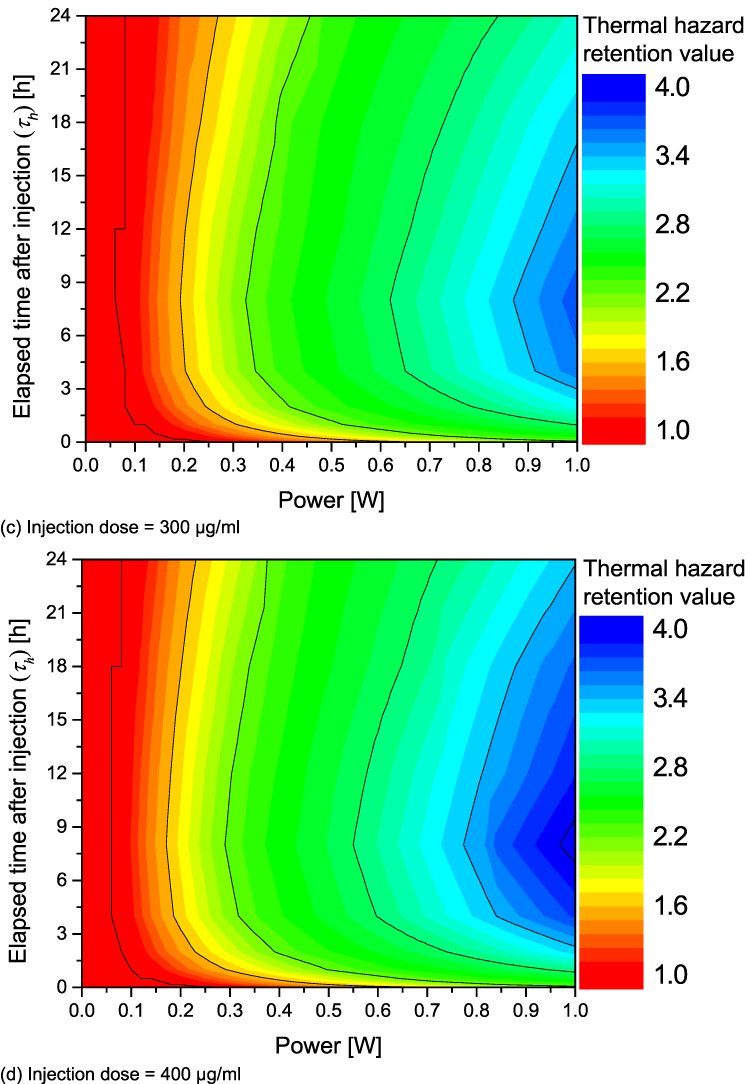
When performing PTT, the temperature of the tumor to be killed is increased, and heat transfer to the surrounding healthy tissue inevitably occurs. Unnecessary temperature increases in surrounding healthy tissue leads to thermal damage, which should be quantitatively analyzed. In this study, the thermal hazard retention value (θ*H) was utilized to quantitatively determine the amount of thermal damage to healthy tissue around the SCC.23 θ*H is defined by calculating a weighted sum for the healthy tissue surrounding the tumor after weighting each of the various biological phenomena expressed by temperature. The minimum value is 1, indicating no thermal damage, and the value of θ*H will increase as thermal damage occurs. This allows for quantitative determination of the amount of thermal damage to the healthy tissue surrounding the SCC.
Figure 7 shows θ*H as a function of Pl and τh for each change in injection dose. Based on the same Pl, it is observed that θ*H increases as injection dose increases. This is because the light absorption coefficient of the SCC increases as the dose of GNRs increases, concomitantly increasing the heat transfer from the SCC to the surrounding healthy tissue. Additionally, from the perspective of τh, it was confirmed that θ*H increased based on the same Pl until τh was 4 h, and decreased after 4 h. Prior to τh = 4 h, the diffusion of GNRs is limited, causing them to be concentrated relatively small area within the SCC. This concentration results in a very high light absorption coefficient, which, in turn, leads to an excessive temperature rise and heightened heat transfer to the adjacent healthy tissue. This is confirmed to be the case up to 4 h after injection. As τh exceeds 4 h, GNRs disperse across a relatively large area, leading to a reduction in GNR concentration. Consequently, the light absorption coefficient increases, resulting in a corresponding reduction in the amount of heat transferred to the surrounding healthy tissue.
Figure 7 Continued. Figure 7 Thermal hazard retention value (θ*H) for various Pl and τh. (a) Injection dose = 100 μg/mL; (b) Injection dose = 200 μg/mL; (c) Injection dose = 300 μg/mL; (d) Injection dose = 400 μg/mL.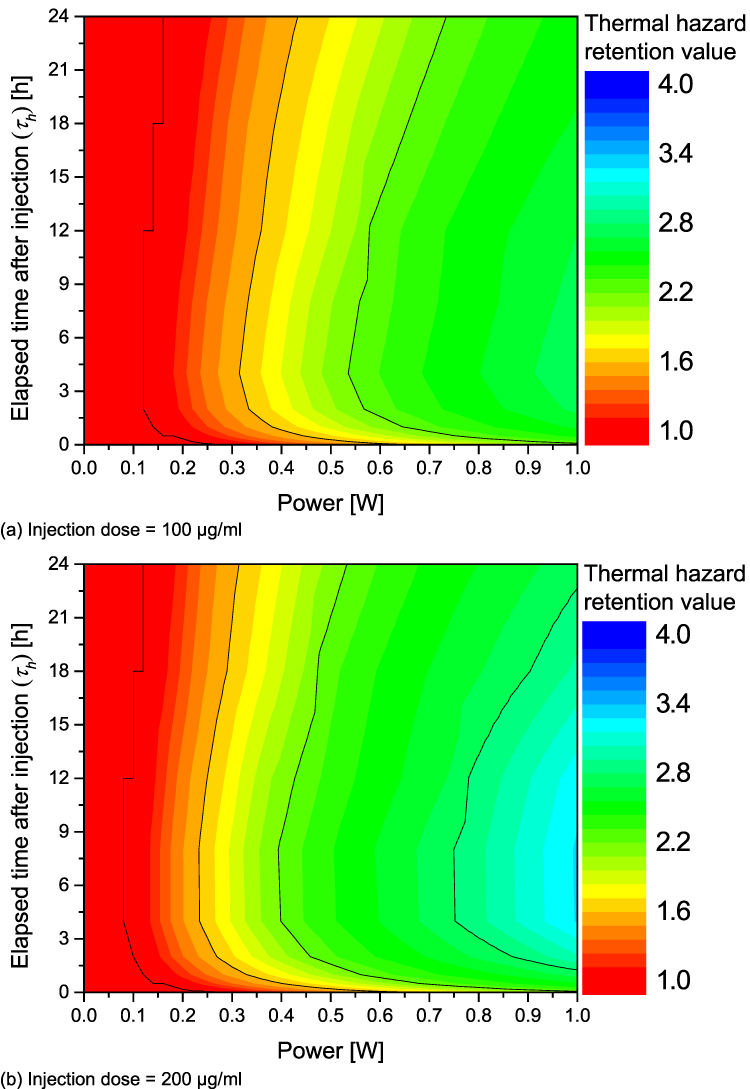
Confirmation of Quantitative PTT Effect
Finally, as PTT is performed, the expression of apoptosis in the tumor tissue and the thermal damage to the surrounding healthy tissue occur simultaneously. Therefore, this study analyzes these two phenomena simultaneously to gauge the effectiveness of PTT. For a quantitative analysis, the effective apoptosis retention ratio (θ*eff) was utilized.23 θ*eff is defined as the ratio of θ*A and θ*H, with a minimum value of 0 and a maximum of 1 (θ*A=1, θ*H=1). By deriving θ*eff in each case, conditions were identified that maximized the occurrence of apoptosis within the SCC while minimizing the amount of thermal damage to surrounding healthy tissue.
Figure 8 plots θ*eff as a function of Pl and τh at each injection dose. In all cases, the trend of θ*eff followed a similar trajectory to θ*A, with θ*eff consistently registering at a lower value than θ*A. This occurs because some degree of thermal damage to the surrounding healthy tissue is unavoidable during treatment. Furthermore, as shown in Figure 6, as τh increases after 1 h, the maximum value of θ*A that can be obtained at that time increases, but for θ*eff, there exists a τh that shows an optimal value. This is because the more the apoptotic temperature range within the SCC is maintained, the more heat is transferred to the surrounding healthy tissue, which increases the thermal damage. This is further illustrated in Figure 9, which plots the maximum value of τh versus the injection dose of GNRs.
Figure 8 Continued. Figure 8 Effective apoptosis retention ratio (θ*eff) for various Pl and τh. (a) Injection dose = 100 μg/mL; (b) Injection dose = 200 μg/mL; (c) Injection dose = 300 μg/mL; (d) Injection dose = 400 μg/mL.

 |
Figure 9 Optimal value of θ*eff and Pl for various injection dose. (a) Maximum effective apoptosis retention ratio; (b) Optimal power. |
(Figure 9a) shows the optimal value of θ*eff as a function of injection dose of GNRs and τh. Conversely, depending on injection dose and τh, there is a corresponding Pl value for the optimal θ*eff value, which is shown in (Figure 9b). As mentioned earlier, there exists a τh for which θ*eff is optimal for each injection dose. For doses ranging from 100 to 300 μg/mL, θ*eff was optimized at 12 hours post-injection, and for a dose of 400 μg/mL, θ*eff was optimized at 18 h post-injection. Moreover, as the injection dose increases, Pl at the optimum point decreases. The optimal τh and Pl for each injection dose and the corresponding θ*eff are summarized in Table 3. From this, information was derived about the time elapsed after GNRs were injected into the SCC and the laser intensity at which the optimal therapeutic effect was achieved for each injection dose. Therefore, if the treatment is performed by appropriately controlling the degree of apoptosis in the SCC and the amount of thermal damage to the surrounding healthy tissue, it is possible to maximize the occurrence of apoptosis in the SCC while minimizing the thermal damage to the surrounding healthy tissue.
 |
Table 3 Optimal Conditions for Various Injection Dose |
Conclusion
In this study, the effects of different doses of PTA injected into the SCC and their diffusion behavior on PTT were investigated through numerical analysis. It was assumed that SCC developed from the surface of the skin and four layers of skin were implemented in the numerical modeling. The treatment parameters were the injection dose of PTA, the time elapsed after injection, and the intensity of the laser irradiation.
The PTA used was GNRs. The diffusion behavior of GNRs in biological tissue was calculated using the convection-diffusion equation, and the temperature distribution was calculated using the Pennes bioheat transfer equation. This facilitates calculation of the temperature distribution in the medium when PTT is performed at each elapsed time after injection. The laser irradiation utilized a wavelength of 1064 nm, and the irradiation time was fixed at 200 s. In addition, by utilizing an apoptotic variable that offers a quantitative assessment of the effect of PTT based on the calculated temperature distribution, the effectiveness of PTT was conclusively confirmed in all cases.
In assessing the effectiveness of PTT in all scenarios, it was found that the optimal therapeutic outcome occurred when the dosage was between 100 and 300 μg/mL, with the peak effect achieved after 12 hours post-injection. Conversely, when the dosage was 400 μg/mL, the optimal therapeutic effect was achieved after 18 hours post-injection. Furthermore, the optimal laser power at each injection dose was found to be 0.22, 0.14, 0.12, and 0.12 W, respectively. In conclusion, the results provide insights into the optimal conditions for achieving the most effective PTT outcomes for treating SCC with GNRs. The results of this study can be used to accelerate the commercialization of PTT. However, as the results were derived through numerical analysis, further validation through experiments, such as in vivo studies, is necessary. Due to the concentration distribution that changes over time after the injection of GNRs, the temperature distribution within the tissue changes even if the same laser intensity is irradiated to the tumor tissue. This also changes the degree of maintenance of the temperature range where apoptosis occurs. The expression of apoptosis can be checked with an apoptosis detection maker, etc., by biopsy, and it is thought that it will be possible to verify through in vivo experiments the conditions under which only tumor tissue can be killed without affecting the surrounding tissue. Ultimately, it is believed that this can become a reliable standard for performing actual treatment.
Nomenclature
C Species concentration (mol/m3)
cp Specific heat (J/kgK)
D Diffusion coefficient (m2/s)
fv Volume fraction of AuNPs
g Anisotropy factor
KB Boltzmann constant (J/K)
km Thermal conductivity (W/mK)
Pl Intensity of laser (W)
q Volumetric heat source (W/m3)
Q Dimensionless efficiency factor
R Source or sinks of quantity C (mol/m3)
r Radius (m)
t Thickness (m)
T Temperature (K)
u Velocity (m/s)
Greek Symbols
ղ Dynamic viscosity (Pa∙s)
θ*A Apoptosis retention ratio
θ*eff Effective apoptosis retention ratio
θ*H Thermal hazard retention value
µ Optical coefficient (1/m)
µ’ Reduced optical coefficient (1/m)
ρ Density (kg/m3)
τ Time (s)
τh Elapsed time after injection (h)
ωb Blood perfusion rate (1/s)
Subscripts
abs Absorption
b Blood
eff Effective
l Laser
m Medium
met Metabolic
np Nano particle
sca Scattering
tot Attenuation
x,y,z Notation of direction.
Data Sharing Statement
All data generated or analyzed during this study are included in this published article.
Author Contributions
All authors made a significant contribution to the work reported, whether that is in the conception, study design, execution, acquisition of data, analysis and interpretation, or in all these areas; took part in drafting, revising or critically reviewing the article; gave final approval of the version to be published; have agreed on the journal to which the article has been submitted; and agree to be accountable for all aspects of the work.
Funding
This work was supported by the National Research Foundation of Korea (NRF) grant funded by the Korean government (NSIT) (No. NRF-2022R1A2C2012470).
Disclosure
The authors declare that they have no competing interests in this work.
References
1. Overchuk M, Weersink RA, Wilson BC, et al. Photodynamic and photothermal therapies: synergy opportunities for nanomedicine. ACS nano. 2023;17(9):7979–8003. doi:10.1021/acsnano.3c00891
2. Zhang Y, Xu Z, Yuan Y, et al. Flexible antiswelling photothermal-therapy mxene hydrogel-based epidermal sensor for intelligent human–machine interfacing. Adv Funct Mater. 2023;33(21):2300299. doi:10.1002/adfm.202300299
3. Yin B, WKH H, Xia X, et al. A multilayered mesoporous gold nanoarchitecture for ultraeffective near-infrared light-controlled chemo/photothermal therapy for cancer guided by SERS imaging. Small. 2023;19(6):2206762. doi:10.1002/smll.202206762
4. Qi K, Sun B, Liu S, et al. Research progress on carbon materials in tumor photothermal therapy. Biomed Pharmacother. 2023;165:115070. doi:10.1016/j.biopha.2023.115070
5. Almond DP, Patel P. Photothermal Science and Techniques. Springer Science & Business Media; 1996.
6. D’arcy MS. Cell death: a review of the major forms of apoptosis, necrosis and autophagy. Cell Biol Int. 2019;43(6):582–592. doi:10.1002/cbin.11137
7. Ni Z, Zhang D, Zhen S, et al. NIR light-driven pure organic Janus-like nanoparticles for thermophoresis-enhanced photothermal therapy. Biomaterials. 2023;301:122261. doi:10.1016/j.biomaterials.2023.122261
8. Tang SJ, Li QF, Wang MF, et al. Bleeding the excited state energy to the utmost: single-molecule iridium complexes for in vivo dual photodynamic and photothermal therapy by an infrared low-power laser. Adv Healthc Mater. 2023;12(28):2301227. doi:10.1002/adhm.202301227
9. Fu M, Yang Y, Zhang Z, et al. Biosynthesis of melanin nanoparticles for photoacoustic imaging guided photothermal therapy. Small. 2023;19(14):2205343. doi:10.1002/smll.202205343
10. Li D, Deng X, Xu Z, et al. Molecular engineering of NIR-II AIE Luminogen excited at 1700 nm for ultradeep intravital brain two-photon fluorescence imaging. Adv Funct Mater. 2023;33(46):2303967. doi:10.1002/adfm.202303967
11. Choi J, Kim SY. Multi-shell structured nanocarriers with enhanced multiphoton upconversion luminescence efficiency for NIR-mediated targeted photodynamic therapy. Appl Mater Today. 2023;31:101755 doi:10.1016/j.apmt.2023.1017555.
12. Liu T, Zhu M, Chang X, et al. Tumor-specific photothermal-therapy-assisted immunomodulation via multiresponsive adjuvant nanoparticles. Adv Mater. 2023;35(18):2300086. doi:10.1002/adma.202300086
13. Liu S, Pan X, Liu H. Two-dimensional nanomaterials for photothermal therapy. Angew Chem. 2020;132(15):5943–5953. doi:10.1002/ange.201911477
14. Farzin L, Saber R, Sadjadi S, et al. Nanomaterials-based hyperthermia: a literature review from concept to applications in chemistry and biomedicine. J Therm Biol. 2022;104:103201 doi:10.1016/j.jtherbio.2022.103201.
15. Hutter E, Fendler JH. Exploitation of localized surface plasmon resonance. Adv Mater. 2004;16(19):1685–1706. doi:10.1002/adma.200400271
16. Rai M, Ingle AP, Birla S, et al. Strategic role of selected noble metal nanoparticles in medicine. Crit Rev Microbiol. 2016;42(5):696–719. doi:10.3109/1040841X.2015.1018131
17. Zhen X, Pu K, Jiang X. Photoacoustic imaging and photothermal therapy of semiconducting polymer nanoparticles: signal amplification and second near-infrared construction. Small. 2021;17(6):2004723. doi:10.1002/smll.202004723
18. Hu H, Li D, Dai W, et al. A NIR-II aiegen-based supramolecular nanodot for peroxynitrite-potentiated mild-temperature photothermal therapy of hepatocellular carcinoma. Adv Funct Mater. 2023;33(19):2213134 doi:10.1002/adfm.202213134.
19. Cheng JKK, Ooi EH, Chiew YS, et al. Gold nanorods assisted photothermal therapy of bladder cancer in mice: a computational study on the effects of gold nanorods distribution at the centre, periphery, and surface of bladder cancer. Comput Methods Prog Biomed. 2023;230:107363. doi:10.1016/j.cmpb.2023.107363
20. Yin T, Yang T, Chen L, et al. Intelligent gold nanoparticles for malignant tumor treatment via spontaneous copper manipulation and on-demand photothermal therapy based on copper induced click chemistry. Acta Biomater. 2023;166:485–495. doi:10.1016/j.actbio.2023.04.036
21. Gheflati B, Naghavi N. Computational study of nanoparticle assisted hyperthermia in tumors embedded with large blood vessels. Int J Heat Mass Transf. 2020;151:119415 doi:10.1016/j.ijheatmasstransfer.2020.119415.
22. Kim D, Paik J, Kim H. Effect of gold nanoparticles distribution radius on photothermal therapy efficacy. Sci Rep. 2023;13(1):12135. doi:10.1038/s41598-023-39040-6
23. Kim D, Kim H. Induction of apoptotic temperature in photothermal therapy under various heating conditions in multi-layered skin structure. Int J Mol Sci. 2021;22(20):11091. doi:10.3390/ijms222011091
24. Stocker T. Introduction to Climate Modelling. Springer Science & Business Media; 2011.
25. Edward JT. Molecular volumes and the Stokes-Einstein equation. J Chem Educ. 1970;47(4):261. doi:10.1021/ed047p261
26. Soni S, Tyagi H Investigation of nanoparticle injection to a tissue through porous media.
27. Charny CK. Mathematical models of bioheat transfer. Adv Heat Transf. 1992;22:19–155 doi:10.1016/S0065-2717(08)70344-7.
28. Dombrovsky LA, Timchenko V, Jackson M, Yeoh GH. A combined transient thermal model for laser hyperthermia of tumors with embedded gold nanoshells. Int J Heat Mass Transf. 2011;54(25–26):5459–5469. doi:10.1016/j.ijheatmasstransfer.2011.07.045
29. Keim U, Katalinic A, Holleczek B, et al. Incidence, mortality and trends of cutaneous squamous cell carcinoma in Germany, the Netherlands, and Scotland. Eur J Cancer. 2023;183:60–68. doi:10.1016/j.ejca.2023.01.017
30. Zhang J, Yang Q, Wu J, et al. Trends in cutaneous squamous cell carcinoma on the lip incidence and mortality in the United States, 2000–2019. Front Oncol. 2023;13:1111907. doi:10.3389/fonc.2023.1111907
31. Çetingül MP, Herman C. Quantification of the thermal signature of a melanoma lesion. Int J Therm Sci. 2011;50(4):421–431. doi:10.1016/j.ijthermalsci.2010.10.019
32. Holmer C, Lehmann KS, Wanken J, et al. Optical properties of adenocarcinoma and squamous cell carcinoma of the gastroesophageal junction. J Biomed Opt. 2007;12(1):014025. doi:10.1117/1.2564793
33. Prasad B, Kim S, Cho W, Kim S, Kim JK. Effect of tumor properties on energy absorption, temperature mapping, and thermal dose in 13.56-MHz radiofrequency hyperthermia. J Therm Biol. 2018;74:281–289. doi:10.1016/j.jtherbio.2018.04.007
34. Salomatina E, Jiang B, Novak J, Yaroslavsky AN. Optical properties of normal and cancerous human skin in the visible and near-infrared spectral range. J Biomed Opt. 2006;11(6):064026. doi:10.1117/1.2398928
35. Paul A, Paul A. Thermomechanical analysis of a triple layered skin structure in presence of nanoparticle embedding multi-level blood vessels. Int J Heat Mass Transf. 2020;148:119076. doi:10.1016/j.ijheatmasstransfer.2019.119076
36. Kim D, Kim H. Numerical study on death of squamous cell carcinoma based on various shapes of gold nanoparticles using photothermal therapy. Sensors. 2022;22(4):1671. doi:10.3390/s22041671
37. Draine BT, Flatau PJ. Discrete-dipole approximation for periodic targets: theory and tests. Josa A. 2008;25(11):2693–2703. doi:10.1364/JOSAA.25.002693
38. Paul A, Narasimhan A, Kahlen FJ, Das SK. Temperature evolution in tissues embedded with large blood vessels during photo-thermal heating. J Therm Biol. 2014;41:77–87. doi:10.1016/j.jtherbio.2014.02.010
39. Kim M, Kim G, Kim D, et al. Numerical study on effective conditions for the induction of apoptotic temperatures for various tumor aspect ratios using a single continuous-wave laser in photothermal therapy using gold nanorods. Cancers. 2019;11(6):764. doi:10.3390/cancers11060764
 © 2024 The Author(s). This work is published and licensed by Dove Medical Press Limited. The full terms of this license are available at https://www.dovepress.com/terms.php and incorporate the Creative Commons Attribution - Non Commercial (unported, v3.0) License.
By accessing the work you hereby accept the Terms. Non-commercial uses of the work are permitted without any further permission from Dove Medical Press Limited, provided the work is properly attributed. For permission for commercial use of this work, please see paragraphs 4.2 and 5 of our Terms.
© 2024 The Author(s). This work is published and licensed by Dove Medical Press Limited. The full terms of this license are available at https://www.dovepress.com/terms.php and incorporate the Creative Commons Attribution - Non Commercial (unported, v3.0) License.
By accessing the work you hereby accept the Terms. Non-commercial uses of the work are permitted without any further permission from Dove Medical Press Limited, provided the work is properly attributed. For permission for commercial use of this work, please see paragraphs 4.2 and 5 of our Terms.