Back to Journals » Clinical Interventions in Aging » Volume 13
Frailty and nutritional status in older people: the Mini Nutritional Assessment as a screening tool for the identification of frail subjects
Authors Valentini A, Federici M, Cianfarani MA, Tarantino U ![]() , Bertoli A
, Bertoli A
Received 1 February 2018
Accepted for publication 23 March 2018
Published 13 July 2018 Volume 2018:13 Pages 1237—1244
DOI https://doi.org/10.2147/CIA.S164174
Checked for plagiarism Yes
Review by Single anonymous peer review
Peer reviewer comments 3
Editor who approved publication: Dr Richard Walker
Alessia Valentini,1 Massimo Federici,1 Maria Assunta Cianfarani,1 Umberto Tarantino,2 Aldo Bertoli1
1Department of Systems Medicine, University of Rome “Tor Vergata”, Rome, Italy; 2Department of Orthopaedics and Traumatology, University of Rome “Tor Vergata”, Rome, Italy
Introduction: Frailty is a condition characterized by reduced resistance to low-level stress events, resulting from the progressive decline of multiple physiological systems observed with aging. Many factors can contribute to the pathogenesis of frailty, and nutritional status appears to play a key role. The objective of the study was to investigate the relationship between nutritional status, evaluated using Mini Nutritional Assessment (MNA), and frailty among older people.
Patients and methods: An observational study was carried out at the University Hospital “Tor Vergata” in Rome among patients aged 65 years or older, with or without hip fracture. The study sample included 62 patients hospitalized for a hip fracture and 50 outpatients without fracture. All subjects underwent blood sampling for laboratory assays and received a multidimensional geriatric evaluation comprising Activity of Daily Living (ADL), Instrumental Activity of Daily Living (IADL), Mini–Mental State Examination (MMSE), Geriatric Depression Scale (GDS), and MNA. Comorbidity was assessed using the Cumulative Illness Rating Scale for Geriatrics (CIRS-G). Muscle strength was measured by handgrip dynamometry, and frailty score was calculated using the Survey of Health, Ageing and Retirement in Europe-Frailty Index (SHARE-FI).
Results: Approximately 38% of the study population was frail, with the prevalence of frailty being greater among hospitalized older patients. Among frail subjects, 65% were at risk of malnutrition (RMN) and 10% were malnourished. The prevalence and RMN progressively diminished in the pre-frail group and not frail group. Nutritional status was closely associated with the degree of frailty, and in a logistic regression, MNA was the best variable predicting both pre-frailty and frailty.
Discussion and conclusion: Malnutrition contributes to the development of frailty. MNA can generate vital information to help identify a substantial part of both frail and pre-frail patients at low cost and care.
Keywords: frailty, malnutrition, Mini Nutritional Assessment, older people
Corrigendum for this paper has been published
Introduction
Frailty is a condition characterized by reduced resistance to low-level stress events1 resulting from the progressive decline of multiple physiological systems observed with aging.1–3
According to the phenotypic model, frailty is a condition of increased vulnerability, distinguished by the presence of at least three of the following elements in the same individual: muscle strength reduction, unintentional weight loss, exhaustion, reduced walking speed and decreased physical activity.1
A number of tools have been developed to help identify frail subjects,4–6 but there is still a lack of consensus on both the definition of frailty and frailty assessment tools.7
The Survey of Health, Ageing and Retirement in Europe-Frailty Index (SHARE-FI) instrument, which is based on Fried’s criteria,1 helps to classify a subject as frail, pre-frail, or not frail and to quantify the vulnerability and risk of death of an individual across Europe.8
In Italy, the prevalence of frailty and pre-frailty in subjects aged 65 years or older living in communities is ~23% and 45.6%, respectively.9
There is a dearth of available data on the prevalence of frailty and pre-frailty in hospitalized patients: a 2014 study by Dorner et al10 showed that 54.1% of older patients admitted for acute disease in an internal medicine department were frail and 21.8% were pre-frail.
Several factors can contribute to the development of frailty,1 with nutritional status playing a key role.11 Malnutrition (MN) is characterized by a reduction in nutrient intake or nutrient absorption12 that can lead to sarcopenia and consequently to disability. Its prevalence is highly variable in the older population: some epidemiological studies show a prevalence of between 5% and 30% in older community residents and significantly higher prevalence in hospitalized older people (20%–60%).13
In this paper, we investigated the relationship between nutritional status and frailty in an elderly population including hospitalized older patients and community-dwelling older people (outpatient older subjects), aiming to evaluate the usefulness of Mini Nutritional Assessment (MNA) as a screening tool to predict frailty.
Patients and methods
Our data are derived from an observational study conducted at the “Tor Vergata” Polyclinic in Rome in patients aged 65 or older the main objectives of which were to evaluate the major indicators of frailty and to establish their relationship with changes in the endocrine system that occur with aging. The secondary objective of the study was to identify which indicators of frailty were most frequently present in a subgroup of patients with an acute stress such as hip fracture following low-energy trauma.
The study population comprised 112 elderly subjects, aged between 68 and 98 years, referred to “Tor Vergata” Polyclinic from March 2014 to March 2015. Of these subjects, 62 subjects were enrolled as patients hospitalized in the Orthopedic Department following hip fracture, representing a population with higher frailty prevalence, and 50 subjects were enrolled as outpatients evaluated at the Department of Internal Medicine (Clinical Program on Atherosclerosis).
All investigations were carried out according to the Declaration of Helsinki, as modified in 2000, and included a written consent from all participants. For patients with mild cognitive impairment, informed consent was obtained with the help of the caregiver. The ethics committee of the “Tor Vergata” Polyclinic approved the study protocol.
Inclusion criteria were age ≥65 years in both groups and current hip fracture in hospitalized patients. Exclusion criteria were the presence of a malignancy or a history of cancer and the presence of severe dementia. For each patient, medical history was collected, comorbidities were evaluated, sex and age were recorded, anthropometric parameters (weight, height) were measured and body mass index (BMI) was computed. All subjects participating in the study underwent clinical examination and blood sampling for laboratory assays.
Blood cell count was evaluated using routine laboratory tests (Sysmex XE-2100; Dasit, Milano, Italy), and concentrations of glucose, creatinine, albumin, total cholesterol, high-density lipoprotein (HDL) cholesterol, low-density lipoprotein (LDL) cholesterol, and triglycerides were measured using homogeneous chemiluminescence assay (Dimension VISTA 1500; Siemens, Milano, Italy).
Participating patients received a multidimensional geriatric evaluation comprising Activity of Daily Living (ADL)14 and Instrumental Activity of Daily Living (IADL),15 Mini–Mental State Examination (MMSE),16 Geriatric Depression Scale (GDS),17 and MNA.18 Reference values were 0–6 for ADL and 0–8 for IADL: all patients whose ADL score was greater than or equal to 5 and whose IADL score was greater than or equal to 6 were considered as independent. MMSE (reference values 0–30) was used to assess the presence of cognitive impairment: patients whose MMSE score was greater than or equal to 24 were classified as normal, while patients whose MMSE score was between 20 and 24 were identified as having mild cognitive impairment. GDS reference values were between 0 and 30: patients whose GDS score was higher than 11 were categorized as suffering from depression. According to Guigoz et al,18 an MNA score greater than or equal to 24 identified subjects with normal nutritional status, while patients whose MNA score was less than or equal to 17 were classified as malnourished; subjects with MNA scores between 17 and 23.5 were at risk of malnutrition (RMN).
Comorbidity was assessed using the Cumulative Illness Rating Scale for Geriatrics (CIRS-G).19
In patients able to collaborate, muscle strength was measured using type Jamar® digital hand-held dynamometer (Kern & Sohn, Balingen, Germany). Measurements were performed with the dominant hand. Men and women with a handgrip strength of <30 and, <20 kg, respectively, were identified as having sarcopenia.20
Frailty score and the degree of frailty were subsequently calculated using the SHARE-FI.8 According to the SHARE-FI results, patients were classified as frail if their score was >3 for men and >2.13 for women; pre-frail, if the score was between 1.21 and 3 for men and between 0.32 and 2.13 for women; not frail, if the score was <1.21 for men and <0.32 for women.
Ambulant patients enrolled in the study underwent dual-energy X-ray absorptiometry (DEXA) for evaluation of bone mineral density (BMD) of lumbar spine and femoral neck, T-score and Z-score of lumbar spine and femoral neck, and body composition. DEXA scans were performed and analyzed according to the manufacturer’s guidelines, using either DEXA Lunar (Lunar Corp., Madison, WI, USA) for subjects enrolled at the Orthopedic Department or DEXA Hologic (Hologic Inc., Waltham, MA, USA) for subjects enrolled at the Department of Medicine. BMD and T-score of femoral neck were obtained from the databases. For patients with body composition data available, Fat Free Mass Index (FFMI) was calculated as the ratio between lean mass (kg) and height squared (m2).
Statistical analysis
The Kolmogorov–Smirnov test was used to assess normal distribution variables. Student’s t-test and analysis of variance (ANOVA) test served to compare continuous variables, while the χ2 test and the Fisher’s exact test were deployed to compare proportions. Pearson’s linear regression was used to correlate continuous variables. Nonparametric correlations were evaluated using Spearman’s rank correlation, as indicated. One-way ANOVA and simple linear correlation assessed the relationship between continuous variables. The analysis of covariance (ANCOVA) was used to evaluate the influence of fracture on the relationship between nutritional status (through the MNA) and frailty (frailty score). Multinomial logistic regression was used to assess which independent variables affect frailty.
All data are presented as mean±standard deviation (SD). Values of p<0.05 were considered as significant. Statistical analysis was performed using StatView 5 (SAS Institute Inc., Cary, NC, USA) and SPSS version 21 (IBM Corporation, Armonk, NY, USA). Graphs were designed using GraphPad Prism 5 (GraphPad Software, Inc., La Jolla, CA, USA).
Results
Older outpatients did not differ from hospitalized older patients for age, BMI, and fat mass, but they had significantly greater values of FFMI, muscle mass, handgrip, T-score (Table 1), and albumin (Table 2) and they exhibited greater autonomy in basic and daily life activities (anamnestic based) and a significantly higher MNA score (Table 3).
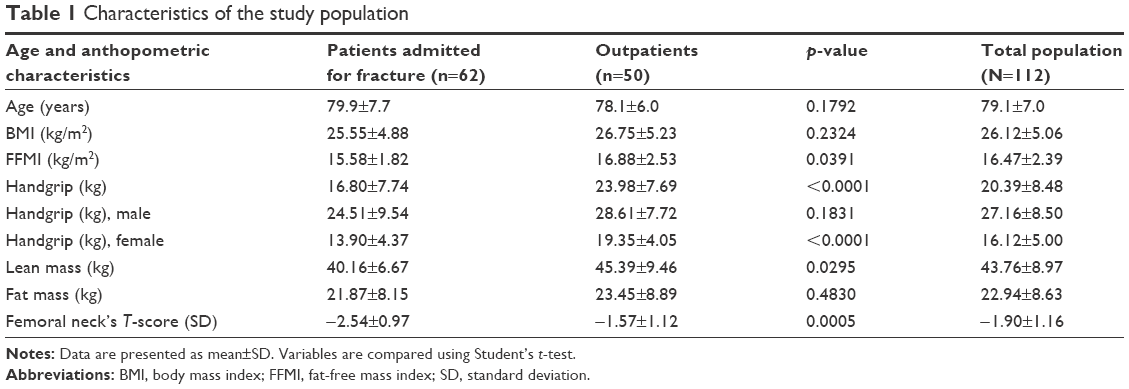 | Table 1 Characteristics of the study population |
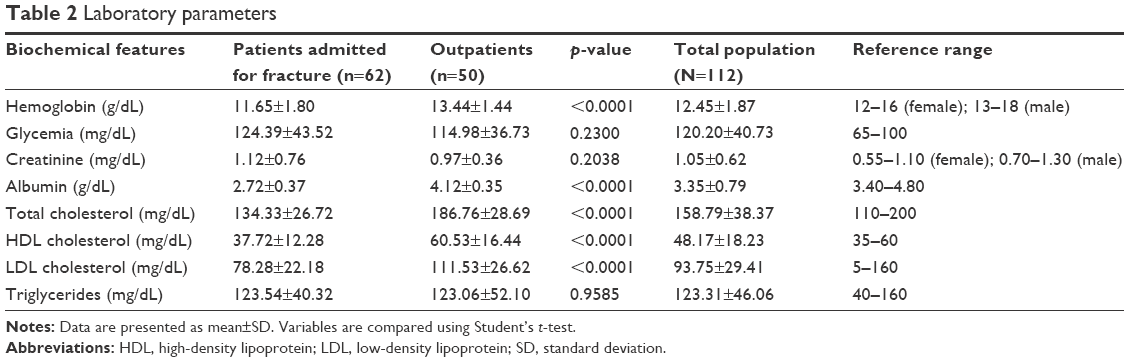 | Table 2 Laboratory parameters |
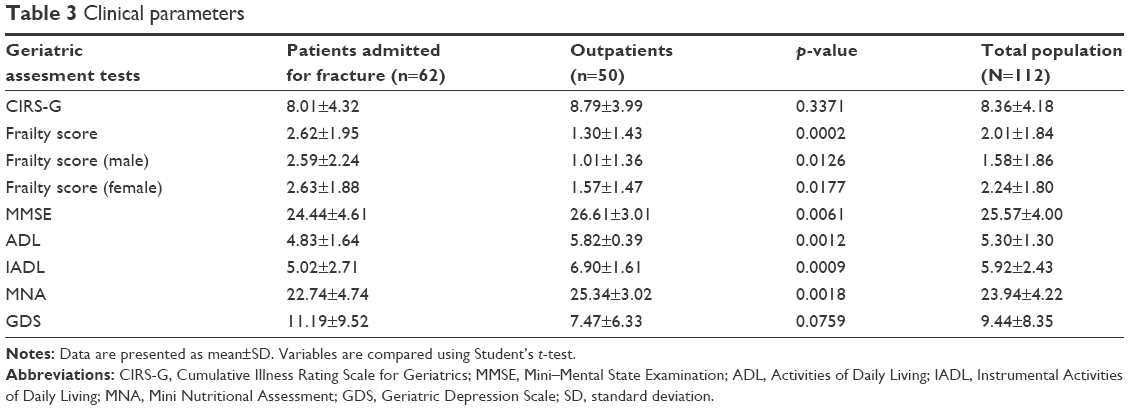 | Table 3 Clinical parameters |
Approximately 38% of the study population was frail and 28.3% was pre-frail. The prevalence of frailty was greater among hospitalized patients than among outpatients (59% vs 18.75%, respectively), while pre-frailty prevalence was greater among outpatient subjects than among hospitalized patients (37.5% vs 21.4%, respectively), as shown in Figure 1A (χ2=17.53, p<0.0001).
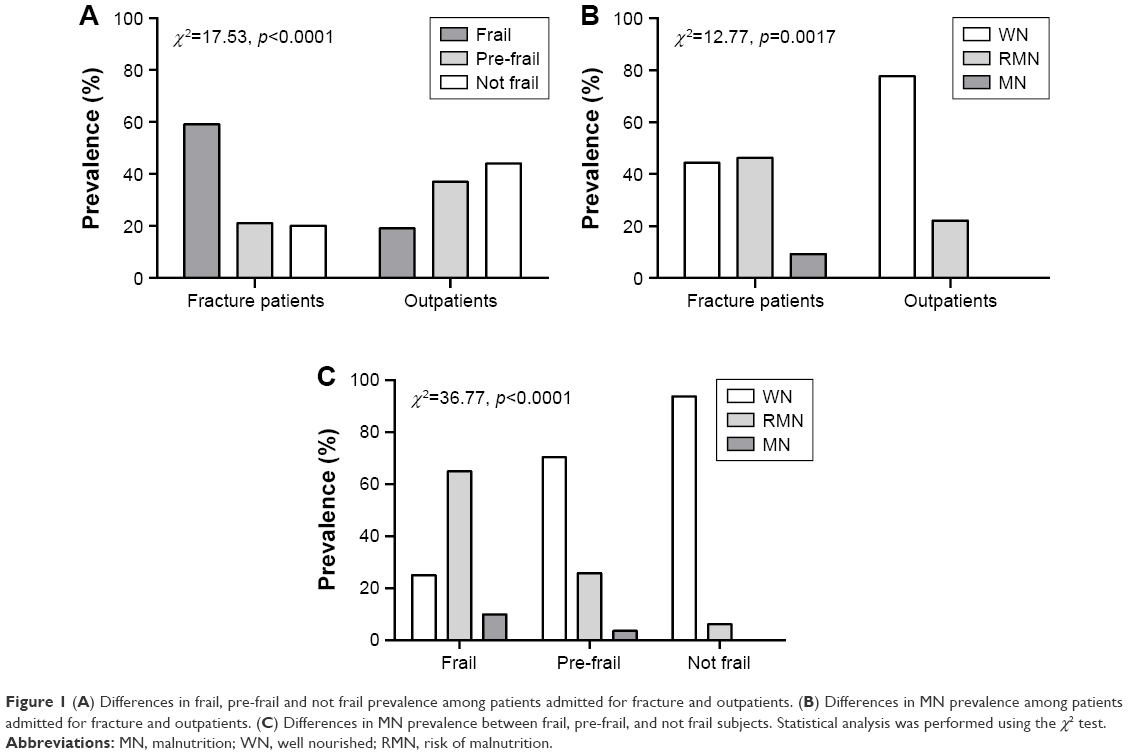 | Figure 1 (A) Differences in frail, pre-frail and not frail prevalence among patients admitted for fracture and outpatients. (B) Differences in MN prevalence among patients admitted for fracture and outpatients. (C) Differences in MN prevalence between frail, pre-frail, and not frail subjects. Statistical analysis was performed using the χ2 test. |
Moreover, 9.3% of hospitalized patients were malnourished, 46.3% were at risk for MN, and 44.4% had a nutritional status within the normal range. Among outpatient subjects, 77.8% had a normal nutritional status, 22.2% were at RMN, and none were malnourished (χ2=12.77, p=0.0017), as shown in Figure 1B. Among frail subjects, 65% were at RMN and 10% were malnourished. The prevalence of RMN progressively diminished in the pre-frail group (29.6%, of which 3.7% had poor nutritional status) and in the not frail group (6.2%, none of which had poor nutritional status). The difference between groups was statistically significant (χ2=36.77, p<0.0001; Figure 1C).
In the entire study population, the frailty score correlated with plasma hemoglobin concentrations (r=−0.4260, p<0.0001), total cholesterol (r=−0.2630, p=0.0082), and albumin (r=−0.3582, p=0.0002), and as reported in Table 4A, it correlated with cognitive dysfunction (MMSE), disability (ADL and IADL), nutritional status (MNA), femoral neck T-score, and comorbidity (CIRS-G), but not with lean mass.
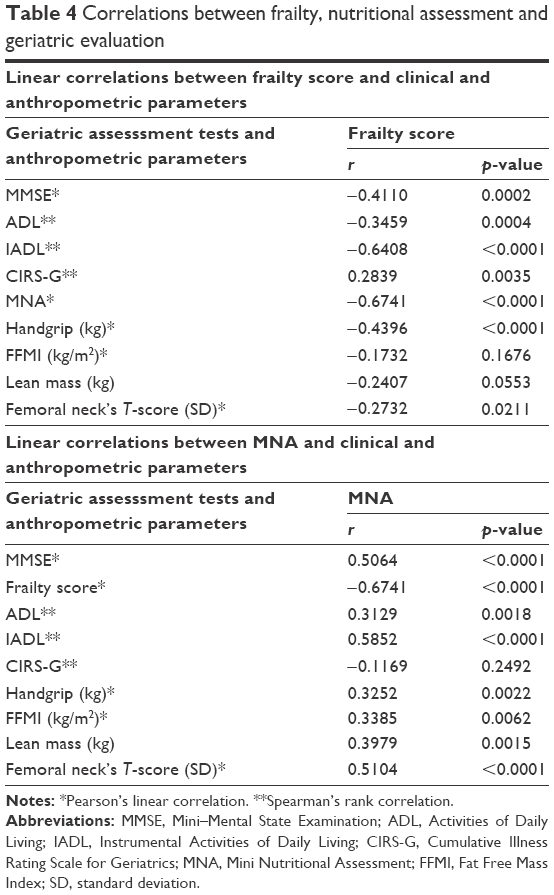 | Table 4 Correlations between frailty, nutritional assessment and geriatric evaluation |
Moreover, nutritional status, evaluated using MNA, was correlated with plasma hemoglobin concentrations (r=0.3861, p<0.0001) and albumin (r=0.2594, p=0.0092). As shown in Table 4B, MNA was also correlated with cognitive status (MMSE), degree of frailty (frailty score), disability (ADL and IADL), femoral T-score, lean mass, and muscle strength (handgrip) but not with comorbidities (CIRS-G).
An ANCOVA showed that, regardless of the presence of hip fracture (F=1.52, p=0.2211), nutritional status was significantly associated with the degree of frailty (F=63.39, p<0.0001), as shown in Figure 2.
 | Figure 2 Linear correlation between MNA and frailty score. |
In a linear regression model, taking into account the entire study population, nutritional status, identified as a dependent variable, was closely associated with the degree of frailty (F=21.77, p<0.0001), disability (F=5.80, p=0.0192), and femoral neck’s T-score (F=9.21, p=0.0036) but not with comorbidity, cognitive status, and fracture.
Our multinomial logistic regression model that included the degree of frailty as a dependent variable and CIRS-G, MMSE, ADL, GDS, MNA, and fracture presence as independent variables showed that the MNA was the best variable predicting both pre-frailty (χ2=6.22, p=0.0126) and frailty (χ2=17.43, p<0.0001).
Discussion and conclusion
Frailty is a condition of increased vulnerability, characterized by weakness, unintentional weight loss, slowness, exhaustion, and/or low activity, the prevalence of which increases with aging.1
In our study, 38% of participants were frail and 28.3% pre-frail, with a prevalence of frail subjects among hospitalized patients (59% vs 18.75%) and pre-frail subjects among outpatient older people (37.5% vs 21.4%).
Like frailty, MN is frequent in older patients across social strata,21 with an extremely variable but significantly greater prevalence among the hospitalized older subjects.13
In our study population, nutritional impairment, evaluated through both MNA and laboratory parameters, was more frequent in frail subjects than in pre-frail and not frail subjects. In the frail group, the prevalence of MN and RMN was significantly higher while plasma albumin concentrations were significantly lower than that observed in pre-frail and not frail subjects. Moreover, subjects who were malnourished or at RMN also presented with osteopenia and osteoporosis more frequently than well-nourished subjects (data not shown). Both conditions, frailty and MN, were more frequent among the hospitalized older patients than among the outpatient older subjects.
MN contributes to the development of frailty by accelerating the onset of sarcopenia and osteoporosis,22–24 conditions that increase the risk of fracture.25 In frail older subjects, hip fracture is a dramatic event that can lead to a rapid and sudden decline in residual functional autonomy, already limited by physiology and the inevitable aging process.
In our study, subjects hospitalized for hip fracture did not differ in terms of age, BMI, and comorbidity (CIRS-G) from community-dwelling older people. However, they differed in terms of degree of disability (ADL and IADL), evaluated on the basis of anamnestic data preceding hip fracture, and cognitive status (MMSE). They also had a more compromised pre-fracture nutritional status, as evidenced when evaluated through a questionnaire (MNA).
Plasma albumin concentration and total cholesterol, measured during in-hospital stays, were significantly lower in fracture patients, thereby confirming a compromised nutritional status. Furthermore, lipid profile can be modified by the use of cholesterol-lowering drugs (statins) and low hemoglobin levels are not only MN related.
Plasma albumin concentration is known to be a sensitive parameter for assessing nutritional status in clinically stable patients and, as per the study population, was found to be directly related to nutritional status determined by MNA.26 In addition, plasma albumin concentration was found to be closely related with muscular strength and degree of disability evaluated through ADL, in both community-based and hospitalized patients.26 In fact, in patients treated for hip fracture, plasma albumin concentration represents an important predictor of functional recovery.26
However, low serum albumin concentrations are not necessarily indicative of MN as hypoalbuminemia could reflect inflammation or disease state.21,26
As suggested by Dorner et al,10 there is a strong overlap between frailty and nutritional status.
In our study, regardless of the presence of an acute stress such as hip fracture, frailty and nutritional status were closely related to both hospitalized fracture subjects and community-dwelling older people. Furthermore, with frailty, the degree of bone mineralization was also closely related to nutrition: osteoporosis, in fact, is more frequent among malnourished subjects and, in a linear regression model, was strongly associated with nutritional status (data not shown).
While osteoporosis is the primary condition for fractures, it is not the only factor that reduces bone strength, nor does the reduction in bone strength alone increase the risk of fracture. Fracture in older people is often the result of low-energy trauma. A number of conditions, both medical and nonmedical, can play a predisposing role. Muscle mass and muscle strength, for example, are crucial to maintaining balance and avoiding falls and their consequences.27
The reduction in muscle mass and strength are the most important features of sarcopenia and, in more severe forms, is also associated with a reduction in physical performance.28 In our study, frail subjects showed lower values of both muscle mass and muscle strength than pre-frail and not frail subjects. Similarly, malnourished subjects had lower median values of both muscle mass and muscle strength than subjects at RMN and those with normal nutritional status. Such observations could indicate a greater prevalence of sarcopenia in frail and malnourished subjects, potentially placing them at greater risk of falls, fractures, and disabilities.
As with nutritional status, there is a strong overlap between sarcopenia and frailty.28 In our study, the frailty score was closely associated with muscle gain, while correlation with muscle mass was not statistically significant, probably due to the small size of the sample.
Osteoporosis and sarcopenia are closely linked because they are related to and/or are dependent on nutritional status and physical activity.22,29,30 Reduced protein intake and consequent MN contribute to both bone mass loss31,32 and weight loss and therefore to lean mass loss22 and are thus predictive factors for osteoporosis, sarcopenia, and frailty.31
Like He et al,29 we also found a significant correlation between the femoral neck’s T-score and muscle strength, between femoral neck’s T-score and lean mass, and between the femoral neck’s T-score and the frailty score among our limited number of patients with DEXA data available. Additionally, we found that the femoral neck’s T-score is strongly correlated with nutritional status as evaluated with MNA, which also depends on muscle mass. As expected, MNA and handgrip values are strongly correlated with each other.
MN can exacerbate the loss of muscle mass and bone mass observed with aging32 and therefore contributes to the development of frailty. In our study, MNA was the best predictor of both pre-frailty and frailty, and frailty score was the only predictor of the RMN and poor nutritional status. Nutritional status and frailty alike are independent of cognitive status and comorbidity. Cognitive decline, disability, and comorbidity may coexist in elderly subjects, but they are not synonymous with frailty, as per Fried et al.33
According to many published data, MNA is a useful tool for the assessment of nutritional status in both community-dwelling older people and hospitalized older patients. MNA seems to be a good method to assess nutritional status because unlike plasma albumin levels, it is independent from inflammation and acute diseases.34
Our study, notwithstanding the limitations of small sample size, found that the MNA can generate vital information to help identify a substantial part of both frail and pre-frail patients at low cost and care. Furthermore, it can inform a care path for preventing the progression of pre-frailty to frailty, thereby reducing potential adverse events associated with frailty.
Several tools have been proposed to help identify frail subjects,4–6 including SHARE-FI.8
Even though the introduction of SHARE-FI was intended to facilitate the rapid assessment of frailty in primary care, as described by Romero-Ortuno et al,8 this instrument requires greater collaboration on the part of the patient than the MNA tool.
SHARE-FI takes into account exhaustion (referred to by the patient as little energy to do the things he/she wanted to do), loss of appetite (described as a reduction in the desire for food and/or eating), walking difficulties, low physical activity, and weakness.8 The evaluation of weakness is based on the measurement of handgrip strength, which requires the use of a dynamometer and patient collaboration; this can be very difficult to obtain in subjects with cognitive impairment or dementia.
Unlike SHARE-FI, the MNA tool is simpler and does not require patient collaboration because it is predominantly anamnestic based and several of its components can be resolved by the caregiver in subjects with cognitive impairment or dementia.
In conclusion, given that nutritional status is strongly associated with frailty, the use of MNA as a screening tool can help identify at low cost and care a substantial part of frail and especially pre-frail patients alike. In both cases, early intervention can be instrumental in preventing the progression of frailty and reducing its adverse effects.
Study limitation
A limitation of this study is the small sample size that may not be representative of frail older people.
Acknowledgment
This study was financially supported by Fondazione Roma NCD CALL and PRIN 2015MPESJS-004.
Disclosure
The authors have no conflicts of interest in this work.
References
Fried LP, Tangen CN, Walston J, et al; Cardiovascular Health Study Collaborative Research Group. Frailty in older adults: evidence for a phenotype. J Gerontol A Biol Sci Med Sci. 2001;56(3):M146–M156. | ||
McMillan GJ, Hubbard RE. Frailty in older in-patients: what physicians need to know. Q J Med. 2012;105(11):1059–1065. | ||
Clegg A, Young J, Iliffe S, Rikkert MO, Rockwood K. Frailty in elderly people. Lancet. 2013;381(9868):752–762. | ||
Theou O, Brothers TD, Pena FG, Mitnitski A, Rockwood K. Identifying common characteristics of frailty across seven scales. J Am Geriatr Soc. 2014;62(5):901–906. | ||
Theou O, Brothers TD, Mitnitski A, Rockwood K. Operationalization of frailty using eight commonly used scales and comparison of their ability to predict all-cause mortality. J Am Geriatr Soc. 2013;61(9):1537–1551. | ||
Rockwood K, McMillan M, Mitnitski A, Howlett SE. A frailty index based on common laboratory tests in comparison with a clinical frailty index for older adults in Long Term Care Facilities. J Am Med Dir Assoc. 2015;16(10):842–847. | ||
Abellan van Kan G, Rolland Y, Bergman H, Morley JE, Kritchevsky SB, Vellas B. The I.A.N.A Task Force on frailty assessment of older people in clinical practice. J Nutr Health Aging. 2008;12(1):29–37. | ||
Romero-Ortuno R, Walsh CD, Lawlor BA, Kenny RA. A frailty instrument for primary care: findings from the survey of health, ageing and retirement in Europe (SHARE). BMC Geriatr. 2010;10:57. | ||
Santos-Eggimann B, Cuenoud P, Spagnoli J, Junod J. Prevalence of frailty in middle-aged and older community dwelling Europeans living in 10 countries. J Gerontol A Biol Sci Med Sci. 2009;64(6):675–681. | ||
Dorner TE, Luger E, Tschinderle J, et al. Association between nutritional status (MNA-SF) and frailty (SHARE-FI) in acute hospitalised elderly patients. J Nutr Health Aging. 2014;18(3):264–269. | ||
Bartali B, Frongillo EA, Bandinelli S, et al. Low nutrient intake is an essential component of frailty in older persons. J Gerontol A Biol Sci Med Sci. 2006;61(6):589–593. | ||
Cederholm T, Bosaeus I, Barazzoni R, et al. Diagnostic criteria for malnutrition – an ESPEN consensus statement. Clin Nutr. 2015;34(3):335–340. | ||
Guyonnet S, Rolland Y. Screening for malnutrition in older people. Clin Geriatr Med. 2015;31(3):429–437. | ||
Katz S, Ford AB, Moskowitz RW, Jackson BA, Jaffe MW. Studies of illness in the aged. The index of ADL: a standardized measure of biological and psychosocial function. JAMA. 1963;185:914–919. | ||
Lawton MP, Brody EM. Assessment of older people: self-maintaining and instrumental activities of daily living. Gerontologist. 1969;9(3):179–186. | ||
Folstein MF, Folstein SE, McHugh PR. “Mini-mental state”. A practical method for grading the cognitive state of patients for the clinician. J Psychiatr Res. 1975;12(3):189–198. | ||
Yesavage JA, Brink TL. Development and validation of a geriatric depression screening scale: a preliminary report. J Psychiatr Res. 1983;17(1):37–49. | ||
Guigoz Y, Vellas B, Garry PJ. Assessing the nutritional status of the elderly: the Mini Nutritional Assessment as part of geriatric evaluation. Nutr Rev. 1996;54(1):S59–S65. | ||
Parmelee PA, Thuras PD, Katz IR, Lawton MP. Validation of the Cumulative Illness Rating Scale in a geriatric residential population. J Am Geriatr Soc. 1995;43(2):130–137. | ||
Lauretani F, Russo CR, Bandinelli S, et al. Age-associated changes in skeletal muscles and their effect on mobility: an operational diagnosis of sarcopenia. J Appl Physiol (1985). 2003;95(5):1851–1860. | ||
Agarwal E, Miller M, Yaxley A, Isenring E. Malnutrition in the elderly: a narrative review. Maturitas. 2013;76(4):296–302. | ||
Bonnefoy M, Berrut G, Lesourd B, et al. Frailty and nutrition: searching for evidence. J Nutr Health Aging. 2015;19(3):250–257. | ||
Goisser S, Schrader E, Singler K, et al. Malnutrition according to mini nutritional assessment is associated with severe functional impairment in geriatric patients before and up to 6 months after hip fracture. J Am Med Dir Assoc. 2015;16(8):661–667. | ||
Salminen H, Saaf M, Johansson SE, Ringertz H, Strender LE. Nutritional status, as determined by the mini-nutritional assessment and osteoporosis: a cross sectional study of an elderly female population. Eur J Clin Nutr. 2006;60(4):486–493. | ||
Edwards MH, Dennoson EM, Aihie Sayer A, Fielding R, Cooper C. Osteoporosis and sarcopenia in older age. Bone. 2015;80:126–130. | ||
Cabrerizo S, Cuadras D, Gomez-Busto F, Artaza-Artabe I, Marin-Ciancas F, Malafarina V. Serum albumin and health in older people: review and meta-analysis. Maturitas. 2015;81(1):17–27. | ||
Ambrosea AF, Paula G, Hausdorffb JM. Risk factors for falls among older adults: a review of the literature. Maturitas. 2013;75(1):51–61. | ||
Cruz-Jentoft AJ, Baeyens JP, Bauer JM, et al; European Working Group on Sarcopenia in Older People. Sarcopenia: European consensus on definition and diagnosis: report of the European Working Group on sarcopenia in older people. Age Ageing. 2010;39(4):412–423. | ||
He H, Liu Y, Tian Q, Papasian CJ, Hu T, Deng HW. Relationship of sarcopenia and body composition with osteoporosis. Osteoporos Int. 2016;27(2):473–482. | ||
Di Monaco M, Vallero F, Di Monaco R, Tappero R. Prevalence of sarcopenia and its association with osteoporosis in 313 older women following a hip fracture. Arch Gerontol Geriatr. 2011;52(1):71–74. | ||
Rolland Y, Abellan van Kan G, Benetos A, et al. Frailty, osteoporosis and hip fractures: causes, consequences and therapeutic perspectives. J Nutr Health Aging. 2008;12(5):319–330. | ||
Coin A, Perissinotto E, Enzi G, et al. Predictors of low bone mineral density in the elderly: the role of dietary intake, nutritional status and sarcopenia. Eur J Clin Nutr. 2008;62(6):802–809. | ||
Fried LP, Ferrucci L, Darer J, Williamson JD, Anderson G. Untangling the concepts of disability, frailty, and comorbidity: implications for improved targeting and care. J Gerontol A Biol Sci Med Sci. 2004;59(3):255–263. | ||
Vellas B, Guigoz Y, Garry PJ, et al. The Mini Nutritional Assessment (MNA) and its use in grading the nutritional state of elderly patients. Nutrition. 1999;15(2):116–122. |
 © 2018 The Author(s). This work is published and licensed by Dove Medical Press Limited. The
full terms of this license are available at https://www.dovepress.com/terms
and incorporate the Creative Commons Attribution
- Non Commercial (unported, 3.0) License.
By accessing the work you hereby accept the Terms. Non-commercial uses of the work are permitted
without any further permission from Dove Medical Press Limited, provided the work is properly
attributed. For permission for commercial use of this work, please see paragraphs 4.2 and 5 of our Terms.
© 2018 The Author(s). This work is published and licensed by Dove Medical Press Limited. The
full terms of this license are available at https://www.dovepress.com/terms
and incorporate the Creative Commons Attribution
- Non Commercial (unported, 3.0) License.
By accessing the work you hereby accept the Terms. Non-commercial uses of the work are permitted
without any further permission from Dove Medical Press Limited, provided the work is properly
attributed. For permission for commercial use of this work, please see paragraphs 4.2 and 5 of our Terms.