Back to Journals » Clinical Ophthalmology » Volume 10
Evaluation of choroidal thickness changes after phacoemulsification surgery
Authors Bayhan SA, Bayhan HA, Muhafiz E ![]() , Kırboğa K, Gurdal C
, Kırboğa K, Gurdal C
Received 10 August 2015
Accepted for publication 2 April 2016
Published 26 May 2016 Volume 2016:10 Pages 961—967
DOI https://doi.org/10.2147/OPTH.S94096
Checked for plagiarism Yes
Review by Single anonymous peer review
Peer reviewer comments 4
Editor who approved publication: Dr Scott Fraser
Seray Aslan Bayhan, Hasan Ali Bayhan, Ersin Muhafiz, Kadir Kırboğa, Canan Gürdal
Department of Ophthalmology, Faculty of Medicine, Bozok University, Yozgat, Turkey
Purpose: The aim of the study was to analyze the effects of uneventful phacoemulsification surgery on choroidal thickness (CT) using spectral domain optical coherence tomography (SD-OCT).
Methods: In this prospective study, 38 eyes of 38 patients having phacoemulsification surgery were included. All patients underwent detailed ophthalmologic examination, including preoperative axial length (AXL) measurement with optical biometry and intraocular pressure (IOP) measurement preoperatively and 1 month postoperatively. The CT was measured perpendicularly at the fovea and 1.5 mm temporal, 3.0 mm temporal, 1.5 mm nasal, and 3.0 mm nasal using SD-OCT preoperatively and 1 month postoperatively. Changes in the CT after surgery and correlation of this change with age, AXL, preoperative IOP, and IOP change were evaluated.
Results: There was a statistically significant increase in the CT at all regions evaluated. This increment was more prominent in the nasal and subfoveal regions. The IOP decreased significantly 1 month after surgery (16.14±4.94 mmHg vs 13.91±4.86 mmHg; P<0.001). The change in IOP was correlated with the CT changes at all regions, whereas age, AXL, and preoperative IOP had no significant correlations with the changes in CT.
Conclusion: Phacoemulsification surgery may cause significant increase in CT, which is correlated with surgery-induced IOP change in the short term. Long-term follow-up of eyes having phacoemulsification surgery may provide further insight into the effects of cataract surgery on the choroid.
Keywords: phacoemulsification, choroidal thickness, optical coherence tomography
A Letter to the Editor has been received and published for this article.
Introduction
The choroid is a vessel-rich structure located between the lamina fusca of the sclera and the retinal pigment epithelium. It supplies blood to the outer retinal layers. Choroidal thickness (CT) is thought to indicate the amount of choroidal vascularization and varies by age, sex, axial length (AXL), refractive status, and circadian rhythm.1,2 The choroid is reported to play a role in many vision-threatening diseases such as choroidal neovascularization, polypoidal choroidal vasculopathy, central serous chorioretinopathy, and chorioretinal atrophy associated with high myopia.3–6 Thus, choroidal structural alterations are increasingly evaluated in scientific studies to understand the pathophysiology of these critical diseases.
Phacoemulsification surgery is the most frequently performed eye surgery, especially at advanced ages, and is generally associated with good visual outcomes. However, cataract surgery is known to have adverse effects on the retina, such as progression in diabetic retinopathy and pseudophakic cystoid macular edema, and the pathogenesis of such conditions is not yet clarified.7,8 Also, epidemiological studies show that cataract surgery is associated with the onset of age-related macular degeneration (AMD), although the association is still controversial.9 The development of AMD may be induced after cataract surgery due to reasons such as inflammatory reactions associated with cataract surgery, increased free radicals after surgery, the release of growth factors and prostaglandins, and increased light exposure during surgery.10–14 AMD is a serious disease, threatening vision due to neovascularizations arising from the choroid. The changes in the choroid after cataract surgery may induce the development of AMD.
An increment in the retinal thickness was reported after cataract surgery even in healthy eyes with no detected morphological impairment using spectral domain optical coherence tomography (SD-OCT).15 Given the close link between the retina and choroid, affected change in CT might also be expected after cataract surgery. Evaluation of choroid has been restricted to ultrasonography and angiography previously, while the choroid can be examined in detail with SD-OCT. SD-OCT provides detailed histological sectional images of the retina in vivo and provides useful information for the diagnosis, evaluation of the treatment options, and follow-up of several retinal diseases.16 The present study aims to examine the possible alterations in the CT after uncomplicated phacoemulsification surgery using SD-OCT and to investigate the potential mechanisms that may cause such changes.
Methods
This prospective study was conducted at the Department of Ophthalmology, Faculty of Medicine, Bozok University, Yozgat, Turkey. The study evaluated 38 eyes of 38 patients undergoing uncomplicated phacoemulsification surgery. The study was approved by the Bozok University Ethical Committee and was performed in accordance with the ethical principles described in the Declaration of Helsinki. All subjects enrolled in the study agreed to participate, met the inclusion criteria, and signed an informed consent agreement before any procedures were performed.
Patients with diabetes mellitus, hypertension, dyslipidemia, any known systemic diseases, uveitis, glaucoma, retinal vein/branch occlusion, or other vascular and inflammatory retinal diseases, and previous eye surgery were excluded from the study due to the effect on CT. Smoking was an exclusion criterion as well. Cataract hardness of the patients was evaluated and standardized based on the Lens Opacities Classification System (LOCS) III staging system,17 and patients with severe cataracts that might prevent a reliable SD-OCT measurement and poor fixation were excluded from the study.
All surgeries were performed by the same experienced surgeon (HAB). Phacoemulsification surgery was performed through a 2.8 mm clear corneal incision. An Infiniti Vision System (Alcon Inc., Fort Worth, TX, USA) was used in all surgeries, and same hydrophobic acrylic intraocular lens (Acriva UD 613; VSY Biotechnology, Istanbul, Turkey) was implanted in all cases. Effective phaco times (EPT) and duration of the operations were recorded. The patients were administered topical moxifloxacin for 1 week and topical prednisolone for 4 weeks after the surgery.
All patients underwent a detailed ophthalmologic examination including visual acuity measurement, anterior segment biomicroscopy, dilated fundus examination, and intraocular pressure (IOP) measurement (applanation tonometry) preoperatively and 1 month postoperatively. Furthermore, AXL measurement using optical biometry (Lenstar LS 900; Haag-Streit AG, Koeniz, Switzerland) was performed in all cases, preoperatively. SD-OCT measurements were obtained in the morning (between 9 am and 11 am) in order to avoid the effect of diurnal fluctuations. Changes in the CT after surgery and correlation of this change with age, AXL, EPT, preoperative IOP, and IOP change were evaluated.
Image acquisition and processing
Choroidal imaging was performed using RTvue-100 SD-OCT system (Optovue Inc, Fremont, CA, USA). The system uses a scanner diode laser of 840±10 nm. The depth resolution of the system is 5 μm in tissue.
For CT measurement, the patient’s head and chin were properly positioned, then the patient was asked to maintain fixation on the internal fixation light, and a reverse image was obtained from the retina. The image was automatically inverted so that the chorioretinal interface was adjacent to the zero delay.
The retina cross-line was used as the scanning pattern; this mode provides two orthogonally oriented 6 mm lines consisting of 1024 A-scans, perpendicular to each other. Sections passing through the fovea vertically and 1.5 and 3.0 mm nasal and temporal to the fovea were used for the measurements. The choroidal margins were taken as the distance between the outer margin of hyperreflective retinal pigment epithelium and the internal side of the sclera. Only images with a signal strength ≥45 were taken. CT measurements were performed manually by two different physicians (SAB and HAB), who were unaware of each other. These measurements were averaged; the difference between the measurements of the physicians was 10% of the average.
Statistical analysis
All data were analyzed using SPSS software (Version 16.0, SPSS Inc., Chicago, IL, USA). The χ2 test was used to make comparisons between the categorical data. The Shapiro–Wilk test was used to determine whether the data were distributed normally. Since the data were distributed normally, the paired-samples t-test was used for the comparison between preoperative and postoperative measurements. Potential parameters that might be associated with CT were evaluated using Pearson’s correlation analysis and regression analysis. Evaluations were made at a 95% confidence interval, and a P-value <0.05 was considered statistically significant.
Results
Thirty-eight eyes of 38 patients (20 women and 18 men) were included. The mean age of the patients was 63.80±10.78 years. There was only one patient with grade IV cataract hardness; the rest of the patients had grade II–III cataract hardness according to LOCS III (Table 1). All surgeries were performed using a 2.8-mm incision. The mean duration of the operation was 14.78±3.47 minutes, and the mean EPT was 6.37±3.47 seconds. There were no complications during any of the surgeries.
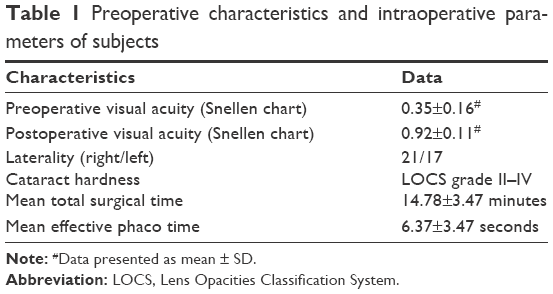 | Table 1 Preoperative characteristics and intraoperative parameters of subjects |
The mean subfoveal CT was 247.10±64.92 μm before surgery (Figure 1) and 267.84±74.1 μm at 1 month postoperative follow-up (P=0.002; Figure 2). A significant increase in the CT was observed in all regions (P<0.05 for all); such an increase was especially evident in the nasal and subfoveal regions. The IOP was significantly lower at the 1-month follow-up evaluation than preoperatively (16.14±4.94 mmHg vs 13.91±4.86 mmHg; P<0.001). When the potential factors affecting the change in the CT were analyzed, the change in the CT was correlated with a change in IOP for all sectors; no significant correlation was observed between CT changes and age, AXL, EPT, or preoperative IOP levels (Tables 2 and 3).
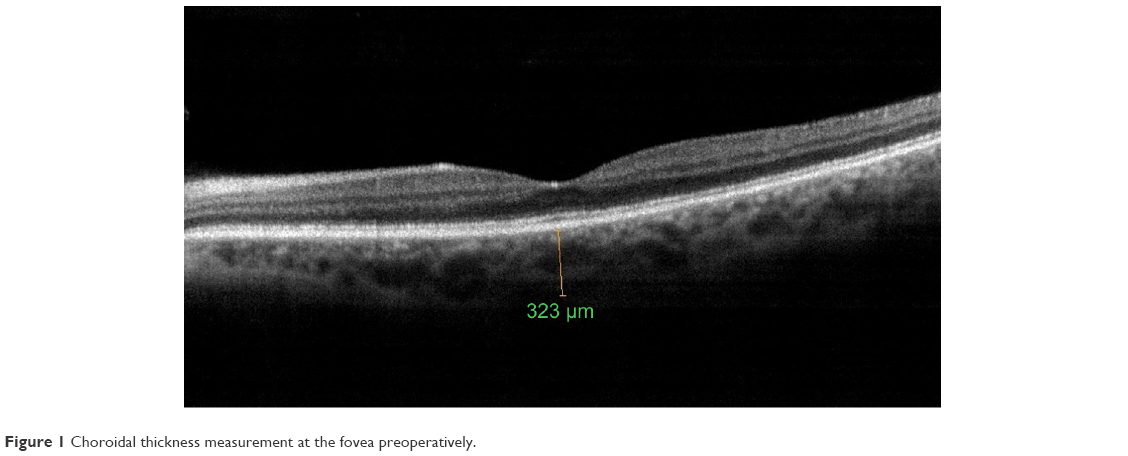 | Figure 1 Choroidal thickness measurement at the fovea preoperatively. |
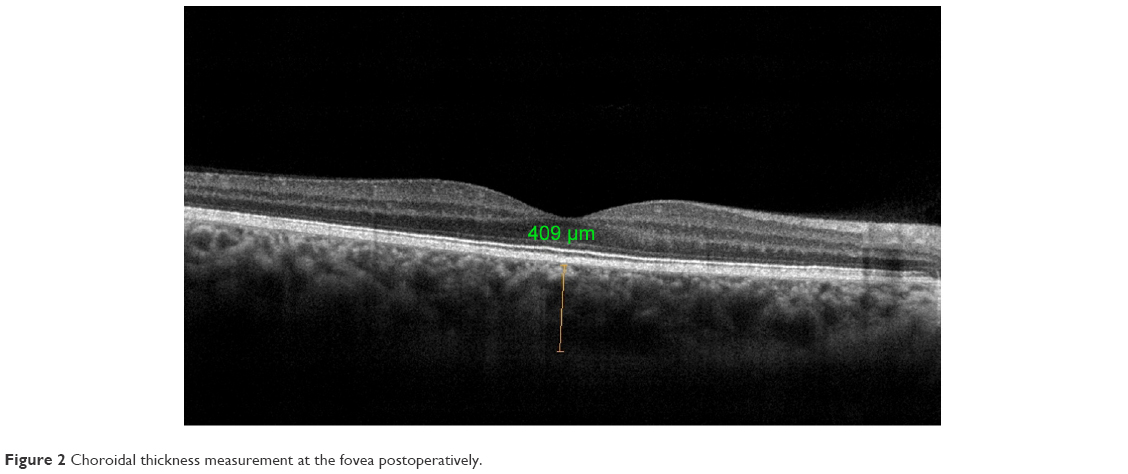 | Figure 2 Choroidal thickness measurement at the fovea postoperatively. |
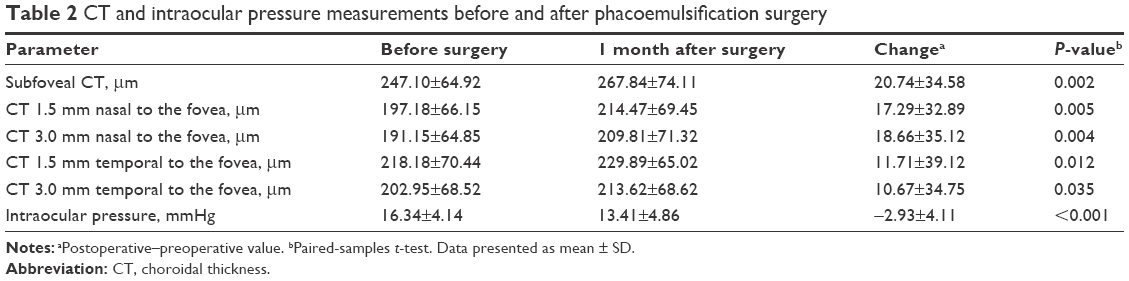 | Table 2 CT and intraocular pressure measurements before and after phacoemulsification surgery |
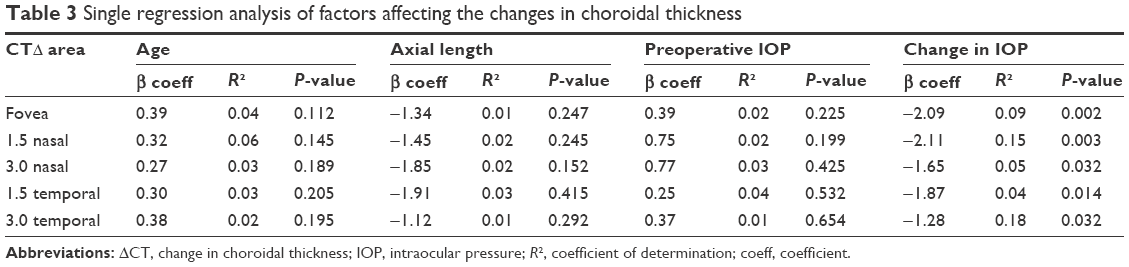 | Table 3 Single regression analysis of factors affecting the changes in choroidal thickness |
Discussion
It has been suggested that cataract surgery may be associated with the onset of AMD. The Beaver Dam and Blue Mountains groups reported an increased incidence of AMD with cataract surgery.18,19 In contrast, in the Age-Related Eye Disease Study, there was no significant increase in the incidence of AMD after cataract surgery.20 Although the fundoscopic appearance of the retina does not change with phacoemulsification in most eyes undergoing cataract surgery, subclinical changes in the macula and choroid have been reported after phacoemulsification surgery, as indicated by SD-OCT sectional imaging of the retina.21 The effects of such subclinical changes are not yet fully understood. SD-OCT imagery highlights the importance of CT changes in diseases of the choroid and retina, such as diabetic retinopathy, AMD, and central serous chorioretinopathy.5,6,22,23
Pierru et al24 examined the subfoveal CT after cataract surgery; they reported that the CT began to increase postoperatively on day 7 and reached its highest value 1 month postoperatively. The follow-up exam at 3 months showed a decrease in CT.24 Noda et al21 reported that subfoveal CT increased as indicated in the follow-up examination 1 month after surgery; however, subfoveal CT did not return to preoperative values as indicated in the 6-month follow-up examination. Another study evaluating the CT after cataract surgery found no significant changes in CT values 1 week and 1 month after surgery;25 however, the study was conducted with a limited number of participants (14 patients). In the present study, we observed that subfoveal CT increased significantly 1 month after cataract surgery. We believe that the increase in CT was associated with reduced IOP.
We administered anti-inflammatory (prednisolone) eye drops to our patients for 1 month following surgery. Anti-inflammatory therapies are known to reduce postoperative inflammation and suppress the inflammatory response in the retina.26 Anti-inflammatory therapies may also reduce the postoperative choroidal response. We administered postoperative anti-inflammatory therapy to all of our patients as part of our standard treatment protocol in this study to evaluate the actual postoperative choroidal response.
The mechanism through which cataract surgery increases inflammation in the retina and choroid has yet to be fully explained. It has been suggested that the CT may increase due to proinflammatory cytokines and prostaglandins that are believed to increase after cataract surgery.27,28 It is known that surgical trauma induces aqueous humor prostaglandin release and that these prostaglandins impair the blood–aqueous barrier. When the blood–aqueous barrier is impaired, other inflammatory mediators, such as endotoxin, cytokines, and immune complexes, accumulate in the aqueous humor. These inflammatory mediators pass through the vitreous to the retina, leading to an impaired inner and outer blood–retinal barrier.29 The inflammatory response in the anterior segment, which develops secondary to cataract surgery, may thereby also cause inflammatory cascades in the posterior segment. However, these mechanisms cannot explain why the increased choroidal blood supply continues for up to 6 months after cataract surgery.
Another mechanism suggested for inflammation induced by surgical trauma is increased gene expression that simultaneously induces inflammatory response in all structures of the eye. In a mouse model, extracapsular lens extraction was found to increase protein secretion in the retina and choroid through proinflammatory gene expression. An increase was observed in the expression of genes related to chemokines such as CCL-2 and SDF-1, which can impair the blood–retinal barrier in the retina, retinal pigment epithelium, and choroid in operated eyes, as well as growth factors such as fibroblast growth factors and vascular endothelial growth factors. The same study also established that IL-1β, a proinflammatory cytokine, increased in the ganglion cell layer, inner nuclear layer, and choroid in operated eyes.28 Another animal study involving monkeys showed that cataract surgery destroyed the outer blood–retinal barrier and increased macular thickness.29
It has been shown that even uncomplicated phacoemulsification has effects on retina, in general as temporary thickening of the central retina. This effect could be attributed to factors such as ultrasound power used during surgery or the intraoperative IOP fluctuations caused by surge or the intraoperative photostress due to microscope light.30 When we evaluated our data on the correlation between EPT and CT, we did not find any correlation. Though the cataract hardness of the patients in our study ranged from grade II to IV based on LOCS III, patients with severe cataracts that might prevent a reliable SD-OCT measurement were excluded, and there was only one patient with grade IV cataract hardness. Since the patients expecting high ultrasonic energy due to hard cataracts were excluded, our patient group was homogeneous in terms of cataract hardness, and this might prevent detection of any possible correlation between EPT and CT. On the other hand, Ching et al31 showed thicker preoperative retinal thickness than those in the early postoperative period, and the authors suggested that possible measurement errors in preoperative evaluation might be the reason of their results. So, all these factors might also have an influence on CT, and while interpreting our results, these factors should also be kept in mind.
IOP decreases after cataract surgery.32 To understand the reasons for IOP decrease after phacoemulsification, many factors should be taken into account. By removing the thick lens, blockage of aqueous outflow with lens is prevented, the angle of anterior chamber opens, aqueous outflow improves, and consequently IOP decreases. A study by Ohsugi et al33 with 100 patients reported a negative correlation between change in CT and change in IOP in the postoperative early period, supporting the present study; however, they did not establish any correlation between CT change and IOP for many regions in subsequent periods. Although their recent report showed a significant correlation between change in CT and change in IOP in the early postoperative period, we believe that this is worth confirming in a further study. Also, in our study, the same experienced surgeon performed all surgeries and the same intraocular lens was implanted in all cases, whereas in the study by Ohsugi et al,33 seven surgeons performed the surgeries and uniformity of intraocular lens was not mentioned, so these might have limited standardization of the surgical technique in their preliminary report.
The increase in CT may be due to increased ocular perfusion pressure caused by reduced IOP in the early period after cataract surgery. The driving force for ocular blood flow is the ocular perfusion pressure, defined as ocular arterial pressure minus IOP.34 Animal studies showed that induction of ocular hypertension resulted in decreased blood flow through the choroid, while retinal blood flow remained at normal levels, suggesting a marked difference in autoregulatory capacity between the choroidal and retinal vascular beds.35 It was also demonstrated that in vivo subfoveal CT as measured by enhanced depth imaging-OCT was significantly associated with ocular perfusion pressure, suggesting that subfoveal CT may be indirectly indicative of subfoveal ocular perfusion status.36 Since there is an inverse relation between IOP and ocular perfusion pressure, the increase in CT may be due to increased ocular perfusion pressure caused by reduced IOP in the early period after cataract surgery in our study. In the future, the IOP–CT relationship may be understood upon evaluation of changes in CT after glaucoma surgery, which greatly influences IOP.
In this study, we did not find any correlation between the AXL and age with CT; however, the included subjects were older patients within nearly the same age range, and the patients having myopic fundus were not included in the study. Thus, these might have limited our results on the correlation between the AXL and age with CT.
Conclusion
Cataract surgery causes an increase in CT, which is correlated with a change in IOP in the early stages. This is especially important for understanding the pathogenesis of diseases associated with choroidal changes, such as cystoid macular edema, which increase in prevalence following cataract surgery.
Disclosure
None of the authors have a financial or proprietary interest in any material or method mentioned, and there was no public or private support. The authors report no other conflicts of interest in this work.
References
Wei WB, Xu L, Jonas JB, et al. Subfoveal choroidal thickness: the Beijing Eye Study. Ophthalmology. 2013;120(1):175–180. | ||
Tan CS, Ouyang Y, Ruiz H, Sadda SR. Diurnal variation of choroidal thickness in normal, healthy subjects measured by spectral domain optical coherence tomography. Invest Ophthalmol Vis Sci. 2012;53(1):261–266. | ||
Grossniklaus HE, Green WR. Choroidal neovascularization. Am J Ophthalmol. 2004;137(3):496–503. | ||
Gomi F, Tano Y. Polypoidal choroidal vasculopathy and treatments. Curr Opin Ophthalmol. 2008;19(3):208–212. | ||
Iida T, Kishi S, Hagimura N, Shimizu K. Persistent and bilateral choroidal vascular abnormalities in central serous chorioretinopathy. Retina. 1999;19(6):508–512. | ||
Gupta P, Cheung CY, Saw SM, et al. Peripapillary choroidal thickness in young asians with high myopia. Invest Ophthalmol Vis Sci. 2015; 56(3):1475–1481. | ||
Chew EY, Benson WE, Remaley NA, et al. Results after lens extraction in patients with diabetic retinopathy: Early Treatment Diabetic Retinopathy Study report number 25. Arch Ophthalmol. 1999;117(12):1600–1606. | ||
Gass JD, Norton EW. Cystoid macular edema and papilledema following cataract extraction. A fluorescein fundoscopic and angiographic study. Arch Ophthalmol. 1966;76(5):646–661. | ||
Freeman EE, Munoz B, West SK, Tielsch JM, Schein OD. Is there an association between cataract surgery and age-related macular degeneration? Data from three population-based studies. Am J Ophthalmol. 2003;135(6):849–856. | ||
Van der Schaft TL, Mooy CM, de Bruijn WC, Mulder PG, Pameyer JH, de Jong PT. Increased prevalence of disciform macular degeneration after cataract extraction with implantation of an intraocular lens. Br J Ophthalmol. 1994;78(6):441–445. | ||
Anderson DH, Mullins RF, Hageman GS, Johnson LV. A role for local inflammation in the formation of drusen in the aging eye. Am J Ophthalmol. 2002;134(3):411–431. | ||
Pollack A, Marcovich A, Bukelman A, Oliver M. Age-related macular degeneration after extracapsular cataract extraction with intraocular lens implantation. Ophthalmology. 1996;103(10):1546–1554. | ||
Kim SJ, Flach AJ, Jampol LM. Nonsteroidal anti-inflammatory drugs in ophthalmology. Surv Ophthalmol. 2010;55(2):108–133. | ||
Libre PE. Intraoperative light toxicity: a possible explanation for the association between cataract surgery and age related macular degeneration [letter]. Am J Ophthalmol. 2003;136(5):961. | ||
Mylonas G, Sacu S, Deák G, et al. Macular edema following cataract surgery in eyes with previous 23-gauge vitrectomy and peeling of the internal limiting membrane. Am J Ophthalmol. 2013;155(2):253–259. | ||
Jaffe GJ, Caprioli J. Optical coherence tomography to detect and manage retinal disease and glaucoma. Am J Ophthalmol. 2004;137(1):156–169. | ||
Chylack LT Jr, Wolfe JK, Singer DM, et al. The Lens Opacities Classification System III. The Longitudinal Study of Cataract Study Group. Arch Ophthalmol. 1993;111(6):831–836. | ||
Klein BE, Howard KP, Lee KE, Iyengar SK, Sivakumaran TA, Klein R. The relationship of cataract and cataract extraction to age-related macular degeneration: the Beaver Dam Eye Study. Ophthalmology. 2012;119(8):1628–1633. | ||
Cugati S, Mitchell P, Rochtchina E, Tan AG, Smith W, Wang JJ. Cataract surgery and the 10-year incidence of age-related maculopathy: the Blue Mountains Eye Study. Ophthalmology. 2006;113(11):2020–2025. | ||
Chew EY, Sperduto RD, Milton RC, et al. Risk of advanced age-related macular degeneration after cataract surgery in the Age-Related Eye Disease Study: AREDS report 25. Ophthalmology. 2009;116:297–303. | ||
Noda Y, Ogawa A, Toyama T, Ueta T. Long-term increase in subfoveal choroidal thickness after surgery for senile cataracts. Am J Ophthalmol. 2014;158(3):455–459. | ||
Kim JT, Lee DH, Joe SG, Kim JG, Yoon YH. Changes in choroidal thickness in relation to the severity of retinopathy and macular edema in type 2 diabetic patients. Invest Ophthalmol Vis Sci. 2013;54(5):3378–3384. | ||
Manjunath V, Goren J, Fujimoto JG, Duker JS. Analysis of choroidal thickness in age-related macular degeneration using spectral-domain optical coherence tomography. Am J Ophthalmol. 2011;152(4):663–668. | ||
Pierru A, Carles M, Gastaud P, Baillif S. Measurement of subfoveal choroidal thickness after cataract surgery in enhanced depth imagingoptical coherence tomography. Invest Ophthalmol Vis Sci. 2014;55(8):4967–4974. | ||
Falcão MS, Gonçalves NM, Freitas-Costa P, et al. Choroidal and macular thickness changes induced by cataract surgery. Clin Ophthalmol. 2014;8:55–60. | ||
Henderson BA, Kim JY, Ament CS, Ferrufino-Ponce ZK, Grabowska A, Cremers SL. Clinical pseudophakic cystoid macular edema. Risk factors for development and duration after treatment. J Cataract Refract Surg. 2007;33(9):1550–1558. | ||
Jones J, Francis P. Ophthalmic utility of topical bromfenac, a twice-daily nonsteroidal anti-inflammatory agent. Expert Opin Pharmacother. 2009;10(14):2379–2385. | ||
Xu H, Chen M, Forrester JV, Lois N. Cataract surgery induces retinal pro-inflammatory gene expression and protein secretion. Invest Ophthalmol Vis Sci. 2011;52(1):249–255. | ||
Tso MO, Shih CY. Experimental macular edema after lens extraction. Invest Ophthalmol Vis Sci. 1977;16(5):381–392. | ||
Georgopoulos GT, Papaconstantinou D, Niskopoulou M, Moschos M, Georgalas I, Koutsandrea C. Foveal thickness after phacoemulsification as measured by optical coherence tomography. Clin Ophthalmol. 2008;2:817–820. | ||
Ching HY, Wong AC, Wong CC, Woo DC, Chan CW. Cystoid macular oedema and changes in retinal thickness after phacoemulsification with optical coherence tomography. Eye. 2006;20:297–303. | ||
Mansberger SL, Gordon MO, Jampel H, et al; Ocular Hypertension Treatment Study Group. Reduction in intraocular pressure after cataract extraction: the Ocular Hypertension Treatment Study. Ophthalmology. 2012;119(9):1826–1831. | ||
Ohsugi H, Ikuno Y, Ohara Z, et al. Changes in choroidal thickness after cataract surgery. J Cataract Refract Surg. 2014;40(2):184–191. | ||
Caprioli J, Coleman AL; Blood flow in glaucoma discussion. Blood pressure, perfusion pressure, and glaucoma. Am J Ophthalmol. 2010;149:704–712. | ||
Alm A, Bill A. The oxygen supply to the retina, II. Effects of high intraocular pressure and of increased arterial carbon dioxide tension on uveal and retinal blood flow in cats. A study with radioactively labelled microspheres including flow determinations in brain and some other tissues. Acta Physiol Scand. 1972;84:306 –319. | ||
Kim M, Kim SS, Kwon HJ, Koh HJ, Lee SC. Association between choroidal thickness and ocular perfusion pressure in young, healthy subjects: enhanced depth imaging optical tomography study. Invest Ophthalmol Vis Sci. 2012;53:7710–7717. |
 © 2016 The Author(s). This work is published and licensed by Dove Medical Press Limited. The
full terms of this license are available at https://www.dovepress.com/terms
and incorporate the Creative Commons Attribution
- Non Commercial (unported, 3.0) License.
By accessing the work you hereby accept the Terms. Non-commercial uses of the work are permitted
without any further permission from Dove Medical Press Limited, provided the work is properly
attributed. For permission for commercial use of this work, please see paragraphs 4.2 and 5 of our Terms.
© 2016 The Author(s). This work is published and licensed by Dove Medical Press Limited. The
full terms of this license are available at https://www.dovepress.com/terms
and incorporate the Creative Commons Attribution
- Non Commercial (unported, 3.0) License.
By accessing the work you hereby accept the Terms. Non-commercial uses of the work are permitted
without any further permission from Dove Medical Press Limited, provided the work is properly
attributed. For permission for commercial use of this work, please see paragraphs 4.2 and 5 of our Terms.