Back to Journals » Clinical Ophthalmology » Volume 11
Evaluation of a paper-based visual acuity questionnaire
Authors Uchino M, Kawashima M, Kaido M, Suwaki K ![]() , Uchino Y, Kawachi I, Negishi K
, Uchino Y, Kawachi I, Negishi K ![]() , Tsubota K
, Tsubota K ![]()
Received 30 March 2017
Accepted for publication 29 April 2017
Published 27 June 2017 Volume 2017:11 Pages 1213—1217
DOI https://doi.org/10.2147/OPTH.S138399
Checked for plagiarism Yes
Review by Single anonymous peer review
Peer reviewer comments 2
Editor who approved publication: Dr Scott Fraser
Miki Uchino,1 Motoko Kawashima,1 Minako Kaido,1 Kazuhisa Suwaki,2 Yuichi Uchino,1 Ichiro Kawachi,3 Kazuno Negishi,1 Kazuo Tsubota1
1Department of Ophthalmology, Keio University School of Medicine, Tokyo, 2Santen Pharmaceutical Co., Ltd, Osaka, Japan; 3Department of Social and Behavioral Sciences, Harvard T. H. Chan School of Public Health, Boston, MA, USA
Purpose: To validate a paper-based visual acuity (PBVA) questionnaire.
Methods: In 2015, a cross-sectional survey was conducted among 301 young and middle-aged, mostly male, Japanese subjects. The participants were asked to self-rate their visual acuity (VA) on a scale from 1 to 5. Self-ratings of VA were categorized into three groups: good (1 and 2), normal (3), and poor (4 and 5). For objective validation, we performed a functional VA (FVA) assessment in the same subjects.
Results: A total of 301 subjects answered the PBVA and completed the FVA test including initial VA. We found out that the result of PBVA was significantly correlated with FVA test and initial VA (r=0.33, P<0.0001, r=0.273, P<0.0001). The trend test analysis between PBVA and FVA also showed statistically significant (P<0.0001).
Conclusion: There was a significant statistical correlation between the PBVA and the FVA, as well as the initial VA. This short questionnaire on VA might be a sensitive tool that is easy to implement and utilized in large epidemiological and clinical researches.
Keywords: paper-based visual acuity, questionnaire, functional visual acuity, validation
Introduction
Over 90% of information is acquired by vision; therefore, effective vision is an important element for maintaining a good quality of life.1 Studies have demonstrated the association of a shorter life expectancy and a lower quality of life with poor vision, such as blindness and visual impairments.2,3 Moreover, people with poor vision are at an increased risk of traffic accidents.4,5 Many jobs, including professional driving, flying, and quality control, require good vision.6 Visual acuity (VA) testing is the most frequently performed examination of visual function in clinical practice. VA measurements are used to establish the need for clinical investigation and quantify changes in central vision over time. Utilization of effective screening methods to detect the risk in a population followed by comprehensive eye examinations would be an appropriate way to reduce preventable blindness.
Many large-scale eye epidemiological studies are based on paper-based visual acuity (PBVA) questionnaires.7,8 Therefore, large epidemiological studies do not provide information on vision due to the challenges in performing a standard visual examination on every individual. The limitations for measuring participants’ vision are distance to the field, lack of infrastructure, and need for examiners. A variety of questionnaire survey methods have been used to obtain information on vision.9,10 Questionnaires have an advantage in that the participant is not required to visit the clinic; however, actual vision is difficult to assess through previously designed questionnaires. Therefore, it is not possible to utilize these in an epidemiological setting.
To the best of our knowledge, there is no standard questionnaire for measuring self-reported VA. To address the difficulty in obtaining VA information in a large epidemiological study, we evaluated a new PBVA questionnaire. The aim of this study was to validate the PBVA using clinical data to define the “quick assessment of vision”.
Subjects and methods
This was a cross-sectional, observational study conducted between August 28 and September 9, 2015 at the National Agency for Automotive Safety and Victims’ Aid (NASVA), Tokyo, Japan. The study protocol was reviewed and approved by the Ethics Committee of the Institutional Review Board at the Shinanozaka Clinic (Tokyo, Japan). It was conducted in accordance with the guidelines of the World Medical Association Declaration of Helsinki, and Ethical Guidelines for Medical and Health Research involving Human Subjects in Japan. The subjects received a full explanation of the procedures and provided informed consent for participation prior to inclusion in the study. The study was registered in a public registration system (University Hospital Medical Information Network, ref no: UMIN000019008).
Study subjects
NASVA is an organization that provides mandatory guidance and supervision designated by the Minister of Land, Infrastructure, Transport, and Tourism in a public notice over passenger and motor truck transportation business operators. Among the professional drivers working in transport and tourism, including drivers of buses and taxis, the following are required to take aptitude tests: drivers who have caused traffic accidents causing death or serious injury, persons newly hired as drivers, and seniors over the age of 65 years. In this study, among the 1,181 visitors who visited NASVA for a driving qualification test, we randomly recruited 301 subjects for further eye examinations. The majority of visitors who came to have eye check at NASVA were male (1,156 subjects, 97.9%). We also collected data on subject characteristics including sex, age, and ocular and systemic comorbidities.
Clinical assessment: VA testing
Decimal VA examination was performed with the subjects’ corrected vision. To measure their daily VA, we did not measure their best-corrected VA using the corrective lens. A functional VA (FVA) measurement system (AS-28: Kowa, Aichi, Japan) was used to examine the decimal VA and changes in continuous VA over time. The outcomes recorded were initial VA, FVA, and visual maintenance ratio.11,12 Initial VA was defined as the standard daily VA measured by the FVA measurement system. Initial VA was measured with daily correction, such as glasses or contact lens. FVA was defined as the mean value of time-wise changes in VA during the examination. The visual maintenance ratio was defined as the FVA divided by baseline VA.11 FVA was measured during a 60-second period under daily vision correction, without topical anesthesia. Subjects were allowed to blink naturally during the measurement period. Patients delineated the orientation of automatically presented Landolt rings by manipulation of a joystick. For analysis, decimal VA values were converted to the logarithm of the minimum angle of resolution (logMAR).
PBVA questionnaire
The PBVA comprised one question: “How well can you see in your daily life?” The possible answers were divided into five ratings: 1, very good; 2, a little good; 3, normal; 4, a little poor; and 5, very poor. For simplicity, we categorized PBVA responses into three groups as follows: 1 and 2, good vision; 3, normal vision; and 4 and 5, poor vision. The scores derived from the questionnaire were considered to be PBVA. In the second analysis, we used the dichotomous classification of individuals by VA (normal vs impaired). Using the general US driving license vision requirement, which is 20/40,13 we determined visual cutoff values. We then evaluated the sensitivity and specificity of the PBVA questionnaire.
Statistical analyses
We used SAS software (v. 9.3, SAS Inc., Cary, NC, USA) to calculate the proportion, mean, and standard deviation. Continuous data are expressed as the mean ± standard deviation. Data collected from both eyes were included in the study. The correlation between PBVA and FVA was analyzed using the Pearson’s correlation analysis.
The Pearson’s correlation coefficient (r) between PBVA and visual function including initial VA, FVA, and VA maintenance ratio was derived. The correlation coefficient is a statistical measure of the strength of linear dependence between two variables, in this case, each pair of VA tests. The value of r can range from −1 to 1, both inclusive. An r value of 0 implies that there is no linear correlation between the results of the clinical methods.14 Statistical significance was set at the level of alpha ≤0.05.
Results
In this cross-sectional study, 301 (295 male and 6 female subjects; mean age 49.4±14.7 years, range 21–79) subjects were recruited; all participants completed the examination to be included in the final analysis. The study population characteristics are summarized in Table 1. Most subjects who enrolled in our study were good in health; only 32 subjects (10.6%) had an ocular disease and 25 (8.3%) had a systemic disease.
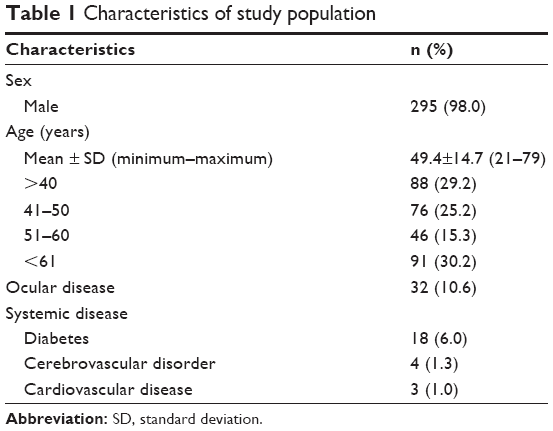 | Table 1 Characteristics of study population |
The mean PBVA score was 2.9±0.6, and the mean logMAR initial VA was 0.01±0.17. Eighty-eight subjects (29.3%) reported good vision, 131 (43.5%) reported normal vision, and 82 subjects (27.2%) reported poor vision (Table 2). There was no significant difference in vision between sexes; however, we found a significant trend of poor vision with age (P<0.005). There was a significant association between PBVA and initial VA (Table 3; trend test, P<0.001). The subjects who reported good vision in the PBVA had significantly better initial vision as well as FVA compared with subjects who reported normal or poor vision (trend test, P<0.001). Pearson’s correlation coefficients are presented in Table 4. Among the VA tests assessed, the significant correlation, r=0.33 (P<0.0001) was found between PBVA results and initial VA. The correlation coefficient for PBVA and FVA was r=0.27 (P<0.0001). The visual maintenance ratio did not show a significant correlation with PBVA (r=−0.059, P=0.15). In the second analysis, that is, dichotomous classification by VA over 20/40, the sensitivity and specificity of PBVA were 73.2% and 35.7%, respectively.
 | Table 2 Result of paper-based vision acuity test |
 | Table 3 Association between paper-based vision acuity test and results from function visual acuity test |
 | Table 4 The correlation between PBVA and actual vision acuity |
Discussion
In this study, we assessed the validity of the question “How well can you see in your daily life?” in subjects attending NASVA. The aim was to validate a simple questionnaire composed of one question that could be used as a simple tool to assess VA status in large-scale epidemiological research, as well as in a clinical setting. Our findings showed that VA assessments were comparable with FVA test measurements.
Clinical validation of the PBVA showed a significant correlation for discriminating daily VA. This result indicates a moderate positive linear relationship between the two clinical tests. FVA is a well-known measurement of consecutive VA, which is considered vision in daily life.11,12 There was also a positive linear relationship between FVA and the PBVA. These results indicate that this PBVA can be used as an alternative tool for measuring VA.
A previous survey of 15,000 households asking, “Do you have any difficulty at all in seeing to read or get about?” revealed that, among the subjects who reported negatively to the question, less than half of the participants had poor VA, which is <20/60.2 The implication of the result is difficult and the utility of this questionnaire is limited in epidemiological studies. Another study evaluating a visual function questionnaire using subjects aged 40–64 years formulated a more restricted question as “Do you have difficulty seeing objects?”15 Results revealed that the questionnaire had a low sensitivity (28.4%) and high specificity compared with the same VA criterion. Since the sensitivity was low in the previous study, it might be difficult to use as predictor of better vision in epidemiological studies. In this study, the PBVA’s sensitivity and specificity of vision over 20/40 were 73.2% and 35.7%, respectively. The high sensitivity is valuable for predicting vision over 20/40 and makes it feasible to implement the PBVA in large epidemiological studies.
In the present era, technological advancements are taking place at a very rapid pace. There are many devices that can potentially measure VA remotely, such as logMAR-based pocket vision screeners16 and computer-based logMAR chart measurements.17 Research using computer-based logMAR chart measurements without the presence of examiners showed that measurements were as reliable as with the physical presence of an optometrist.17 However, all of these tools require measurement devices, examiners, and time to measure. Therefore, the utilization of these instruments for mass measurements is limited.
Self-reporting web-based surveys have become a major trend, replacing person-to-person interviews. A web-based survey is the collection of data using a self-administered electronic set of questions on the Internet. With web-based surveys, the manager has control over the physical appearance and can create attractive and inviting forms. Web-based surveys can include radio buttons and drop-down lists that permit only one choice for the response to avoid multiple answers. The utilization of web surveys in the ophthalmic field has been increasing. The determination of myopia, astigmatism, and presbyopia were previously considered only possible by refractometry. However, Walline et al investigated a simple novel question to measure refraction with high sensitivity and specificity (0.76 and 0.74, respectively).18 The use of a questionnaire enables us the assessment of a refractory situation using a web-based program. The utilization of the PBVA in a web-based survey will also make it possible to predict vision in a survey.
In the light of education, economic level, and health insurance status, we did not measure the education level and economic level. According to Japan Federation of Hire-Taxi Association,19 the education level was unrevealed; however, the average annual income is around US$34,000, which is lower than Japanese average annual income in 2016 (US$40,000). Using the survey of Ministry of Health, Labour and Welfare, the rural area of Japan has lower income.20 Therefore, we suppose that the discrepancy between the study subjects and residents in rural area might not be enormous.
In addition, health insurance status can also affect the generalizability of our result. In Japan, we have public health insurance for the whole nation, which means that there were no subjects who do not have health insurance in our study subjects. In Japan, we do not have any discrepancy among health insurance that prevents from generalizing our result.
Limitations
A number of limitations should be considered when interpreting the present findings. First, this was a cross-sectional survey, which did not evaluate the repeatability of the PBVA. Therefore, further study is required to determine the repeatability. Second, our questionnaire was not specific about far or near vision; therefore, we cannot be certain whether participants were able to accurately report their far vision. Third, our subjects were mostly male so there may have been a potential selection bias in our study. Fourth, we did not measure the fluctuation of the vision in a day. As the vision change during the day, we need to conduct a study asking for the changing in vision in a day and measuring subjects with poor vision. Finally, the PBVA specificity was low, which can lead to a high false-positive rate; therefore, careful interpretation of the results is essential. The reason for low specificity is that the population we tested included subjects with mostly good vision. Further research should focus on implementing a PBVA on far or near vision, with sex-matched subjects, in order to develop a simple and robust questionnaire to measure VA remotely.
Conclusion
Given our strong desire to develop a short instrument that could potentially be used in large-scale cohort studies, we limited the number of questions to just one in our PBVA. This validation study shows that this PBVA is a sensitive tool that can be used to better ascertain VA with a good validity. This short questionnaire for VA is a simple tool to administer for the monitoring of vision when measurements are difficult to make.
Acknowledgments
This study was conducted by the joint study organization of the Japanese Dry Eye Society and Santen Pharmaceutical Co. Ltd. Both organizations contributed to the creation of documents including the study protocol, management of study progress, and providing information and support to the study sites, evaluation of the data analysis and disclosure of the outcome of this study, and entry/update of this study in the public registration system.
This study was supported by the Japanese Dry Eye Society, Tokyo, Japan, and Santen Pharmaceutical Co., Ltd, Osaka, Japan.
Disclosures
Kazuhisa Suwaki is an employee for Santen Pharmaceutical Co. Ltd.
Minako Kaido hold patent rights for the method and the apparatus used for the measurement of functional visual acuity (US patent no: 7470026).
Kazuno Negishi is a consultant for RE Medical Inc., Bausch + Lomb, Wakamoto Co. Ltd, Kowa Co. Ltd, Senjyu Co. Ltd, Tore Co. Ltd, HOYA Co. Ltd, AMO Co. Ltd, Universal View Co. Ltd, Santen Pharmaceutical Co. Ltd, Alcon Co. Ltd, and Fuji Xerox Co. Ltd.
Kazuo Tsubota is a consultant and research funding received from Santen Pharmaceutical Co., Ltd., research funding received from Kowa Company, and holds the patent rights for the method and the apparatus used for the measurement of functional visual acuity (US patent no 7470026).
Miki Uchino, Motoko Kawashima, Yuichi Uchino, and Ichiro Kawachi report no conflicts of interest in this work.
References
Vu HT, Keeffe JE, McCarty CA, Taylor HR. Impact of unilateral and bilateral vision loss on quality of life. Br J Ophthalmol. 2005;89(3):360–363. | ||
Swanson MW, McGwin G. Visual impairment and functional status from the 1995 National Health Interview Survey on Disability. Ophthalmic Epidemiol. 2004;11(3):227–239. | ||
McCarty CA, Nanjan MB, Taylor HR. Vision impairment predicts 5 year mortality. Br J Ophthalmol. 2001;85(3):322–326. | ||
Owsley C, McGwin G Jr. Vision impairment and driving. Surv Ophthalmol. 1999;43(6):535–550. | ||
Meuleners LB, Hendrie D, Lee AH, Ng JQ, Morlet N. The effectiveness of cataract surgery in reducing motor vehicle crashes: a whole population study using linked data. Ophthalmic Epidemiol. 2012;19(1):23–28. | ||
Margaretta W, Weissman B. Vision testing for the safety professional, Part 2. Occup Health Saf. 2009;78(6):64, 66, 68. | ||
Schaumberg DA, Sullivan DA, Buring JE, Dana MR. Prevalence of dry eye syndrome among US women. Am J Ophthalmol. 2003;136(2):318–326. | ||
Miljanović B, Dana R, Sullivan DA, Schaumberg DA. Impact of dry eye syndrome on vision-related quality of life. Am J Ophthalmol. 2007;143(3):409–415. | ||
Feller BA. Prevalence of Selected Impairments, United States-1977. National Center for Health Statistics, Hyattsville, MD, US DHHS Pub. Vital and Health Statistics Series 10. 1981:134. | ||
Cullinan TR. The epidemiology of visual disability. Studies of visually disabled people in the community. HSRU Report No. 28, Center for Research in the Social Sciences, University of Kent at Canterbury, 1977. | ||
Kaido M, Dogru M, Yamada M, et al. Functional visual acuity in Stevens-Johnson syndrome. Am J Ophthalmol. 2006;142(6):917–922. | ||
Kaido M, Dogru M, Ishida R, Tsubota K. Concept of functional visual acuity and its applications. Cornea. 2007;26(9):S29–S35. | ||
Steinkuller PG. Legal vision requirements for drivers in the United States. Virtual Mentor. 2010;12(12):938–940. | ||
Taylor R. Interpretation of the correlation coefficient: a basic review. J Diag Med Sonogr. 1990;6(1):35–39. | ||
Stone DH, Shannon DJ. Screening for impaired visual acuity in middle age in general practice. Br Med J. 1978;2(6141):859–861. | ||
Raja M, Ramamurthy D, Srinivasan K, Varadharajan LS. Development of pocket vision screener and its effectiveness at screening visual acuity deficits. Indian J Ophthalmol. 2014;62(12):1152–1155. | ||
Srinivasan K, Ramesh SV, Babu N, Sanker N, Ray A, Karuna SM. Efficacy of a remote based computerised visual acuity measurement. Br J Ophthalmol. 2012;96(7):987–990. | ||
Walline JJ, Zadnic K, Mutti DO. Validity of surveys reporting, myopia, astigmatism, and presbyopia. Optometr Vis Sci. 1996;73(6):376–381. | ||
Japan Federation of Hire-Taxi Associations. Report for wage and working hours of Taxi drivers, 2016. Available from: http://www.taxi-japan.or.jp/pdf/toukei_chousa/tingin28.pdf. Accessed April 24, 2017. Japanese. | ||
Ministry of Health, Labour and Welfare. Annual Report of Labor Statistics Heisei 21 2009; III Wages. Available from: http://www.mhlw.go.jp/toukei/youran/roudou-nenpou/03.html. Accessed April 24, 2017. |
 © 2017 The Author(s). This work is published and licensed by Dove Medical Press Limited. The
full terms of this license are available at https://www.dovepress.com/terms
and incorporate the Creative Commons Attribution
- Non Commercial (unported, 3.0) License.
By accessing the work you hereby accept the Terms. Non-commercial uses of the work are permitted
without any further permission from Dove Medical Press Limited, provided the work is properly
attributed. For permission for commercial use of this work, please see paragraphs 4.2 and 5 of our Terms.
© 2017 The Author(s). This work is published and licensed by Dove Medical Press Limited. The
full terms of this license are available at https://www.dovepress.com/terms
and incorporate the Creative Commons Attribution
- Non Commercial (unported, 3.0) License.
By accessing the work you hereby accept the Terms. Non-commercial uses of the work are permitted
without any further permission from Dove Medical Press Limited, provided the work is properly
attributed. For permission for commercial use of this work, please see paragraphs 4.2 and 5 of our Terms.