Back to Journals » Clinical Ophthalmology » Volume 12
Evaluation of contrast sensitivity and other visual function outcomes in diabetic macular edema patients following treatment switch to aflibercept from ranibizumab
Received 28 November 2017
Accepted for publication 27 December 2017
Published 22 January 2018 Volume 2018:12 Pages 191—197
DOI https://doi.org/10.2147/OPTH.S158268
Checked for plagiarism Yes
Review by Single anonymous peer review
Peer reviewer comments 2
Editor who approved publication: Dr Scott Fraser
Donald R Nixon, Nicholas AP Flinn
Trimed Eye Center, Barrie, ON, Canada
Purpose: This study aims to investigate changes in contrast sensitivity (CS), visual acuity (VA), central retinal thickness (CRT), and vision-related quality of life in subjects with recalcitrant diabetic macular edema switched from long-term ranibizumab treatment to aflibercept.
Patients and methods: In this prospective, investigator-masked, single-center study, 40 patients with persistent fluid, despite previous ranibizumab treatment, were switched to aflibercept with 5 consecutive monthly doses. The primary outcome was mean change from baseline to week 20 in Pelli–Robson CS. Secondary outcomes were mean change from baseline in best-corrected VA (BCVA), CRT, and National Eye Institute 25-Item Visual Function Questionnaire score.
Results: Fifty eyes (baseline VA >6/30) were evaluated. A median of 21.1±11.9 (range 5–55) ranibizumab injections were administered prior to initiation of aflibercept. Mean CS improved from 1.40±0.14 log units at baseline to 1.46±0.15 log units at week 20 (P<0.001). VA improved with mean logarithm of the minimum angle of resolution BCVA of 0.33±0.19 at baseline compared with logarithm of the minimum angle of resolution BCVA of 0.28±0.16 at week 20 (P=0.0016). Mean CRT decreased from 324±85 to 289±61 µm (P<0.001). Twenty-two (55%) patients experienced an overall improvement in National Eye Institute 25-Item Visual Function Questionnaire score. Interestingly, an association was found between changes in CS and change in CRT (r2=0.385, P<0.001) and between changes in BCVA and change in CRT (r2=0.092, P=0.032).
Conclusion: Switching from ranibizumab to aflibercept in patients with recalcitrant diabetic macular edema resulted in an improvement in all measured metrics, including CS, VA, and CRT. A majority of patients also indicated an improvement in vision-related quality of life. The finding of a stronger relationship between changes in CRT and CS compared with changes in CRT and BCVA suggests that the inclusion of CS as an endpoint may yield a more complete understanding of visual outcomes than that obtained by using VA alone.
Keywords: aflibercept, ranibizumab, diabetic macular edema, contrast sensitivity, visual acuity, anti-VEGF
Introduction
The global prevalence of diabetes (among adults aged 20–79 years) is predicted to rise to 642,000,000 by 2,040, according to the latest data from the International Diabetes Federation.1 One of the most common microvascular complications of diabetes is retinopathy, affecting 10% of diabetic patients.2 Diabetic macular edema (DME) is the leading cause of visual impairment in diabetic retinopathy (DR) and has a significant impact on quality of life.3 The pathogenesis of DME is highly complex and not yet fully understood. It has been suggested that in patients with diabetes, hyperglycemia may trigger tissue alterations such as damage to capillary endothelial cells in the retina and blood–retinal barrier breakdown, and one of the key players in this process is vascular endothelial growth factor (VEGF).4 Both angiogenesis and inflammation have been shown to be involved in the pathogenesis of DME; however, it remains to be clarified whether angiogenesis following VEGF overexpression is a cause or a consequence of inflammation.5
Laser photocoagulation had been the standard of care for DME for decades following the Early Treatment DR Study (ETDRS) in the 1980s, but this treatment had limited effectiveness in improving vision.6 Corticosteroids have been used to treat DME due to their anti-inflammatory and anti-angiogenic effects, but their use is associated with high rates of increased intraocular pressure and cataract.7,8 Several large clinical trials have established the efficacy and safety profile of anti-VEGF therapy, which has revolutionized how DME is treated and has become the primary treatment for the condition in the majority of DME patients.9,10
In 2012, ranibizumab (Lucentis®; Genentech Inc, San Francisco, CA, USA and Novartis Pharma AG, Basel, Switzerland) became the first anti-VEGF agent approved by the US Food and Drug Administration (FDA) for DME.11 The efficacy and safety of ranibizumab were demonstrated in the RISE and RIDE Phase III clinical trials, which showed that ranibizumab rapidly and sustainably improved vision over 24 months, reduced the risk of further vision loss, and improved macular edema in patients with DME, with low rates of adverse events.10 While not approved for ocular use, bevacizumab (Avastin®; Roche Pharma AG, Vienna, Austria) has been evaluated in smaller trials such as the BOLT study, which provided evidence supporting long-term use of intravitreal bevacizumab for persistent clinically significant macular edema.12 Most recently, aflibercept (Eylea®; Regeneron Pharmaceuticals Inc, Tarrytown, NY, USA and Bayer, Basel, Switzerland) gained FDA approval to treat DME in 2014 with the VIVID and VISTA Phase III clinical trials, which demonstrated significant and sustained superiority of aflibercept over laser photocoagulation.9,13 Protocol T, the first head-to-head comparison between the 3 anti-VEGF agents, documented significantly better visual acuity (VA) gains with aflibercept compared with bevacizumab and ranibizumab in DME patients in the first year; in the second year, however, the superiority of aflibercept over ranibizumab in patients with baseline VA of 20/50 or worse was no longer present, and all 3 anti-VEGF agents had similar VA outcomes in patients with baseline VA of 20/40 or better.14,15
While no large clinical trials have been undertaken to investigate the efficacy of switching between anti-VEGF agents, a collection of small studies showed the benefit of converting to aflibercept in patients with suboptimal response to ranibizumab and/or bevacizumab: significant anatomic improvements were observed after the switch, across 6 studies; improvements in VA, however, were limited.11,16–20
VA is a measure of the spatial-resolving ability of the visual system, usually under conditions of high contrast.21 VA assessment is the most commonly employed test within ophthalmic examinations, with the ETDRS chart being the primary choice of method to measure VA in registration trials, and the Snellen chart being the predominant modality for VA assessment in the clinical setting.22 These charts present a series of black-on-white letters in different sizes with the same contrast against the background. However, VA evaluation alone may be inadequate as the real world consists of not only black and white, but also shades of gray where images blend in with backgrounds. In comparison, contrast sensitivity (CS) determines the smallest amount of contrast required to be able to see a target. It defines the threshold between the visible and invisible. In this case, contrast is not kept constant during the test but is varied so that the minimum level of contrast for seeing a target can be determined.21 CS is a fundamental aspect of visual performance and measuring CS provides additional information on the quality of vision.23
DR has been known to be associated with abnormal and reduced CS.24,25 Studies have shown that even in diabetic patients with good VA, CS could be impaired.26–28 CS is thus an important outcome measure and could be considered as an adjunct to standard VA testing for a more complete assessment of visual function in DME patients. The CS test has been proven useful for diagnosing early and advanced DR.24,26,29 It has also grown in popularity as a clinical tool for evaluating the impact of therapy since potential treatment response may not be completely characterized by VA measurement alone.21
To better assess the effect of treatment change on patients’ overall visual functioning, this study was designed to determine and evaluate changes in CS as the primary outcome measure, and in VA as a key secondary outcome measure, in DME patients following treatment switch to aflibercept from ranibizumab.
Material and methods
This institutional review board (IRB)-approved (IRB Services, Aurora, ON, Canada), prospective, interventional, investigator-masked, open-label, non-controlled, single-center study was conducted at Trimed Laser Eye Center, Barrie, ON in Canada, between June 2016 and April 2017. A total of 40 non-consecutive DME patients with persistent fluid on spectral-domain optical coherence tomography (SD-OCT) following at least 3 consecutive ranibizumab injections in the previous 6 months were switched to aflibercept. The criteria for inclusion and exclusion of participants are listed in Table 1. Subjects received 5 consecutive loading doses of 2 mg (0.05 mL) aflibercept at 4-week intervals (weeks 0, 4, 8, 12, and 16). The dosing protocol matched the recommended treatment posology for DME. All patients completed clinical assessments at baseline and week 20. The primary endpoint was mean change of CS from baseline to week 20. Secondary endpoints were mean change from baseline to week 20 in best-corrected VA (BCVA), central retinal thickness (CRT), and vision-related quality of life. The investigator was masked to the outcomes in the main study endpoints until all patients had completed the study.
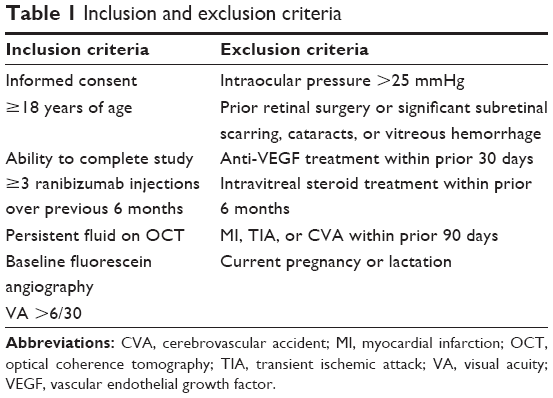 | Table 1 Inclusion and exclusion criteria |
CS was measured using the Pelli–Robson test at 1 m. The test uses a chart containing optotypes of constant size and varying levels of contrast.30 The Pelli–Robson CS chart measures 59×84 cm in size and at the recommended 1 m test distance, all letters subtend 2.8 degrees.31 Each of the 8 rows in the chart comprises 2 triplets of letters. The 3 letters within each triplet have equal contrast; however, each triplet decreases in contrast across and down the chart.31
BCVA was recorded using the Snellen chart and converted to logarithm of minimum angle of resolution (logMAR) equivalents for analysis. CRT was measured using SD-OCT (Heidelberg Spectralis; Heidelberg Engineering Inc., Vista, CA, USA). Vision-related quality of life was assessed using the National Eye Institute 25-Item Visual Function Questionnaire (NEI VFQ-25) questionnaire with composite score.
Statistical data analysis was performed once all patients had completed the week 20 visit using R version 3.4.0.32 Visual statistical analyses included mean change in BCVA and CS comparing week 20 to baseline. Anatomic statistical analyses included mean change in CRT at week 20 compared with baseline. A 2-sided paired t-test was used to compare the means of continuous variables. If not otherwise stated, all values are presented as mean ± SD. A P-value <0.05 was considered statistically significant.
The study was conducted in accordance with the principles of the Declaration of Helsinki and in compliance with Good Clinical Practice and applicable regulatory requirements. The study procedure and informed consent document were approved by IRB Services prior to initiating the study. Written informed consent was obtained from all participants before study enrollment.
Results
Characteristics of study population
A total of 50 eyes from 40 patients were included in the study. The mean age of the patients was 70.3±11.3 years, and most were male (65%; Table 2). A mean of 21.1±11.9 (range 5–55) ranibizumab injections, with a mean treatment duration of 30.1±16.5 months, were administered prior to initiation of aflibercept treatment. The mean number of ranibizumab injections in the previous 6 months before the switch to aflibercept was 5.5 (range 5–6). No patients were lost to follow-up, and there were no treatment discontinuations. No ocular or nonocular adverse events were reported in the patient population during the study.
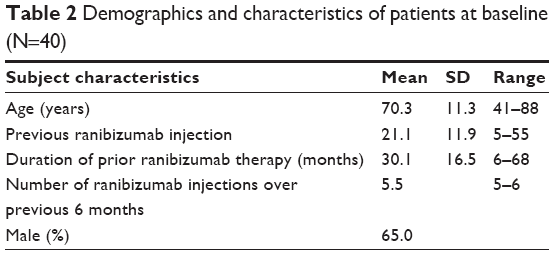 | Table 2 Demographics and characteristics of patients at baseline (N=40) |
Measures of visual function and anatomic outcomes
Mean CS increased from 1.40±0.14 log units at baseline to 1.46±0.15 log units at week 20 (P<0.001; Figure 1). VA also improved over the study period with mean logMAR BCVA of 0.33±0.19 at baseline compared with 0.28±0.16 at week 20 (P=0.0016; Figure 2). There was a statistically significant decrease of 35 μm in mean CRT from 324±85 μm at baseline to 289±61 μm at week 20 (P<0.001; Figure 3). A statistically significant relationship between changes in CS and CRT (r2=0.385, P<0.001; Figure 4) and BCVA and CRT (r2=0.092, P=0.032; Figure 5) was also found.
 | Figure 1 Mean log contrast sensitivity at baseline and week 20. |
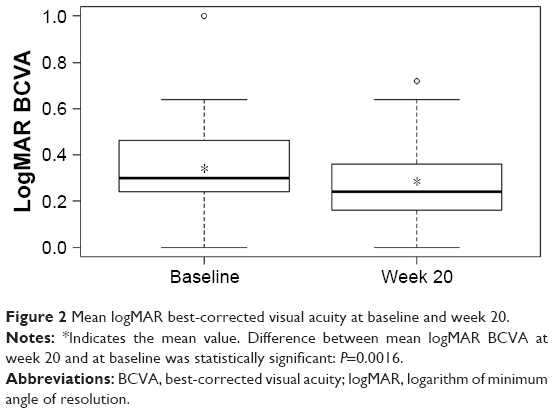 | Figure 2 Mean logMAR best-corrected visual acuity at baseline and week 20. |
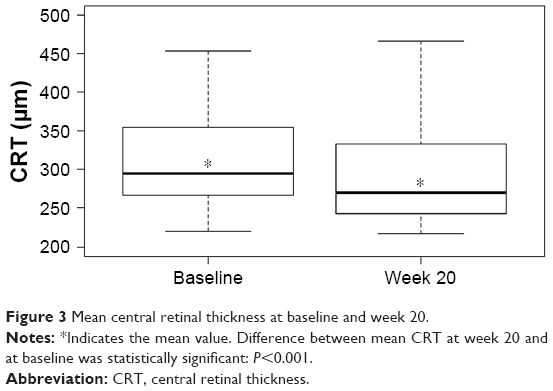 | Figure 3 Mean central retinal thickness at baseline and week 20. |
 | Figure 4 Change in log contrast sensitivity versus change in central retinal thickness at week 20. |
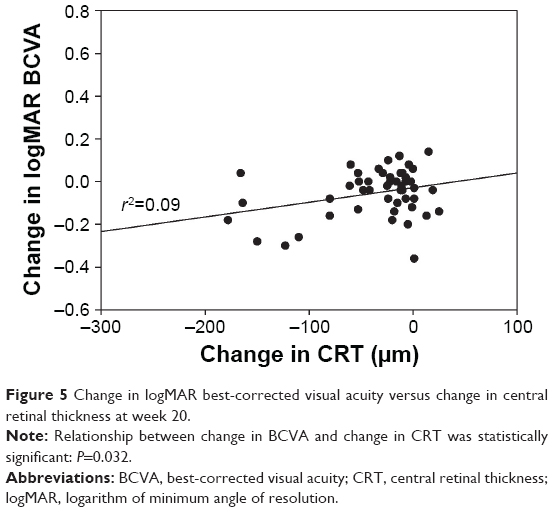 | Figure 5 Change in logMAR best-corrected visual acuity versus change in central retinal thickness at week 20. |
Vision-related quality of life measured using NEI VFQ-25
At week 20, 22 of 40 patients (55%) experienced an overall improvement in NEI VFQ-25 composite score compared with baseline; 8 patients (20%) experienced no change, and 10 patients (25%) experienced an overall decrease.
Discussion
Study results have demonstrated the functional and anatomic improvements following treatment switch to aflibercept from ranibizumab in recalcitrant DME patients. A statistically significant improvement was found in the primary outcome, with an average CS change of 0.06 log units from baseline to week 20. In addition to CS, statistically significant including an improvement of 0.05 logMAR in BCVA and a 35 μm reduction in CRT. More than half of the patients indicated an improvement in vision-related quality of life, but the number of patients was too small to evaluate a statistical relationship in subgroups.
It is possible that short-term loss of efficacy might have occurred with anti-VEGF therapy, a phenomenon known in the literature as tachyphylaxis.33 Case studies reported some improvements in CRT and VA in DME patients switched to ranibizumab following bevacizumab treatment failure.34 However, aflibercept is structurally distinct from bevacizumab and ranibizumab; as a fusion protein consisting of VEGF-binding portions from the extracellular components of VEGF receptor (VEGFR)-1 and VEGFR-2 fused to the fragment crystallizable portion of immunoglobulin G to form a cytokine trap, aflibercept appears to have a number of theoretical advantages over monoclonal antibody bevacizumab and antibody fragment ranibizumab.35 Aflibercept has markedly greater binding affinity to VEGF-A than either bevacizumab or ranibizumab: the association rate for aflibercept binding to VEGF-A was orders of magnitude faster than that measured for bevacizumab and ranibizumab in pharmacokinetic studies.36 Similarly, aflibercept inhibited VEGF-A induced activation of VEGFR-1 and VEGFR-2 more potently than bevacizumab or ranibizumab in cell-based assays.36 Unlike bevacizumab or ranibizumab, aflibercept also binds to other VEGF family members VEGF-B and, importantly, placental growth factor – a cytokine that can stimulate angiogenesis and plays a crucial role in the activation and sustainment of the inflammatory switch associated with neo-angiogenesis.37 It is reasonable to assume that these pharmacologic advantages of aflibercept are at least partially responsible for the data presented here.
Results from our study are consistent with findings from other studies investigating outcomes of switching to aflibercept in patients with recalcitrant DME who had been previously treated with ranibizumab and/or bevacizumab. All of these studies were relatively small, involving between 14 and 50 eyes.11,16–20 Four studies showed statistically significant anatomic improvements with a mean reduction of 37–134 μm in CRT (P<0.05 for all studies), and statistically significant visual improvements with a mean reduction of 0.05–0.06 logMAR in BCVA or a gain of 3 letters on the ETDRS VA chart (P<0.05 for all studies).16–19 In comparison, 2 studies showed statistically significant anatomic improvements with a mean reduction of 96 and 112 μm in CRT (P<0.05 for both studies), while no statistically significant changes in VA were observed.11,20
It is worth noting that 26 patients (64%) in our study still had persisting fluid on SD-OCT at 6 months following treatment switch to aflibercept. One possible explanation is that patients included in the study were those refractory to previous anti-VEGF therapy; this unique subset of “difficult-to-treat” patients may require longer treatment time to achieve optimal outcomes. The results could also be explained by the chronic nature and insidious development of diabetic complications. DR is caused by ongoing damage to the small blood vessels of the retina.38 Inner retinal alterations occurring in patients with DME may lead to visual deficiency persisting after treatment despite a favorable anatomic response.39
When assessing the relationship between anatomic and visual function response to treatment, we observed a statistically significant relationship between a decrease in CRT and an improvement in CS; in comparison, a relatively weaker relationship between changes in CRT and BCVA was seen. This suggests that the inclusion of CS as a measurable endpoint of visual function may yield a more complete understanding of treatment outcomes than that obtained by using VA measurements alone. A similar study evaluating outcomes in patients with recalcitrant neovascular age-related macular degeneration switched to aflibercept from ranibizumab also used CS as the main visual outcome measure.40 The study demonstrated an association between improvement in CS and change in CRT, but no relationship between improvement in VA and change in CRT.40
An increasing number of studies have indicated that VA often fails to predict the day-to-day visual problems faced by the patients.41 Although VA testing is helpful in identifying difficulties in seeing detail, much of our routine visual activity involves the detection and discrimination of larger objects in luminance.41 Many daily visual tasks such as reading, driving, and face recognition are highly dependent on CS, and CS has been shown to be a strong predictor of real-world performance, providing useful independent information in relation to one’s visual function, which may not be revealed by VA.21 For example, a patient with poor CS may be able to easily identify dark letters on a white VA chart. Failure to identify a patient with impaired CS may cause unrecognized and untreated visual problems effecting the patient’s day-to-day life. Therefore, it is important to include CS as an additional measure to understand the full impact of vision impairment on everyday life. This may be of particular interest to patients with DME because of the close association between DR and CS: vision deterioration in DR is associated with damage to retinal ganglion cells, and responses delivered by ganglion cells to luminance and chromatic contrast are considered to be related to CS.42,43
We used the Pelli–Robson chart to measure CS in the study; a tool that has been used by researchers for many years and is currently the most widely used method for clinical spatial CS testing.30 It has good test–retest reliability and relative immunity from varying test conditions.21 The test is quick and can usually be completed in 3–5 minutes; it is easily administered in a clinical setting, with a 6-letter change in CS equating to a 15-letter (or 3-line) change in VA.21,44 It has been shown that Pelli–Robson CS is moderately associated with VA, with several studies indicating that these correlation coefficients are ~0.5–0.6.21
Our study is important because it used CS change as the primary efficacy endpoint and the results support the use of CS as an independent parameter for determining treatment outcomes in future clinical studies in DME. The data presented here add to the existing knowledge that the evaluation of change in CS provides valuable additional information and should be considered in conjunction with VA measurement when assessing the effect of new treatment modalities. Furthermore, the study design did not include a washout period, which is not typically employed in clinical practice when considering a switch in pharmaceutical agents; therefore, our study closely mimics clinical practice patterns, offering insight into the impact of treatment change in a real-world setting.
We acknowledge some limitations of the study, which are as follows: lack of a control group, a relatively small sample size, and a short follow-up. Additionally, to investigate possible tachyphylaxis with anti-VEGF therapy, it would be of interest to have a 2-period crossover study design involving a re-switch from aflibercept back to ranibizumab.
Conclusion
Management of DME cases exhibiting suboptimal response to anti-VEGF therapy remains a clinical challenge. Our study provides further evidence of the benefit of switching to aflibercept in patients with recalcitrant DME who had been previously treated with ranibizumab. Converting to aflibercept from ranibizumab in these patients led to positive anatomic and visual function outcomes, resulting in statistically significant improvements in all measured metrics, including CS, VA, and CRT. The majority of patients also indicated an improvement in vision-related quality of life. Future studies involving larger patient populations and longer durations are needed to determine whether these results will be sustained or improve further.
The finding of a stronger relationship between changes in CRT and CS compared with changes in CRT and BCVA suggests that CS may be a clinically meaningful measure of treatment response and could have implications for present and future studies evaluating treatment patterns and novel drug therapies in DME and other retinal diseases. Assessing both VA and CS in clinical studies may provide a more complete picture of the effect of treatment on vision than either measure alone. Wider use of CS as an additional outcome endpoint would offer clinicians important information about the impact of treatment on patients’ overall visual functioning.
Acknowledgments
The authors thank all the patients who participated in the study, the study team, and Zhizhi Fiske of Inspired Science, London, UK, who provided medical writing and editorial support. The study was in part supported by Bayer Inc. The abstract of this paper was presented at the 2017 Euretina Conference as an abstract presentation with interim findings. The poster’s abstract was published in “Poster Abstracts” online at http://www.euretina.org/barcelona2017/programme/posters-details.asp?id=14176.
Author contributions
Both authors contributed toward data analysis, drafting and critically revising the paper, and agree to be accountable for all aspects of the work.
Disclosure
Both authors report no conflicts of interest in this work.
References
Ogurtsova K, da Rocha Fernandes JD, Huang Y, et al. IDF Diabetes Atlas: Global estimates for the prevalence of diabetes for 2015 and 2040. Diabetes Res Clin Pract. 2017;128:40–50. | ||
Cheung N, Mitchell P, Wong TY. Diabetic retinopathy. Lancet. 2010;376(9735):124–136. | ||
Klein R, Klein BE, Moss SE. Visual impairment in diabetes. Ophthalmology. 1984;91(1):1–9. | ||
Fogli S, Mogavero S, Egan CG, Del Re M, Danesi R. Pathophysiology and pharmacological targets of VEGF in diabetic macular edema. Pharmacol Res. 2016;103:149–157. | ||
Romero-Aroca P, Baget-Bernaldiz M, Pareja-Rios A, Lopez-Galvez M, Navarro-Gil R, Verges R. Diabetic macular edema pathophysiology: vasogenic versus inflammatory. J Diabetes Res. 2016;2016:2156273. | ||
Photocoagulation for diabetic macular edema. Early Treatment Diabetic Retinopathy Study report number 1. Early Treatment Diabetic Retinopathy Study research group. Arch Ophthalmol. 1985;103(12):1796–1806. | ||
Ciulla TA, Harris A, McIntyre N, Jonescu-Cuypers C. Treatment of diabetic macular edema with sustained-release glucocorticoids: intravitreal triamcinolone acetonide, dexamethasone implant, and fluocinolone acetonide implant. Expert Opin Pharmacother. 2014;15(7):953–959. | ||
Kastelan S, Tomic M, Gverovic Antunica A, Salopek Rabatic J, Ljubic S. Inflammation and pharmacological treatment in diabetic retinopathy. Mediators Inflamm. 2013;2013:213130. | ||
Brown DM, Schmidt-Erfurth U, Do DV, et al. Intravitreal aflibercept for diabetic macular edema: 100-week results from the VISTA and VIVID studies. Ophthalmology. 2015;122(10):2044–2052. | ||
Nguyen QD, Brown DM, Marcus DM, et al; RISE and RIDE Research Group. Ranibizumab for diabetic macular edema: results from 2 phase III randomized trials: RISE and RIDE. Ophthalmology. 2012;119(4):789–801. | ||
Rahimy E, Shahlaee A, Khan MA, et al. Conversion to aflibercept after prior anti-VEGF therapy for persistent diabetic macular edema. Am J Ophthalmol. 2016;164:118–127.e2. | ||
Rajendram R, Fraser-Bell S, Kaines A, et al. A 2-year prospective randomized controlled trial of intravitreal bevacizumab or laser therapy (BOLT) in the management of diabetic macular edema: 24-month data: report 3. Arch Ophthalmol. 2012;130(8):972–979. | ||
Korobelnik JF, Do DV, Schmidt-Erfurth U, et al. Intravitreal aflibercept for diabetic macular edema. Ophthalmology. 2014;121(11):2247–2254. | ||
Wells JA, Glassman AR, Ayala AR, et al. Aflibercept, bevacizumab, or ranibizumab for diabetic macular edema. N Engl J Med. 2015;372(13):1193–1203. | ||
Wells JA, Glassman AR, Ayala AR, et al; Diabetic Retinopathy Clinical Research Network. Aflibercept, bevacizumab, or ranibizumab for diabetic macular edema: two-year results from a comparative effectiveness randomized clinical trial. Ophthalmology. 2016;123(6):1351–1359. | ||
Bahrami B, Hong T, Zhu M, Schlub TE, Chang A. Switching therapy from bevacizumab to aflibercept for the management of persistent diabetic macular edema. Graefes Arch Clin Exp Ophthalmol. 2017;255(6):1133–1140. | ||
Lim LS, Ng WY, Mathur R, et al. Conversion to aflibercept for diabetic macular edema unresponsive to ranibizumab or bevacizumab. Clin Ophthalmol. 2015;9:1715–1718. | ||
Mira F, Paulo M, Henriques F, Figueira J. Switch to aflibercept in diabetic macular edema patients unresponsive to previous anti-VEGF therapy. J Ophthalmol. 2017;2017:5632634. | ||
Shah CP, Heier JS. Aflibercept for diabetic macular edema in eyes previously treated with ranibizumab and/or bevacizumab may further improve macular thickness. Ophthalmic Surg Lasers Imaging Retina. 2016;47(9):836–839. | ||
Wood EH, Karth PA, Moshfeghi DM, Leng T. Short-term outcomes of aflibercept therapy for diabetic macular edema in patients with incomplete response to ranibizumab and/or bevacizumab. Ophthalmic Surg Lasers Imaging Retina. 2015;46(9):950–954. | ||
Owsley C. Contrast sensitivity. Ophthalmol Clin North Am. 2003;16(2):171–177. | ||
Ou WC, Brown DM, Payne JF, Wykoff CC. Relationship between visual acuity and retinal thickness during anti-vascular endothelial growth factor therapy for retinal diseases. Am J Ophthalmol. 2017;180:8–17. | ||
Thayaparan K, Crossland MD, Rubin GS. Clinical assessment of two new contrast sensitivity charts. Br J Ophthalmol. 2007;91(6):749–752. | ||
Arend O, Remky A, Evans D, Stuber R, Harris A. Contrast sensitivity loss is coupled with capillary dropout in patients with diabetes. Invest Ophthalmol Vis Sci. 1997;38(9):1819–1824. | ||
Khosla PK, Talwar D, Tewari HK. Contrast sensitivity changes in background diabetic retinopathy. Can J Ophthalmol. 1991;26(1):7–11. | ||
Hyvarinen L, Laurinen P, Rovamo J. Contrast sensitivity in evaluation of visual impairment due to diabetes. Acta Ophthalmol (Copenh). 1983;61(1):94–101. | ||
Katz G, Levkovitch-Verbin H, Treister G, Belkin M, Ilany J, Polat U. Mesopic foveal contrast sensitivity is impaired in diabetic patients without retinopathy. Graefes Arch Clin Exp Ophthalmol. 2010;248(12):1699–1703. | ||
Safi S, Rahimi A, Raeesi A, et al. Contrast sensitivity to spatial gratings in moderate and dim light conditions in patients with diabetes in the absence of diabetic retinopathy. BMJ Open Diabetes Res Care. 2017;5(1):e000408. | ||
Dosso AA, Bonvin ER, Morel Y, Golay A, Assal JP, Leuenberger PM. Risk factors associated with contrast sensitivity loss in diabetic patients. Graefes Arch Clin Exp Ophthalmol. 1996;234(5):300–305. | ||
Pelli DG, Robson JG, Wilkins AJ. The design of a new letter chart for measuring contrast sensitivity. Clin Vis Sci. 1988;2(3):187–199. | ||
Haymes SA, Roberts KF, Cruess AF, et al. The letter contrast sensitivity test: clinical evaluation of a new design. Invest Ophthalmol Vis Sci. 2006;47(6):2739–2745. | ||
R Core Team. R: A language and environment for statistical computing. Available from: https://www.r-project.org/. Accessed December 20, 2017. | ||
Binder S. Loss of reactivity in intravitreal anti-VEGF therapy: tachyphylaxis or tolerance? Br J Ophthalmol. 2012;96(1):1–2. | ||
Hanhart J, Chowers I. Evaluation of the response to ranibizumab therapy following bevacizumab treatment failure in eyes with diabetic macular edema. Case Rep Ophthalmol. 2015;6(1):44–50. | ||
Sarwar S, Bakbak B, Sadiq MA, et al. Fusion Proteins: Aflibercept (VEGF Trap-Eye). Dev Ophthalmol. 2016;55:282–294. | ||
Papadopoulos N, Martin J, Ruan Q, et al. Binding and neutralization of vascular endothelial growth factor (VEGF) and related ligands by VEGF Trap, ranibizumab and bevacizumab. Angiogenesis. 2012;15(2):171–185. | ||
De Falco S. The discovery of placenta growth factor and its biological activity. Exp Mol Med. 2012;44(1):1–9. | ||
Yancopoulos GD, Davis S, Gale NW, Rudge JS, Wiegand SJ, Holash J. Vascular-specific growth factors and blood vessel formation. Nature. 2000;407(6801):242–248. | ||
Bonnin S, Tadayoni R, Erginay A, Massin P, Dupas B. Correlation between ganglion cell layer thinning and poor visual function after resolution of diabetic macular edema. Invest Ophthalmol Vis Sci. 2015;56(2):978–982. | ||
Nixon DR, Flinn NA. Evaluation of contrast sensitivity and other visual function outcomes in neovascular age-related macular degeneration patients after treatment switch to aflibercept from ranibizumab. Clin Ophthalmol. 2017;11:715–721. | ||
Owsley C, Sloane ME. Contrast sensitivity, acuity, and the perception of ‘real-world’ targets. Br J Ophthalmol. 1987;71(10):791–796. | ||
Zhang J, Liu R, Kuang HY, Gao XY, Liu HL. Protective treatments and their target retinal ganglion cells in diabetic retinopathy. Brain Res Bull. 2017;132:53–60. | ||
Lee BB, Sun H. Contrast sensitivity and retinal ganglion cell responses in the primate. Psychol Neurosci. 2011;4(1):11–18. | ||
Rubin GS, Bandeen-Roche K, Huang GH, et al. The association of multiple visual impairments with self-reported visual disability: SEE project. Invest Ophthalmol Vis Sci. 2001;42(1):64–72. |
 © 2018 The Author(s). This work is published and licensed by Dove Medical Press Limited. The
full terms of this license are available at https://www.dovepress.com/terms
and incorporate the Creative Commons Attribution
- Non Commercial (unported, 3.0) License.
By accessing the work you hereby accept the Terms. Non-commercial uses of the work are permitted
without any further permission from Dove Medical Press Limited, provided the work is properly
attributed. For permission for commercial use of this work, please see paragraphs 4.2 and 5 of our Terms.
© 2018 The Author(s). This work is published and licensed by Dove Medical Press Limited. The
full terms of this license are available at https://www.dovepress.com/terms
and incorporate the Creative Commons Attribution
- Non Commercial (unported, 3.0) License.
By accessing the work you hereby accept the Terms. Non-commercial uses of the work are permitted
without any further permission from Dove Medical Press Limited, provided the work is properly
attributed. For permission for commercial use of this work, please see paragraphs 4.2 and 5 of our Terms.