Back to Journals » ClinicoEconomics and Outcomes Research » Volume 7
Estimating health-state utility values for patients with recurrent ovarian cancer using Functional Assessment of Cancer Therapy – General mapping algorithms
Authors Hettle R, Borrill J, Suri G, Wulff J
Received 9 July 2015
Accepted for publication 1 October 2015
Published 26 November 2015 Volume 2015:7 Pages 615—627
DOI https://doi.org/10.2147/CEOR.S92078
Checked for plagiarism Yes
Review by Single anonymous peer review
Peer reviewer comments 3
Editor who approved publication: Professor Giorgio L Colombo
Robert Hettle,1 John Borrill,2 Gaurav Suri,1 Jerome Wulff1
1Parexel Consulting, London, 2AstraZeneca, Macclesfield, UK
Objectives: In the absence of EuroQol 5D data, mapping algorithms can be used to predict health-state utility values (HSUVs) for use in economic evaluation. In a placebo-controlled Phase II study of olaparib maintenance therapy (NCT00753545), health-related quality of life was measured using the Functional Assessment of Cancer Therapy – Ovarian (FACT-O) questionnaire. Our objective was to generate HSUVs from the FACT-O data using published mapping algorithms.
Materials and methods: Algorithms were identified from a review of the literature. Goodness-of-fit and patient characteristics were compared to select the best-performing algorithm, and this was used to generate base-case HSUVs for the intention-to-treat population of the olaparib study and for patients with breast cancer antigen mutations.
Results: Four FACT – General (the core component of FACT-O) mapping algorithms were identified and compared. Under the preferred algorithm, treatment-related adverse events had no statistically significant effect on HSU (P>0.05). Discontinuation of the study treatment and breast cancer antigen mutation status were both associated with a reduction in HSUVs (–0.06, P=0.0009; and –0.03, P=0.0511, respectively). The mean HSUV recorded at assessment visits was 0.786.
Conclusion: FACT – General mapping generated credible HSUVs for an economic evaluation of olaparib. As reported in other studies, different algorithms may produce significantly different estimates of HSUV. For this reason, it is important to test whether the choice of a specific algorithm changes the conclusions of an economic evaluation.
Keywords: platinum sensitive ovarian cancer, EQ 5D, maintenance therapy, olaparib
Introduction
Estimates of health-state utility (HSU) are an integral part of an analysis of the cost-effectiveness of a new therapy. Utility values are typically sourced either from a clinical study or from the published literature, using a validated generic preference-based multiattribute utility instrument, such as EuroQol (EQ)-5D. Where utility estimates relevant to the decision problem are not available directly from a clinical study or from the literature, it may be possible to use a mapping algorithm to translate scores recorded on a disease-specific instrument, such as Functional Assessment of Cancer Therapy (FACT), into a utility value using a generic measure, such as EQ-5D. The purpose of this research was to identify and apply possible mapping algorithms that could be used to estimate HSU values (HSUVs) for use in an economic model from FACT data collected in a Phase II trial of olaparib as maintenance therapy in patients with platinum-sensitive ovarian cancer.1,2
Olaparib is an oral poly(adenosine diphosphate-ribose) polymerase inhibitor that has been investigated as a maintenance treatment for women with platinum-sensitive relapsed serous ovarian cancer (PSROC) who have received two or more courses of chemotherapy and shown objective response to their last chemotherapy.1,2 In a Phase II randomized, double-blind, placebo-controlled study (NCT00753545), olaparib capsules (400 mg twice daily) significantly improved progression-free survival (hazard ratio 0.35, 95% confidence interval [CI] 0.25–0.49; P<0.0001), and had no observed detrimental effects on health-related quality of life (HRQoL).3 The safety profile of olaparib was considered appropriate for long-term maintenance therapy.2
In the olaparib study, HSU was not measured directly. HRQoL was measured using the FACT – Ovarian (FACT-O) questionnaire.1,2 FACT-O is a 39-item questionnaire that includes a general measure of QoL, FACT – General (FACT-G), and an ovarian cancer subscale.4 Both FACT-G and FACT-O are validated patient-reported instruments that have been used extensively in cancer trials.4 Literature evidence on the HSUV of patients with PSROC is limited.5 Only two clinical trials have reported HSUV in ovarian cancer.6,7 Both trials reported HSUVs from patients actively receiving chemotherapy. Only one trial reported HSUVs in patients with PSROC.8 These data may not adequately represent the HSUVs of patients eligible for maintenance therapy, given that patients in these clinical trials have recurrent disease requiring immediate chemotherapy, while patients eligible for maintenance therapy have successfully completed chemotherapy and achieved a complete or partial response. In addition, there may be differences in the tolerability profile of treatments given at the time HSUV is measured. Previous studies have demonstrated the use of mapping algorithms to generate HSUVs from FACT-G.9,10 The objectives of this retrospective analysis were to generate HSUVs from FACT data collected in NCT00753545, and to explore the associations between HSUVs and clinical events occurring in the study, with the purpose of generating HSUVs for an economic evaluation of olaparib maintenance therapy.
Materials and methods
The analysis was conducted in three phases: 1) identification of algorithms, 2) comparative appraisal of algorithms, and 3) modeling the association between HSUVs and clinical events in NCT00753545.
Identification of mapping algorithms
Relevant mapping algorithms were identified from a previously reported systematic review of HRQoL studies in ovarian cancer conducted in 2014,5 and hand-searching the Health Economic Research Centre (HERC) online database of HSUV-mapping studies.11 Further detail on the review methodology is provided in Supplementary materials. The hand-searching of the HERC database focused on algorithms that mapped FACT-O or FACT-G to HSUVs.
A preferred mapping algorithm was chosen to generate HSUVs for an economic evaluation. The criteria for selecting the preferred algorithm included a comparative assessment of goodness-of-fit statistics and a comparison of the characteristics of patients in NCT00753545 with the populations sampled to develop each algorithm. The goodness-of-fit indicators included prediction of mean, standard deviation, median, and range of values from the original mapping survey, alongside adjusted R2 and mean absolute error statistics. For each algorithm, a mean overall rank was calculated, with the best-performing algorithm having the lowest overall rank score.
Statistical analysis
All algorithms identified in the search were applied to the FACT-O or FACT-G data collected in NCT00753545. FACT data were collected at screening and at regular 4-weekly scheduled visits up to discontinuation of study drug.1 Data included in the mapping data set included: randomization group, breast cancer antigen mutation (BRCAm) status, adverse events (AEs; graded using the Common Terminology Criteria for Adverse Events), progression-free survival, time to first subsequent therapy following discontinuation of study treatment, and time to discontinuation of study treatment.1,2 The relationship between events and HSUVs was established by identifying FACT-O questionnaires collected within 7 days of a clinical event, including data collected at the time of an AE. A 7-day period was selected, because FACT-O requires respondents to evaluate their well-being over the previous 7 days.4
Analyses were conducted on the intention-to-treat (ITT), germ-line BRCAm, and BRCAm (germ-line and somatic mutation) populations. Summary statistics were generated for each of the four sets of HSUVs derived using the algorithms, and for each period of the study (screening, scheduled routine assessments every 28 days, and unscheduled assessments). All statistical analyses were conducted using the statistical software R.12
Statistical differences in the four sets of HSUVs were assessed using the concordance correlation coefficients (CCCs), Pearson CCs (PCCs), and a comparison of mean values using a paired t-test. CCCs and PCCs greater than 0.72 represented good agreement among HSUVs.9 Statistical significance was set at the 5% level. A 0.06-point change was considered to be a minimally important difference (MID) in EQ-5D, based on a study reporting a retrospective analysis of EQ-5D data collected from a sample of 534 cancer patients, including patients with ovarian cancer.13
Linear mixed-effect regression models were used to estimate the relationship between HSUVs and time since randomization, BRCAm status, randomization group, and clinical events. An initial analysis was conducted using single-variable regression models to identify individual factors associated with changes in HSUV, and a multivariable regression model was then developed to predict HSUVs. The factors included in the multivariable model were selected from the results of the single-variable analyses, and by application of a backward stepwise selection method using the Akaike information criterion (AIC) to exclude irrelevant factors.
Repeated measures of HSUVs were modeled using the random-effect component of the regressions. A series of correlation structures were assessed, with the lowest AIC used to select the appropriate structure. The variance–covariance matrix for the multivariate regression model is reported in Supplementary materials. Analysis was carried out using the NLME statistical package in the programming software R.14
Results
Identification of mapping algorithms
Four studies reporting the mapping of FACT to EQ-5D were identified from hand-searching the HERC database of mapping studies.11 Two of the four studies15,16 reported FACT – Prostate and FACT – Melanoma mapping. These studies were excluded because they used components specific to the diseases. The two remaining studies17,18 reported FACT-G to EQ-5D. One of the FACT-G studies reported two mapping algorithms (ordinary least squares [OLS] and Tobit).17
Two studies were retrieved from the systematic review.18,19 One of the studies18 was already reported in the HERC database. The other19 reported FACT-G to time trade-off mapping, and was not included in the database. None of the studies retrieved from the review or mapping database reported FACT-O to EQ-5D, and for this reason, the four FACT-G mapping algorithms (three studies) were applied in the analysis. A summary of the algorithms is provided in Table 1.
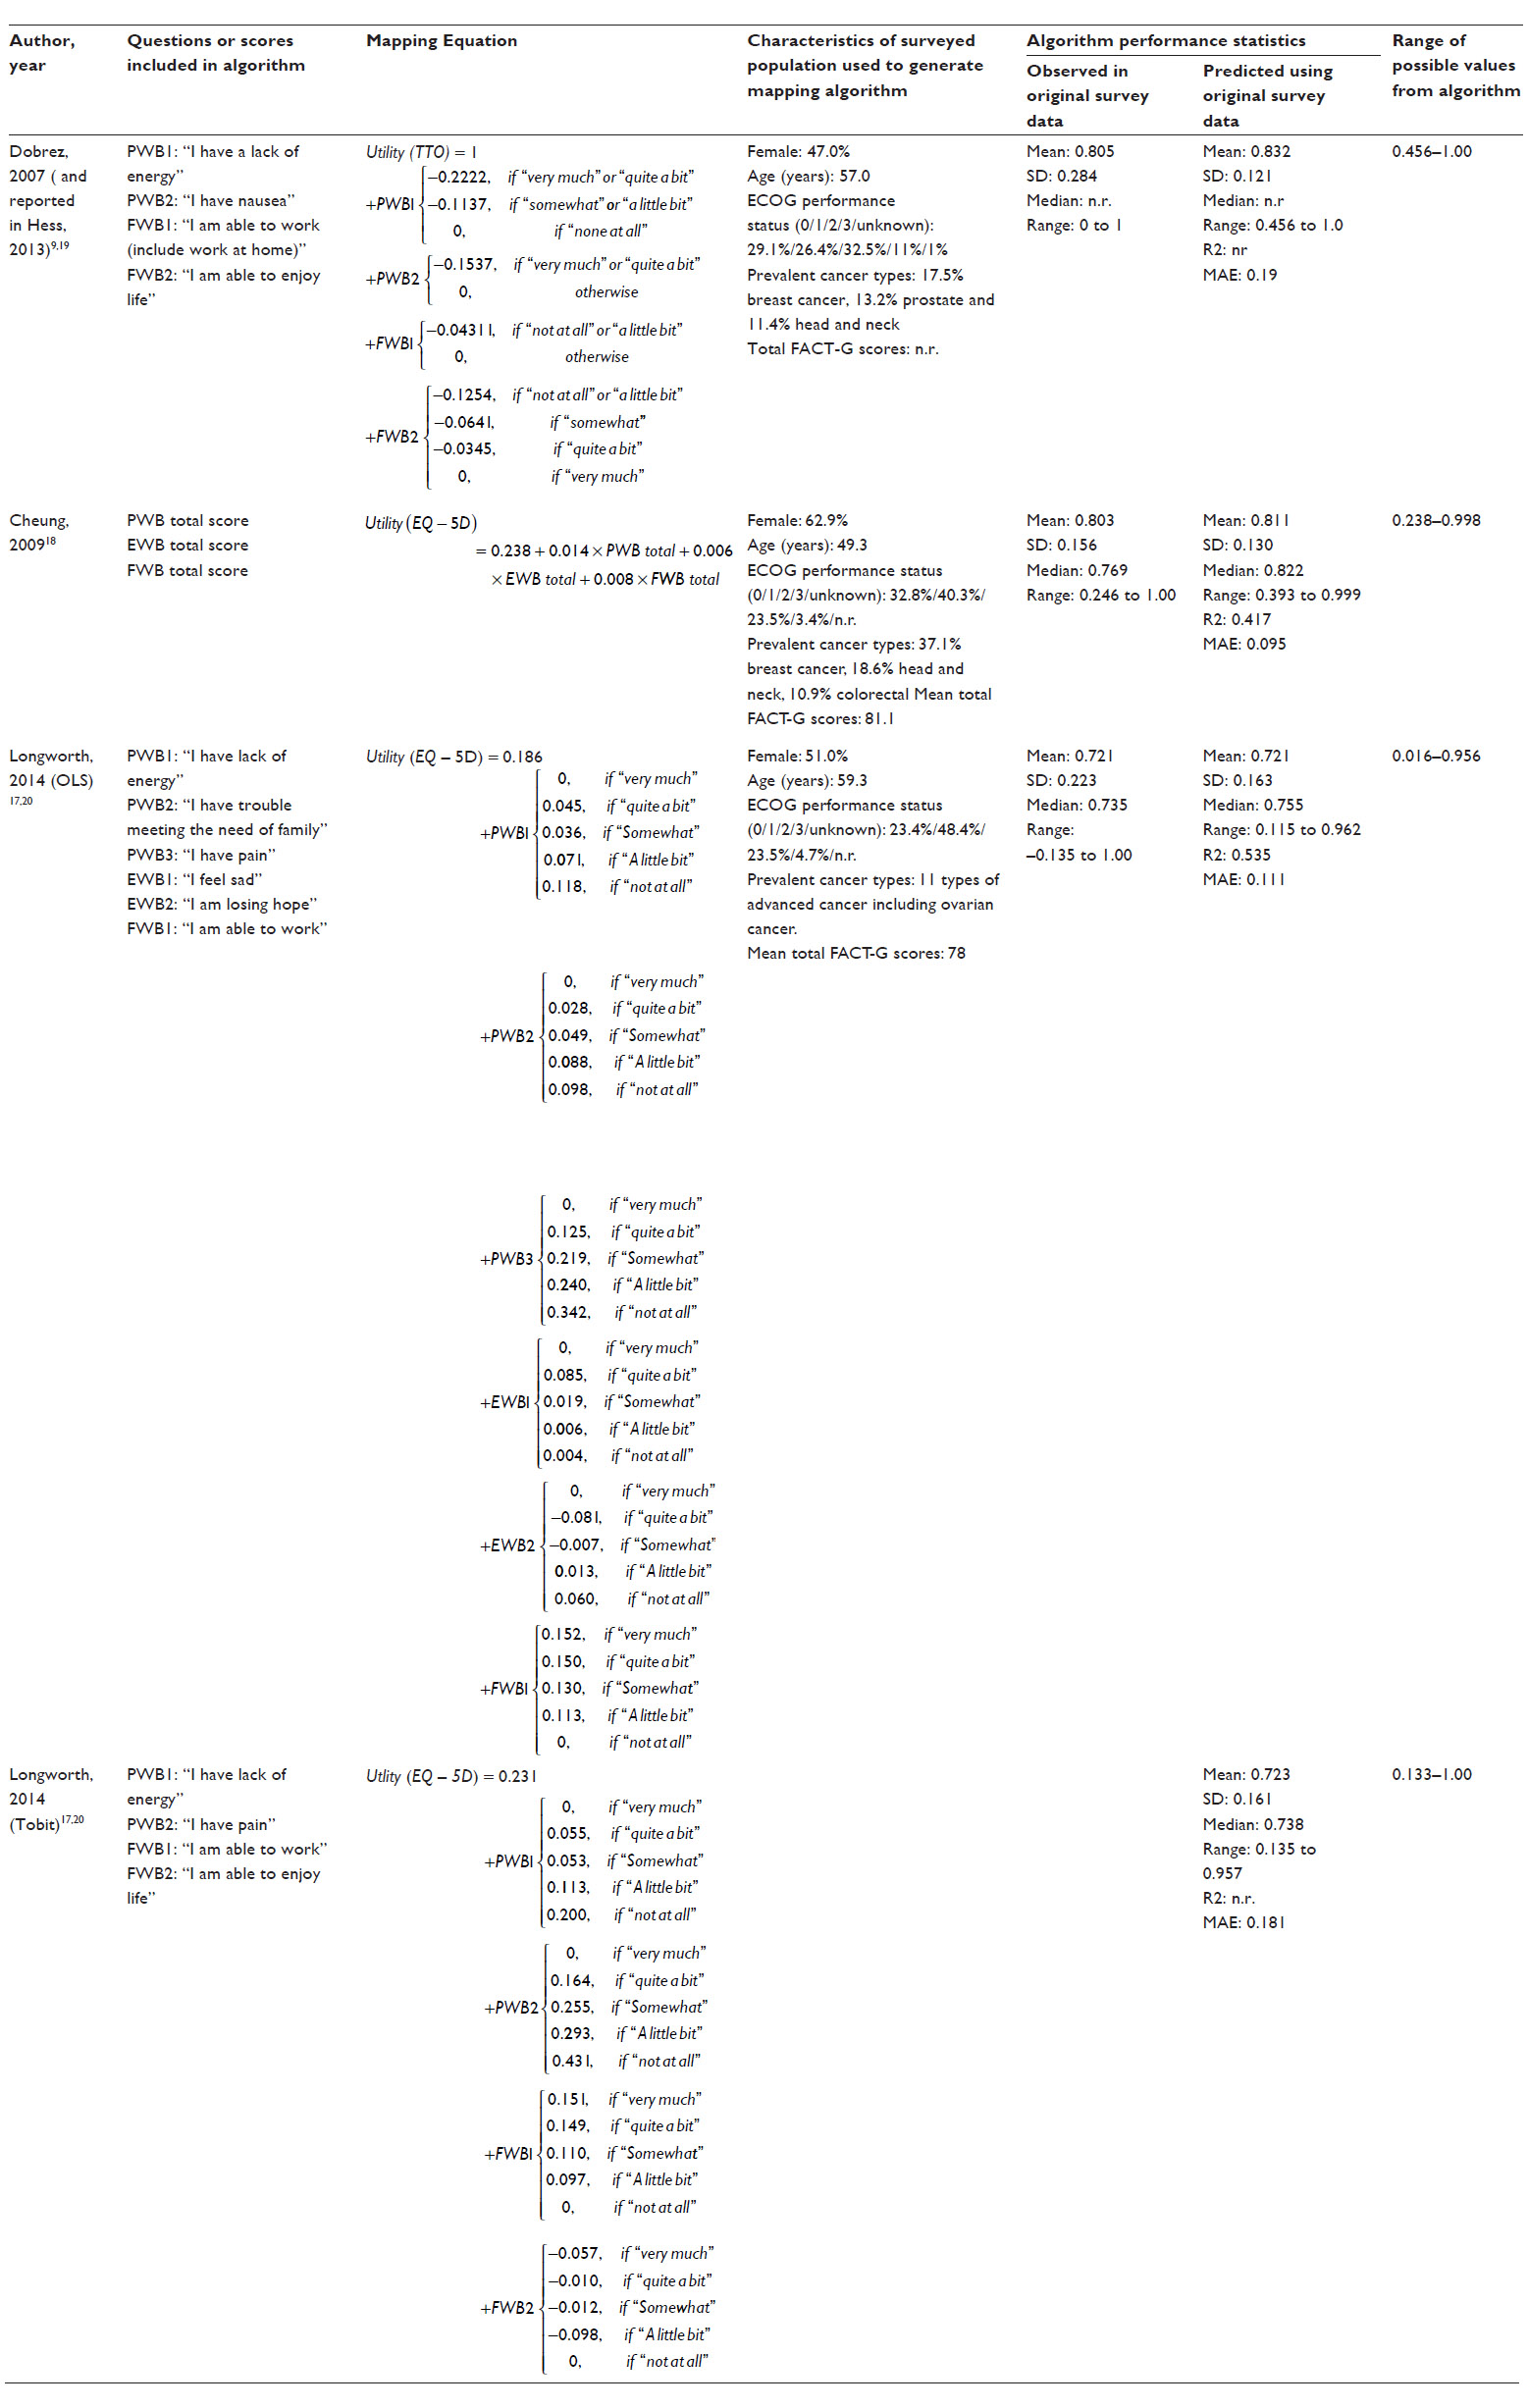 | Table 1 Utility algorithms identified from the systematic literature review and mapping database |
Comparison of algorithms
The four mapping algorithms were derived from data collected in three surveys that enrolled patients with a mixture of cancer types, Eastern Cooperative Oncology Group (ECOG) performance scores, and baseline demographics.17–20
The baseline age and ECOG performance status of the surveyed population in Longworth et al17 were broadly similar to the baseline values in NCT00753545 (59.5 vs 57.5 years, 71.8% vs 100% with ECOG status 0–1). By comparison, the surveyed population in Cheung et al18 was younger (49.3 years), and the surveyed population in Dobrez et al19 had higher ECOG scores at baseline (55.5% with ECOG 0–1) than the population in NCT00753545.
A varied mix of cancer types were reported in the surveyed populations (Table 1). The population in Longworth et al included patients with advanced gynecological cancer who had undergone at least two prior cycles of chemotherapy.17 The surveyed population in Cheung et al also included patients with advanced gynecological cancer (6%);18 however, exposure to past chemotherapy was not reported. None of the patients surveyed by Dobrez et al had gynecological cancer.9,19
The ranking of each algorithm by goodness of fit is shown in Table 2. Overall, the OLS algorithm was the best fit (mean 1.67), followed by Cheung et al (1.83), Tobit (2.40), and Dobrez et al (4.0). The OLS was the best-performing algorithm in predicting mean HSUV from its original surveyed population. The Dobrez et al algorithm was the lowest-ranked algorithm across all properties. The preferred algorithm for this analysis was Longworth et al’s OLS,17 chosen based on its goodness-of-fit profile and the comparability between NCT00753545 and the population used to derive the algorithm.
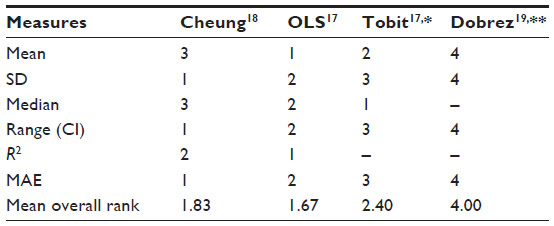 | Table 2 Rank for each algorithm by goodness-of-fit indicator |
Application to FACT-O data
All four algorithms were applied to patient-level FACT-O data from NCT00753545. HSUVs were generated for 247 of the 264 patients in NCT00753545 (Table 3). Applying the preferred algorithm (OLS), mean utility values in the ITT population were 0.786 (interquartile range: 0.699–0.885) and 0.720 (interquartile range: 0.632–0.820) for scheduled routine and unscheduled assessments, respectively. In the BRCAm subpopulation, mean utility values were 0.768 (0.681–0.871, scheduled routine assessments) and 0.708 (0.594–0.811, unscheduled assessments). Figure 1 shows the distribution of predicted HSUV, total FACT-G, and total FACT-O scores. The OLS and Cheung et al HSUVs were left-skewed, with values clustered toward the upper limit of 1. The Tobit and Dobrez et al HSUVs had a multimodal distribution, with values clustered in the ranges 0.80–0.85 and 0.95–1.00. The total FACT-G and FACT-O scores were left-skewed.
 | Table 3 Summary statistics for utilities by algorithm and patient population (pooled treatment groups) |
 | Figure 1 Distribution of utilities, total FACT-G scores, and total FACT-O scores across all observations in the study. |
There was strong statistical agreement between OLS and Tobit (CCC 0.915, 95% CI 0.907–0.923), and OLS and Cheung et al (CCC 0.851, 95% CI 0.838–0.863). In comparison to Dobrez et al, there was only moderate statistical agreement with OLS (CCC 0.629, 95% CI 0.604–0.653) and Tobit (CCC 0.619, 95% CI 0.593–0.643). The results of the PCC analysis were consistent with the concordance analysis (Supplementary materials). Between OLS, Cheung et al, and Dobrez et al, there were significant differences in mean HSUV (P<0.001). OLS and Tobit were not statistically different (P=0.947).
Table 4 shows the estimated coefficients for the single-variable and multivariable regression models. In the single-variable models, randomization to placebo (versus olaparib) and a positive BRCAm status were associated with lower HSUVs. The incidence of grade 1 or 2 and/or grade 3 or above AEs was associated with a decline in HSUVs (between –0.01 and -0.03). The coefficients for AEs and the randomization group were not statistically significant (P>0.05). There was no evidence of a time trend in the predicted HSUVs (P=0.290).
 | Table 4 Coefficients of mixed-effect regression model (OLS predicted utilities) |
Of the three measures of disease progression, only discontinuation of study drug was associated with a statistically significant (P=0.0001) and important (0.06) change in HSUVs. Radiological disease progression was associated with a numerical decline in HSUVs of 0.023 (P=0.065), which was not considered statistically significant. There was no change in HSUVs with the use of first subsequent therapy (P=0.792). The first subsequent treatment analysis should be interpreted with caution, because only ten FACT-G observations were recorded at the time of subsequent treatment.
In the multivariable modeling, treatment discontinuation (important and statistically significant predictor of HSUVs), AEs, randomized group (to reflect potential differences in HSUVs between groups), and BRCAm status (statistically significant predictor of HSUVs) were included in the stepwise algorithm. AEs were included as a categorical variable (AE grade 1–2 only, AE grade 3 or above only, both-grade AEs, and no AEs). Radiological progression and first subsequent therapy were not considered in the stepwise algorithm to avoid multicollinearity with treatment discontinuation.
In the stepwise routine, only BRCAm status and treatment discontinuation were included in the final model. AEs and the randomized group were dropped from the regression, as their inclusion increased the AIC value. Treatment discontinuation was associated with an important and statistically significant decline in HSUVs (–0.06, P=0.0009). Positive BRCAm status was associated with lower HSUVs (−0.03, P=0.0511), although the difference was not considered (clinically) important.
Discussion and conclusion
In this analysis, mapping algorithms were used to generate HSUVs from FACT-O data collected in a Phase II study of olaparib maintenance therapy for patients with PSROC. The Longworth et al OLS17 was selected as the preferred approach, because it was the highest-ranked on a series of goodness-of-fit indicators. A different preferred algorithm may have been selected if mean absolute error (Cheung et al) or prediction of median HSUV (Tobit) were the only selection criteria. Reimbursement decisions are typically based on the mean results of economic evaluations, making accurate prediction of mean HSUV a desirable property. On this basis, OLS was the best-performing algorithm.
The selection of a preferred algorithm becomes important when there are significant differences in mean HSUV, and this was the case in this analysis. This finding is consistent with a previous comparison of HSUVs generated by FACT-G mapping in patients with ovarian cancer.9 Mean HSUVs generated using OLS were similar to those generated using the Tobit regression and lower than those generated in Cheung et al18 and Dobrez et al.19 Between OLS and Dobrez et al, there was a clinically important difference in mean HSUV that was consistently observed across populations (ITT and BRCAm). These differences highlight the importance of assessing the HSUVs generated by different algorithms.
In the regression modeling, treatment discontinuation was the only statistically significant (P<0.05) and clinically important predictor of HSUVs. This association may be explained by the latent development of symptomatic disease, which triggers both the cessation of the study drug and decline in HSUVs. This is supported by data on the reasons for drug discontinuation in NCT00753545, where 87 of 113 olaparib patients and 110 of 125 placebo patients discontinued the drug because their condition worsened.2 The only other factor associated with a change in HSUVs was positive BRCAm status at baseline. The difference in HSUVs between BRCAm populations was not considered clinically important.
There was no significant or meaningful association between AEs, radiological progression, first subsequent therapy use, and HSUVs. The absence of a statistical association between radiological progression and HSUVs was unexpected, as previous analyses have reported meaningful differences between the progression phases of clinical trials.21,22 This finding has potential implications for any future economic evaluations of maintenance treatments in PSROC, as it indicates that changes in HSUVs should be modeled based on treatment discontinuation and not radiological progression. Despite these findings, radiological progression remains an important measure of the underlying tumor-growth rate and activity of antitumor therapy. Further research is required to replicate our findings.
One explanation for the lack of association between radiological progression and HSUVs is that a high proportion of patients had initially experienced asymptomatic progression, which masked the impact of progression on HSUVs. The common occurrence of asymptomatic progression is plausible in the context of NCT00753545, as the enrolled population was in disease remission at baseline, and progression of limited baseline disease (remission) may not lead to an immediate change in symptoms. An additional factor is the maturity of progression data in NCT00753545. Routine radiographic scanning was not required beyond the first interim analysis (June 2010).2 An analysis of the time to discontinuation of the study drug was conducted to assess radiological progression-free survival with additional maturity.2 In our analysis, treatment discontinuation was associated with a clinically important and statistically significant decline in HSUVs of 0.06, which was consistent with the difference in mean HSUV between progression phases of a previous study in PSROC (0.069, 0.718–0.649).8 With longer follow-up, a similar association between HSUVs and disease progression may have been observed.
The absence of a meaningful association between AEs and HSUVs may be explained by the effective management of AEs through concomitant medication, dose reduction (36% of olaparib patients), and treatment interruption (42% of olaparib patients).2 Olaparib is generally well tolerated and AEs considered to be manageable, and this is reflected in the small number of patients who permanently discontinued treatment due to AEs (nine of 264 patients) in the study.2 There was no significant or meaningful difference in HSUVs between olaparib and placebo-treated groups throughout the study follow-up, indicating that there was no detrimental effect of olaparib on HRQoL. This finding is consistent with the primary analysis of FACT-O in NCT00753545.3 As an adjustment for the randomized group was not required, the summary HSUVs reported in this study can be applied to both patient groups in future cost–utility evaluations (eg, the same HSUVs should be applied to patients receiving olaparib and to patients undergoing routine disease surveillance [placebo]).
External validation of the results of this analysis is challenging, given that the objective was to fill an evidence gap on the HSUVs of patients receiving maintenance treatment. Only one clinical study had previously reported HSUVs in PSROC:5 the OVA-301 trial.7,23 By comparison, the mean HSUVs (0.786) in the ITT population of NCT00753545 were higher than those reported in OVA-301.8 Patients in these studies were at different stages of treatment when data were collected; OVA-301 patients were actively undergoing chemotherapy, whereas patients enrolled in NCT00753545 had completed chemotherapy and were in clinical remission. Reassuringly, the mean HSUV reported at the unscheduled visit (0.720, Table 3) of NCT00753545, where the majority of patients had discontinued the study drug and were candidates for subsequent chemotherapy, was comparable to the HSUV reported during the chemotherapy-treated phase of OVA-301 (0.718).21
The analysis presented in this paper is subject to a number of limitations. Our analysis considers the generation of HSUVs using mapping algorithms and patient-level data from NCT00753545. HSUVs generated through mapping analyses tend to be associated with increased uncertainty and error when compared to HSUVs collected from patients.24 We addressed this uncertainty by using four different mapping algorithms to generate a range of plausible HSUVs for use in economic evaluations. Our preferred algorithm generated conservative estimates of the HSUVs of maintenance patients, when compared to Cheung et al, Dobrez et al, and Tobit.
The interpretation of our results also depends on the definition of an MID in HSUVs. In our analysis, the threshold for meaningful change was predefined at the level of 0.06, based on a published study of MIDs in EQ-5D in patients with cancer.13 Other studies have reported MIDs between 0.033 and 0.082 in noncancer-specific populations.25,26 Across studies, there is variability in the threshold for an important change, which results from differences in methodology and the effects of variability in patient characteristics on threshold values.27 Because of the effects of patient variability, our predefined MID was set using data from a cancer-specific study. Reassuringly, the threshold used in our analysis is consistent with values reported elsewhere.25,26
The lack of association between AEs and HSUVs may also be partly explained by a limitation in data collection in NCT00753545. This is because the association between HSUVs and AEs was modeled by identifying FACT-O data collected at the time of an event. FACT-O data were collected at screening, scheduled visits, and on treatment discontinuation. Between scheduled visits, patients may have experienced an event that resolved prior to the next FACT-O assessment. To comprehensively capture the effect of AEs on HSUVs, data should be collected at the time of the event, where feasible.
Because of a lack of published algorithms, we were unable to map FACT-O to HSUVs directly. The impact of excluding the ovarian subscale of FACT-O from the analysis is unclear, and can only be assessed through the development of a FACT-O mapping algorithm, and by comparing the HSUVs generated with this algorithm to those estimated in this analysis. Future studies should consider the use of FACT-O mapping algorithms, if algorithms become available.
Importantly, the use of different algorithms may impact on the conclusions of cost–utility analyses. For example, the application of higher HSUVs can lead to higher quality-adjusted life-year gains for more effective treatments, as each additional year free of health complications is assigned a higher quality-adjusted weight. Because of this, it is important to justify the choice of algorithm used in the base-case analysis. To do this requires an understanding of which of the available algorithms is likely to provide the most robust estimate of HSUVs. The approach adopted in this study was to select a preferred algorithm by ranking each algorithm on predefined criteria. This assessment was conducted prior to mapping. The preferred algorithm was then used to generate the base-case HSUV. With this approach, decision makers can have greater confidence that the most appropriate algorithm was used, as opposed to the one that yields the most favorable cost–utility estimate. However, there is no guarantee that the preferred algorithm will generate the most clinically plausible HSUVs, and thus it remains important to assess the impact of different algorithms on predicted HSUVs and associated cost–utility estimates.
The justification for choice of preferred mapping algorithm is also particularly important when presented with a large number of competing algorithms and thus potential HSUVs. In our analysis, only four relevant algorithms were identified, and thus it was feasible to compare all potential HSUVs. Appropriate algorithm selection will become more important, though, as the number of published mapping studies increases and it becomes less feasible to compare all potential HSUVs. The assessments we used to select our preferred algorithm may also be used in excluding algorithms considered to have poor performance or lacking relevance. This approach may help in screening for algorithms that best meet the requirements of the analysis, where it is not feasible to consider all potential HSUVs.
Conclusion
In conclusion, the results of this analysis addressed an important evidence gap in the economic evaluation of ovarian cancer. The mean HSUVs generated in this analysis appear consistent with the existing literature, although different algorithms generated different HSUVs. OLS provides a plausible and conservative estimate of HSUVs in this population that can be used in economic evaluations of maintenance treatment in PSROC. Further research will be necessary to validate the findings of this analysis using HSUV data to be collected in future clinical studies of olaparib in PSROC.
Acknowledgments
The authors would like to acknowledge the input of Professor John Posnett, who provided editorial support and insightful comments on the draft manuscript. This research was funded by AstraZeneca PLC. Heron Commercialization is an independent consultancy that received funding from AstraZeneca for this project. Part of this research was presented at the International Society for Pharmacoeconomics and Outcomes Research 17th Annual European Congress as a poster presentation with interim findings. The poster’s abstract was published in the Value in Health journal (http://www.valueinhealthjournal.com/article/S1098-3015(14)04271-5/abstract). The actual paper, however, has never been published.
Disclosure
RH, GS, JW work for Parexel Consulting, JB works for AstraZeneca. The authors report no other conflicts of interest in this work.
Reference
Ledermann J, Harter P, Gourley C et al. Olaparib maintenance therapy in platinum-sensitive relapsed ovarian cancer. N Engl J Med 2012;366:1382–1392. | |
Ledermann J, Harter P, Gourley C et al. Olaparib maintenance therapy in patients with platinum-sensitive relapsed serous ovarian cancer: a preplanned retrospective analysis of outcomes by BRCA status in a randomised phase 2 trial. Lancet Oncol 2014. | |
Ledermann J, Harter P, Gourley C et al. Health-related quality of life (HRQOL) during olaparib maintenance therapy in patients with platinum-sensitive relapsed serous ovarian cancer (PSROC) and a BRCA mutation (BRCAM) [abstract]Ledermann J, Harter P, Gourley C et al. Ann Oncol 2014;25 | |
Basen-Engquist K, Bodurka-Bevers D, Fitzgerald MA et al. Reliability and validity of the functional assessment of cancer therapy-ovarian. J Clin Oncol 2001;19:1809–1817. | |
Al-Kakkak I, Borrill J, Murphy E, et al. A systematic review of health state utility values for advanced ovarian cancer. The International Society for Pharmacoeconomics and Outcomes Research 17th Annual European Congress; 14 Nov 8; 2014. | |
Perren TJ, Swart AM, Pfisterer J et al. A phase 3 trial of bevacizumab in ovarian cancer. N Engl J Med 2011;365:2484–2496. | |
Monk BJ, Herzog TJ, Kaye SB et al. Trabectedin plus pegylated liposomal doxorubicin in recurrent ovarian cancer. J Clin Oncol 2010;28:3107–3114. | |
Krasner CN, Poveda A, Herzog TJ et al. Patient-reported outcomes in relapsed ovarian cancer: results from a randomized Phase III study of trabectedin with pegylated liposomal doxorubicin (PLD) versus PLD alone. Gynecol Oncol 2012;127:161–167. | |
Hess LM, Brady WE, Havrilesky LJ et al. Comparison of methods to estimate health state utilities for ovarian cancer using quality of life data: a Gynecologic Oncology Group study. Gynecol Oncol 2013;128:175–180. | |
Pickard AS, Ray S, Ganguli A, Cella D. Comparison of FACT- and EQ-5D-based utility scores in cancer. Value Health 2012;15:305–311. | |
University of Oxford. Health Economics Research Centre database of mapping studies. http://www herc ox ac uk/downloads/mappingdatabase [serial online] 2013. | |
R Core Team. R: A language and environment for statistical computing. 2015. Available from https://www.R-project.org. | |
Pickard AS, Neary MP, Cella D. Estimation of minimally important differences in EQ-5D utility and VAS scores in cancer. Health Qual Life Outcomes 2007;5:70. | |
Pinheiro J, Bates D, DebRoy S, Sarkar D, et al. nlme: Linear and Nonlinear Mixed Effects Models. 2015. Available from: http://CRAN.R-project.org/package=nlme. | |
Askew RL, Swartz RJ, Xing Y et al. Mapping FACT-melanoma quality-of-life scores to EQ-5D health utility weights. Value Health 2011;14:900–906. | |
Wu EQ, Mulani P, Farrell MH, Sleep D. Mapping FACT-P and EORTC QLQ-C30 to patient health status measured by EQ-5D in metastatic hormone-refractory prostate cancer patients. Value Health 2007;10:408–414. | |
Longworth L, Yang Y, Young T et al. Use of generic and condition-specific measures of health-related quality of life in NICE decision-making: a systematic review, statistical modelling and survey. Health Technol Assess 2014;18:1–224. | |
Cheung YB, Thumboo J, Gao F et al. Mapping the English and Chinese versions of the Functional Assessment of Cancer Therapy-General to the EQ-5D utility index. Value Health 2009;12:371–376. | |
Dobrez D, Cella D, Pickard AS, Lai JS, Nickolov A. Estimation of patient preference-based utility weights from the functional assessment of cancer therapy - general. Value Health 2007;10:266–272. | |
Pickard AS, De Leon MC, Kohlmann T, Cella D, Rosenbloom S. Psychometric comparison of the standard EQ-5D to a 5 level version in cancer patients. Med Care 2007;45:259–263. | |
National Institute for Health and Care Excellence. TA222: Trabectedin for the treatment of relapsed ovarian cancer. 2011. | |
National Institute of Health and Care Excellence. TA284: Bevacizumab in combination with paclitaxel and carboplatin for the first-line treatment of ovarian cancer. 2013. | |
Poveda A, Vergote I, Tjulandin S et al. Trabectedin plus pegylated liposomal doxorubicin in relapsed ovarian cancer: outcomes in the partially platinum-sensitive (platinum-free interval 6-12 months) subpopulation of OVA-301 phase III randomized trial. Ann Oncol 2011;22:39–48. | |
Decision Support Unit at the National Institute for Health and Care Excellence. Technical Support Document 10: The use of mapping methods to estimate health state utility values. http://www nicedsu org uk/TSD%2010%20mapping%20FINAL.pdf [serial online] 2014. | |
Dolan P. Modeling valuations for EuroQol health states. Med Care 1997;35:1095–1108. | |
Luo N, Johnson J, Coons SJ. Using instrument-defined health state transitions to estimate minimally important differences for four preference-based health-related quality of life instruments. Med Care 2010;48:365–371. | |
Bedard G, Zeng L, Lam H et al. Meaningful change in oncology quality-of-life instruments: a systematic literature review. Expert Rev Pharmacoecon Outcomes Res 2012;12:475–483. |
Supplementary materials
A systematic review was carried out with the aim of identifying and synthesizing evidence from studies reporting utility values in patients with advanced ovarian cancer measured using direct (standard gamble [SG], time trade-off (TTO), or visual analog scale [VAS]) or indirect (EuroQol [EQ]-5D, Standard form 6 dimension (SF-6D), or health utility index [HUI]-3) instruments. The electronic databases Embase and Medline were searched in June 2013 using the search terms presented in Table S1. Bibliographic screening of included publications was also carried out to identify any additional studies. In addition, hand-searching was also carried out in health-technology assessment websites, including National Institute for Health and Care Excellence (NICE), Haute Autorite’ de sante’ (HAS), The Norwegian Medicines Agency (NOMA), Canadian Agency for Drugs and Technologies in Health (CADTH), Pharmaceutical Benefits Advisory Committee (PBAC), Institute for Quality and Efficiency in Health Care (IQWiG), The Dental and Pharmaceutical Benefits Agency (TLV), Scottish Medicines consortium (SMC). Data were extracted from selected studies that included study design, country, elicitation methods, health-state description, mean (standard deviation), or median of utility values. The variance–covariance matrix for the multivariable regression analysis is reported in Table S2. The results of Pearson correlation-coefficient analysis assessing the correlation between algorithms are reported in Table S3.
 | Table S1 Search terms used for identification of studies reporting health-state utility values |
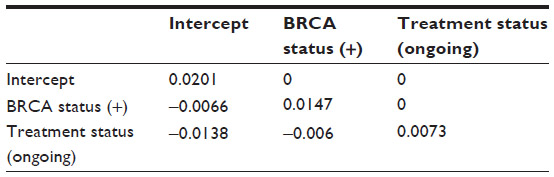 | Table S2 Variance–covariance matrix for the optimized multivariable analysis |
 | Table S3 Pearson correlation coefficients between sets of utility values generated by different algorithms |
References
National Institute for Health and Care Excellence. Sorafenib for the Treatment of Advanced Hepatocellular Carcinoma. London: NICE; 2010. | |
National Institute for Health and Care Excellence. Bevacizumab in Combination with Gemcitabine and Carboplatin for Treating the First Recurrence of Platinum-Sensitive Advanced Ovarian Cancer. London: NICE; 2013. | |
Al Rawahi T, Lopes AD, Bristow RE, et al. Surgical cytoreduction for recurrent epithelial ovarian cancer. Cochrane Database Syst Rev. 2013;2:CD008765. | |
Morrison J, Haldar K, Kehoe S, Lawrie TA. Chemotherapy versus surgery for initial treatment in advanced ovarian epithelial cancer. Cochrane Database Syst Rev. 2012;8:CD005343. | |
Tangjitgamol S, Manusirivithaya S, Laopaiboon M, Lumbiganon P, Bryant A. Interval debulking surgery for advanced epithelial ovarian cancer. Cochrane Database Syst Rev. 2013;4:CD006014. |
 © 2015 The Author(s). This work is published and licensed by Dove Medical Press Limited. The
full terms of this license are available at https://www.dovepress.com/terms
and incorporate the Creative Commons Attribution
- Non Commercial (unported, 3.0) License.
By accessing the work you hereby accept the Terms. Non-commercial uses of the work are permitted
without any further permission from Dove Medical Press Limited, provided the work is properly
attributed. For permission for commercial use of this work, please see paragraphs 4.2 and 5 of our Terms.
© 2015 The Author(s). This work is published and licensed by Dove Medical Press Limited. The
full terms of this license are available at https://www.dovepress.com/terms
and incorporate the Creative Commons Attribution
- Non Commercial (unported, 3.0) License.
By accessing the work you hereby accept the Terms. Non-commercial uses of the work are permitted
without any further permission from Dove Medical Press Limited, provided the work is properly
attributed. For permission for commercial use of this work, please see paragraphs 4.2 and 5 of our Terms.